Geographical Skills (CIE IGCSE Geography)

Topic Questions

1a5 marks

Study the map extract for Misterbianco, Italy. The scale is 1:50000.

(a)
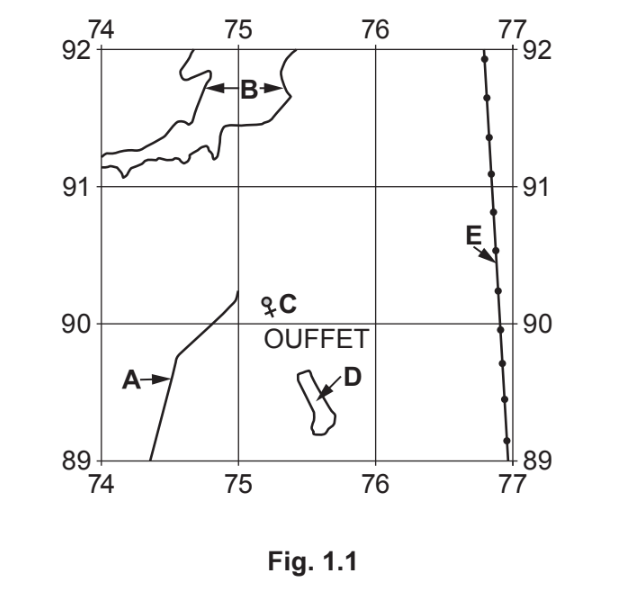
Fig. 1.1 shows some of the features around the main settlement at Misterbianco in the north east of the map extract. Study Fig. 1.1 and the map extract, and answer the questions below.
q1a-0460_w20_qp_21

Using the map extract, identify the following features shown in Fig. 1.1:

(i)
the type of road at A

[1]

(ii)
the type of road at B

[1]

(iii)
the height above sea level of the spot height at C ................................ metres

[1]

(iv)
feature D

[1]

(v)
feature E.

[1]

1b6 marks
(b)
Fig. 1.2 shows two areas, A and B, in the south west of the map extract. Study the two areas and answer the questions below.
q1b-0460_w20_qp_21

The table below compares the features of the two areas. Complete the table by putting ticks in the correct six boxes. Use only one tick (3) for each row.

Feature Area A Area B Both these
areas
Neither of
these areas
river flowing from south to north        
meandering river        
river flowing from north to south        
either flat or gently sloping        
steep slopes        
plateau        

1c3 marks
(c)
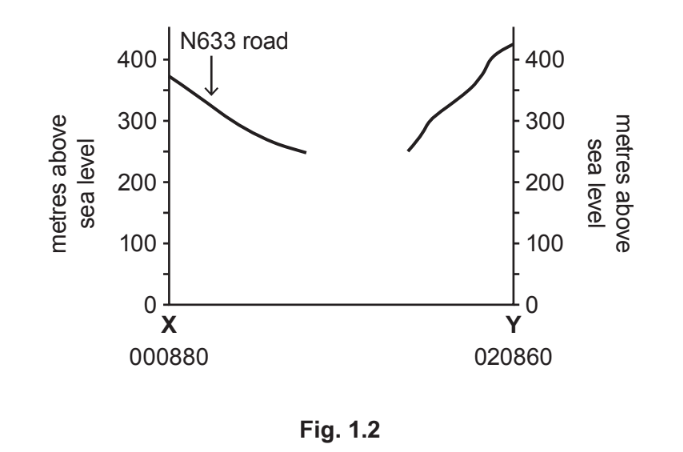
Fig. 1.3 is a cross section through the settlement of Motta S. Anastasia, along northing 52, from 940520 to 000520.

q1c-0460_w20_qp_21
(i)
Identify the feature X.

[1]

(ii)
Name the river at Y.

[1]

(iii)
In Fig. 1.3, use a labelled arrow to show the position of the settlement of Motta S. Anastasia.

[1]

1d4 marks
(d)
A railway in the southern part of the map extract is shown by a thin black line. Find where the railway crosses a wide river near Staz.di Motta S. Anastasia.

(i)
What is the distance along the railway, from where it crosses the wide river, to the eastern edge of the map? Give your answer in metres.
.............................................. metres
[1]
(ii)
What is the compass direction from where the railway crosses the wide river, to where the railway meets the eastern edge of the map?
[1]
(iii)
Measure the bearing from where the railway crosses the wide river, to where the railway meets the eastern edge of the map.
.............................................. degrees
[1]
(iv)
Give the six-figure grid reference of the point where the railway crosses the wide river.
[1]
1e2 marks
(e)
Fig. 1.4 shows two areas, area P in the north west of the map extract and area Q in the north east of the map extract just south of Misterbianco.
q1e-0460_w20_qp_21

Identify:

(i)
the settlement pattern in area P

[1]

(ii)
the stream pattern in area Q.

[1]

Did this page help you?

2a1 mark

Fig. 5.1 shows information about the states most affected by soil erosion in one year in the USA. Information is shown for two types of soil erosion: by wind and by water.

q5a-0460_w20_qp_21

(a)
How much soil was eroded by water in Missouri?

.............................................. million tonnes
2b2 marks
(b)
Fig. 5.2 shows the location of the states listed in Fig. 5.1.
screenshot-2023-05-06-at-16-35-18
Fig. 5.1 
q5b-0460_w20_qp_21
(i)
Which of the following statements describes the location of the states in Fig. 5.2? Tick one box below.

  Tick (✓)
mostly in the centre  
mostly in the south  
mostly in the west  

(ii)
Using Figs. 5.1 and 5.2, give one difference between the distribution of the states with soil erosion by wind and the distribution of the states with soil erosion by water.
2c3 marks
(c)
Fig. 5.3 shows the rainfall of the states shown in Figs. 5.1 and 5.2.
q5c-0460_w20_qp_21

(i)
Using Figs. 5.1, 5.2 and 5.3, describe how the amount of rainfall affects whether soil erosion is by wind or by water.

[1]

(ii)
Explain why the amount of rainfall affects whether soil erosion is by wind or by water.
[2]

Did this page help you?

3a4 marks

Study the map extract for Biancavilla, Italy. The scale is 1:50000.

a)
Fig. 1.1 shows some of the features around the settlement at S. Maria di Licodia in the south east of the map extract. Study Fig. 1.1 and the map extract, and answer the questions below.

q1a-nov-2020-paper-22-cie-igcse-geo

Using the map extract, identify the following features shown in Fig. 1.1:
(i) the name of river A

[1]

(ii) the height above sea level of the spot height at B

.................................... metres                                                                                                               [1]

(iii) feature C

 [1]

(iv) feature D

[1]

(v) feature E.

 [1]

3b
Sme Calculator
4 marks
b)
Fig. 1.2 shows two areas, P in the south west of the map extract and Q, in the north east of the map extract. Study the two areas and answer the questions below.

q1b-nov-2020-paper-22-cie-igcse-geo
The table below compares the features of the two areas. Complete the table by putting ticks in the correct four boxes. Use only one tick (⩗) for each row.

Feature Area P Area Q Both these areas Neither of these areas
a railway        
dispersed settlement        
dense settlement        
land over 900m above sea level        

Did this page help you?

4a6 marks

Study the map extract for Stoumont, Belgium. The scale is 1:50000.

(a)
Fig. 1.1 shows some of the features around the main settlement at Stoumont. Study Fig. 1.1 and the map extract, and answer the questions below.

q1a-0460-s20-qp-21
Using the map extract, identify the following features shown in Fig. 1.1:
(i)
feature A
[1]
(ii)
the land use at B
[1]
(iii)
the height above sea level of the contour at C
.............. metres
[1]
(iv)
feature D
[1]
(v)
feature E
[1]
(vi)
feature F
[1]
4b1 mark
(b)
What is the six-figure grid reference of the junction at point G in Fig. 1.1?
4c3 marks
(c)
Fig. 1.2 is a cross section from point X to point Y in Fig. 1.1.

q1c-0460-s20-qp-21
(i)
The cross section shown in Fig. 1.2 is incomplete. Using information from the map extract, draw a line on Fig. 1.2 to complete the cross section.
[2]
(ii)
In Fig. 1.2, use a labelled arrow to show the position of the L’Amblève river.
[1]
4d6 marks
(d)
Find the N645 road that runs from near the settlement of Chevron in the south west of the map extract to the bridge over the L’Amblève river.

(i)
What is the distance along the road from the south edge of the map to the bridge over the L’Amblève river? Tick (✓) one box below.

  Tick (✓)
3780 metres  
4780 metres  
5500 metres  
7780 metres  

[1]

(ii)
What is the compass direction from the point where the road meets the south edge of the map to the bridge over the L’Amblève river?
[1]
(iii)
Measure the bearing from the point where the road meets the south edge of the map to the bridge over the L’Amblève river.
.............................. degrees
[1]
(iv)
Describe the route of the N645 road.

[3]

4e3 marks
(e)
Fig. 1.3 shows an area in the north east of the map extract.

Which three of the following statements describe the relief of the area shown in Fig. 1.3? Tick (✓) only three boxes below.

  Tick (✓)
The highest point is over 550m.  
It is an area of gentle slopes.  
It is lowest in the north.  
The lowest land is below 200m.  
It is an area of deeply cut relief.  
There is a river flood plain.  
There is a plateau in the south.  
The slopes face north.  
There is a V-shaped valley.  
It is a mountainous area.  
4f1 mark
(f)
Look at the main settlement on the map extract at Stoumont. Give one reason for the growth of the settlement.

Did this page help you?

5a5 marks

Study the map extract for Hamoir, Belgium. The scale is 1:50000.

(a)
Fig. 1.1 shows some of the features around the settlement at Ouffet in the north west of the map extract. Study Fig. 1.1 and the map extract, and answer the questions below.

BmAOQb7X_q1a

Using the map extract, identify the following features shown in Fig. 1.1:

(i) feature A

[1]

(ii) the height above sea level of the contour at B
............................. metres

[1]

(iii) feature C

 [1]

(iv) the land use at D

 [1]

(v) feature E.

 [1]

5b1 mark
(b)
Describe the pattern of main and secondary roads in the area shown on Fig. 1.1.

[1]

5c4 marks
(c)
Look at the part of the N66 road that runs from the bridge over the river at Hamoir to the east edge of the map extract.

(i)
What is the distance along the road from the bridge over the river at Hamoir to the east edge of the map extract? Tick one box below.

  Tick
(✓)
6500 metres  
7500 metres  
8500 metres  
9500 metres  
 
[1]
(ii)
What is the compass direction from the bridge over the river at Hamoir to where the N66 road meets the east edge of the map extract?
 [1]
(iii)
Measure the bearing from the bridge over the river at Hamoir to where the N66 road meets the east edge of the map extract.

          ............................................... degrees

[1]

(iv)
Give the six-figure grid reference of the bridge over the river at Hamoir.
 [1]
5d3 marks
(d)
Fig. 1.2 is a cross section along northing 90 from 770900 to 830900.

q1d
(i)
On Fig. 1.2, use labelled arrows to show the position of:

• the main river

• the Chat. de Renal (shown by a symbol for a castle)
[2]
(ii)
The cross section shown on Fig. 1.2 is incomplete. Using information from the map extract, draw a line on Fig. 1.2 to complete the cross section.
[1]
5e3 marks
(e)
Which three of the following statements describe the main river on the map extract? Tick only three boxes below.

  Tick (✓)
Its valley has gentle sides.  
It is meandering.  
It has no tributaries.  
It is always to the east of the railway.  
It has a flood plain of varying width.  
There is no settlement on its banks.  
It is a braided river.  
It flows from east to west.  
It is about 50m wide.  
It is about 150m wide.  
 
[3]
5f4 marks
(f)
Look at the settlement at Hamoir. Describe the site and give reasons for the growth of the settlement.

Did this page help you?

6a6 marks

Study the map extract for Esneux, Belgium. The scale is 1:50000.

(a)
Fig. 1.1 shows some of the features in the north west of the map extract. Study Fig. 1.1 and the map extract, and answer the questions below.

q1a-0460-s20-qp-23

Using the map extract, identify the following features shown in Fig. 1.1:

(i)
feature A
 [1]
(ii)
feature B
 [1]
(iii)
feature C
 [1]
(iv)
feature D
 [1]
(v)
the height above sea level of the geodetic (trigonometric) point at E
.......................................................... metres
[1]
(vi)
the height above sea level of the contour at F
.......................................................... metres
[1]
6b4 marks
(b)

Find the small settlements at Tavier and Hody in the south west of the map extract. Both settlements have a church.

(i)
What is the straight-line distance from the church at Tavier to the church at Hody? Give your answer in metres.
.......................................................... metres
[1]
(ii)
What is the compass direction from the church at Tavier to the church at Hody?
[1]

(iii)
Measure the bearing from the church at Tavier to the church at Hody.
.......................................................... degrees
[1]
(iv)
Give the six-figure grid reference of the church at Tavier.
 [1]


6c3 marks
(c)
Fig. 1.2 is a cross section along northing 00 from 810000 to 860000.
q1c-0460-s20-qp-23

(i)

In Fig. 1.2, use labelled arrows to show the position of:

• the N633 road
• the railway
[2]

(ii)
The cross section shown in Fig. 1.2 is incomplete. Using information from the map extract, draw a line in Fig. 1.2 to complete the cross section.
[1]
6d3 marks
(d)
 Fig. 1.3 shows an area in the south of the map extract.
q1d-0460-s20-qp-23

Which three of the following statements describe the relief and drainage of the area shown in Fig. 1.3? Tick only three boxes below.

  Tick ()
It is an area of steep and gently sloping relief  
It is a mountainous area  
It is flat land  
The highest point is 250m  
The area is all steeply sloping  
There is a flood plain  
The land is below 300m  
There are few rivers  
There is a large river  
There is swamp or marsh  

[3]

6e4 marks
(e)
Find the settlement of Douxflamme in the south east of the map extract. Describe the site and reasons for the growth of the settlement.
[4]

Did this page help you?

7a5 marks

Study the map extract for Degeberga, Sweden. The scale is 1:50000.

(a)
Fig. 1.1 shows some features in the west of the map extract around the main settlement of Degeberga.

q1-1a-0460-w19-qp-22
Using the map extract, identify the following features shown on Fig. 1.1:

(i)
feature A
[1]
(ii)
feature B
[1]
(iii)
feature C
[1]
(iv)
the height above sea level at spot height D

.................... metres
[1]
(v)
the height above sea level of contour E.

..................... metres
[1]
7b5 marks
(b)
Fig. 1.2A shows an area in the north west of the map extract and Fig. 1.2B shows an area in the south east of the map extract. Study the two areas and answer the questions below.

q1-1b-0460-w19-qp-22 
The table below compares the features of the two areas. Complete the table by putting ticks in the correct five boxes. Use only one tick for each row.

  Area in
Fig. 1.2A
Area in
Fig. 1.2B
Both these
areas
Neither of
these areas
Example: motorway       ✓
flat land        
steep land        
gentle slopes        
mostly forest        
mostly arable land        

[5]

7c4 marks
(c)
Fig. 1.3 shows a cross section along northing 86 from 440860 to 510860.

q1-1c-0460-w19-qp-22
(i)
On Fig. 1.3, use labelled arrows and the letter shown to show the positions of:

public road 19 (X)

the Segesholmsån river (Y).
[2]
(ii)
On Fig. 1.3, complete the cross section.
[2]
7d2 marks
(d)
Look at the coastal settlement around Nyehusen and Furuboda. Give map evidence that suggests that this is a tourist settlement.
[2]
7e4 marks
(e)
Find the following two triangulation points:

the 22m triangulation point south of Nyehusen

the 129m triangulation point near Norrlia, south of Degeberga.

(i)
Give the compass direction from the 129m triangulation point to the 22m triangulation point.
[1]
(ii)
Measure the bearing from the 129m triangulation point to the 22m triangulation point.
........................ degrees
[1]
(iii)
What is the six-figure grid reference of the 129m triangulation point near Norrlia?
[2]

Did this page help you?

8a5 marks

Study the map extract for Knislinge, Sweden. The scale is 1:50000.

Fig. 1.1 shows some of the features in the west of the map extract.

q1-1-0460-w19-qp-23

a)

Using the map extract, identify the following features shown in Fig. 1.1:
   (i) feature A

 [1]

(ii) the type of land at B

[1]

(iii) the type of natural vegetation at C

 [1]

(iv) the height of the contour D

 [1]

(v) feature E.

 [1]

8b2 marks
b)
Fig. 1.2 shows the area around the town of Knislinge.
q1-1b-0460-w19-qp-23
(i) State the width of the road labelled F.
.................................................... metres
[1]
(ii) Describe the general pattern of the main roads shown on Fig. 1.2.

[1]

8c
Sme Calculator
2 marks
c)
A runway to the east of Knislinge is labelled R on Fig. 1.2. Find this runway on the map extract.
(i) Measure the length of the surfaced section of the runway. Give your answer in metres.
.................................................... metres
[1]

(ii) Give the compass direction along the surfaced runway from the end near Sigfridssten to the other end near Bivarödsmölla.
[1]
8d4 marks
d)
Describe the features of the river between the western edge of the map extract at 380260 and its confluence with the river Helge å in grid square 4425.
[4]
8e
Sme Calculator
3 marks
e)
Fig. 1.3 shows the area around the town of Hanaskog.
q1-1e-0460-w19-qp-23

(i) Using the map extract, describe the distribution of the arable land in the area shown on Fig. 1.3.

[2]


(ii) Using the map extract, state one way in which the distribution of woodland in the area shown on Fig. 1.3 differs from that of the arable land.

 [1]

8f2 marks
f)
Find the lake called Araslövssjön in the south east of the map extract.

(i) Name the type of vegetation on the edges of the lake.
[1]
(ii) State one way in which the lake is used.
 [1]
8g2 marks
g)
Fig. 1.4 is a cross section along northing 23 from 400230 to 470230.
q1-1g-0460-w19-qp-23
On Fig. 1.4, using labelled arrows, mark the positions of:
(i) a railway (R
(ii) the river Kälan (K).

Did this page help you?

9a4 marks

Study the map extract for Laveissière, France. The scale is 1:25000.

(a)
Fig. 1.1 shows some of the features in the north east of the map extract. Study Fig. 1.1 and the map extract, and answer the questions below.

fig-1-1-qp-paper21-cie-igcse-geography

Fig. 1.1

Using the map extract, identify the following features shown in Fig. 1.1:

(i)
feature A
[1]
(ii)
type of area at B
[1]
(iii)
land use at C
[1]
(iv)

the height above sea level of the spot height at D.

.................................. metres

[1]
9b2 marks
(b)
A person travels along the road from the northern edge of the map to the junction with the D139 at la Chevade.

(i)
How far do they travel? Circle your answer in the list below.

3250m 3850m 4150m 4750m

[1]

(ii)
In which compass direction does the person travel?
[1]
9c4 marks
(c)
Fig. 1.2 is a north to south cross-section along easting 860 from 860980 to 860950.

fig-1-2-qp-paper21-cie-igcse-geography

Fig. 1.2

(i)
Name the feature at A.
[1]
(ii)
On Fig. 1.2, use a labelled arrow to show a position of the D139 road.
[1]
(iii)
The cross-section shown on Fig. 1.2 is incomplete. Using information from the map extract, draw a line on Fig. 1.2 to complete the cross-section.
[2]
9d3 marks
(d)
Fig. 1.3 is an area in the north of the map extract.
fig-1-3-qp-paper21-cie-igcse-geography
Fig. 1.3
Which three of the following statements describe the relief and drainage of the area shown on Fig. 1.3? Tick (✓) only three boxes below.

  Tick (✓)
it is flat land  
it has south-facing slopes  
there are many rivers  
it is a mountainous area  
it has gentle slopes  
highest point is above 1400 metres  
there is a large lake  
there are seasonal rivers  
9e7 marks
(e)
Laveissière is a settlement in the south of the map extract.

(i)
Describe the site of the settlement of Laveissière.
[4]
(ii)
Identify the services provided for tourists in the settlement of Laveissière.
[3]

Did this page help you?

10a5 marks

Study the map extract for Fortuniès, France. The scale is 1:25000.

(a)
Fig. 1.1 shows some of the features around the settlement of Collanges in the south of the map extract. Study Fig. 1.1 and the map extract and answer the questions below.

fig-1-1-paper-2-march-2021-cie-igcse-geography
Fig. 1.1

Using the map extract, identify the following features shown in Fig. 1.1:

(i)
feature A
[1]
(ii)
the name of river B

 [1]

(iii)
land use at C
[1]
(iv)
feature D
[1]
(v)
the height above sea level of the spot height at E.
............................................... metres [1]
10b3 marks
(b)
A person travels on the footpath from the north of the river outside Collanges (863013) to the junction with the footpath south east of les Ginestes (855022).

(i)
In which overall compass direction does the person travel?
[1]
(ii)
What distance does the person travel along the footpath?
............................................... metres [1]
(iii)
How many metres does the person climb? Circle one correct answer below.

802m 902m 102m 112m
[1]


10c5 marks
(c)
Fig. 1.2 shows the location of two grid squares in the east of the map extract. These are square 8802 at Lac de Sauvages and square 8902 at Peyre del Cayre. Study the two areas and answer the question below.

fig-1-2-paper-2-march-2021-cie-igcse-geography

Fig. 1.2

The table below compares the features of the two areas. Complete the table by putting ticks () in the correct five boxes. Use only one tick for each row.

  square 8802 at Lac de Sauvages square 8902 at Peyre del Cayre both these areas neither of these
parking        
steep slopes        
area liable to flooding        
land over 1200 m above sea level        
church        

[5]

10d3 marks
(d)
Fig. 1.3 is a cross-section along northing 025 from 860025 to 890025, passing through the village of Sauvages.

fig-1-3-paper-2-march-2021-cie-igcse-geography

Fig. 1.3

(i)
Identify the feature at A.
 [1]
(ii)
 Identify the feature at B.

 [1]

(iii)
The cross-section shown on Fig. 1.3 is incomplete. Using information from the map extract, draw a line on Fig. 1.3 to complete the cross-section.
[1]
10e4 marks
(e)
Find the settlement of Dienne in the south west of the map extract. Using the map extract, describe the site and give reasons for the growth of the settlement.
[4]

Did this page help you?

11a4 marks

Study the map extract for Carnac, France. The scale is 1:25000.

(a)
Fig. 1.1 shows some of the features near Cité du Runell in the north of the map extract. Study Fig. 1.1 and the map extract, and answer the questions below.

fig-1-1-qp-paper22-cie-igcse-geography

Fig. 1.1

Using the map extract, identify the following features shown in Fig. 1.1:

(i)
the type of road at A
[1]
(ii)
the leisure activity at B
[1]
(iii)
the land use at C
[1]
(iv)
the land use at D.
[1]
11b3 marks
(b)

The central point of the main settlement at Carnac is at 940700. Identify three services  provided for tourists within 1km of the centre of Carnac.

1 ........................................

2 ........................................

3 ........................................ 

[3]

11c4 marks
(c)
Fig. 1.2 shows an area in the south west of the map at St-Colomban. Fig. 1.3 shows an area  in the north east of the map near Kermario. Study the two areas and answer the questions  below.

VxNoygRI_fig-1-2-and-1-3-qp-paper22-cie-igcse-geography                   

The table below compares the features of the two areas. Complete the table by putting ticks (✓) in the correct four boxes. Use only one tick for each row.

feature area in Fig. 1.2
at St-Colomban
area in Fig. 1.3
near Kermario
both these
areas
neither of
these areas
a dam        
land over 25m above
sea level
       
a bathing place        
a railway        

[4]

11d4 marks
(d)
Look at the part of the straight D781 road that runs between the settlements at Plouharnel and Carnac.

(i)
What is the distance along the straight part of the road? Tick (✓) one box below.
 
  tick (✓)
287 metres  
387 metres  
2875 metres  
3875 metres  

[1]
(ii)
What is the compass direction along the road from Plouharnel to Carnac?
[1]
(iii)

Measure the bearing along the road from Plouharnel to Carnac.

.................................. degrees

[1]
(iv)
Find the roundabout (circle) part way along the road at Kergouillard. Give the six-figure grid reference of this roundabout (circle).
[1]
11e5 marks
(e)
Describe the natural features of the coast shown on the map.
[5]

Did this page help you?

12a4 marks

Study the map extract for Thiezac, France. The scale is 1:25000.

(a)
Fig. 1.1 shows some of the features around the settlement of le Croizet in the south of the map extract. Study Fig. 1.1 and the map extract, and answer the questions below.

fig-1-1-qp-paper23-cie-igcse-geography

Fig. 1.1

Using the map extract, identify the following features shown in Fig. 1.1:

(i)
feature A
[1]
(ii)
feature B
[1]
(iii)
feature C
[1]
(iv)
feature D
[1]
(v)
land use at E
[1]
(vi)

the height above sea level of the spot height at F.

.................................... metres

[1]

12b3 marks
(b)
Fig. 1.2 is a cross-section along northing 85 from 720850 to 750850.

fig-1-2-qp-paper23-cie-igcse-geography

Fig. 1.2

(i)
On Fig. 1.2, use a labelled arrow to show the position of the N122 road.
[1]
(ii)
The cross-section shown on Fig. 1.2 is incomplete. Using information from the map extract, draw a line on Fig. 1.2 to complete the cross-section.
[2]
12c5 marks
(c)
Fig. 1.3 shows an area in the west of the map extract.

A person walks on the footpath (shown by a red line) from Lagat (730856), north west of Thiezac, to Cascade de Faillitoux (722866), east of the river north-north east of Lasmolineries.

fig-1-3-qp-paper23-cie-igcse-geography
Fig. 1.3

(i)
In which overall direction does the person travel? Tick (✓) one box below.

  tick (✓)
south east  
south west  
north west  
north east  

[1]
(ii)

What is the distance travelled along the footpath from Lagat to Cascade de Faillitoux?

Tick (✓) one box below.

  tick (✓)
1010 metres  
1600 metres  
2010 metres  
2300 metres  
[1]
(iii)
The table below shows the features in the area. Which two features will the person pass on the footpath? Complete the table by putting ticks (✓) in the correct two boxes.

  tick (✓)
steep slopes  
lake  
reservoir  
deciduous woodland  
coniferous woodland  
[2]
(iv)

Measure the bearing from the spot height of 1096 metres at Lagat (730856) to Cascade de Faillitoux (722866).

.......................................................... degrees

[1]
12d6 marks
(d)
Fig. 1.4 shows the location of two grid squares in the west of the map extract. These are square 7085 at la Rochere and 7185 at Lasmolineries. Study the area and answer the questions on the next page.

fig-1-4-qp-paper23-cie-igcse-geography

Fig. 1.4

Describe the relief and drainage of this area.

Relief 

...................................

Drainage 

...................................

[6]

Did this page help you?

13a3 marks

Fig. 2.1 gives information about population change in four regions in Italy (an MEDC) in 2017.
Study Fig. 2.1 and answer the following questions.

fig-2-1-qp-paper23-cie-igcse-geography

Fig. 2.1

(a)
Which of the four regions had:

(i)
the highest birth rate
[1]
(ii)
the highest death rate
[1]
(iii)
the largest population decline?
[1]
13b1 mark
(b)
Compare the population growth in the northern and southern regions.

[1]

13c2 marks
(c)

Study the following calculation for population growth:

Population growth rate = birth rate +/– death rate +/– migration

Calculate the migration rate for the following regions:

(i)

Trentino Alto Adige

...................................... per thousand

[1]

(ii)

Calabria.

...................................... per thousand

[1]

13d2 marks
(d)

Suggest two pull factors attracting people to the northern regions of Italy (an MEDC).

1 .............................................

2 .............................................

[2]

Did this page help you?