16 marks
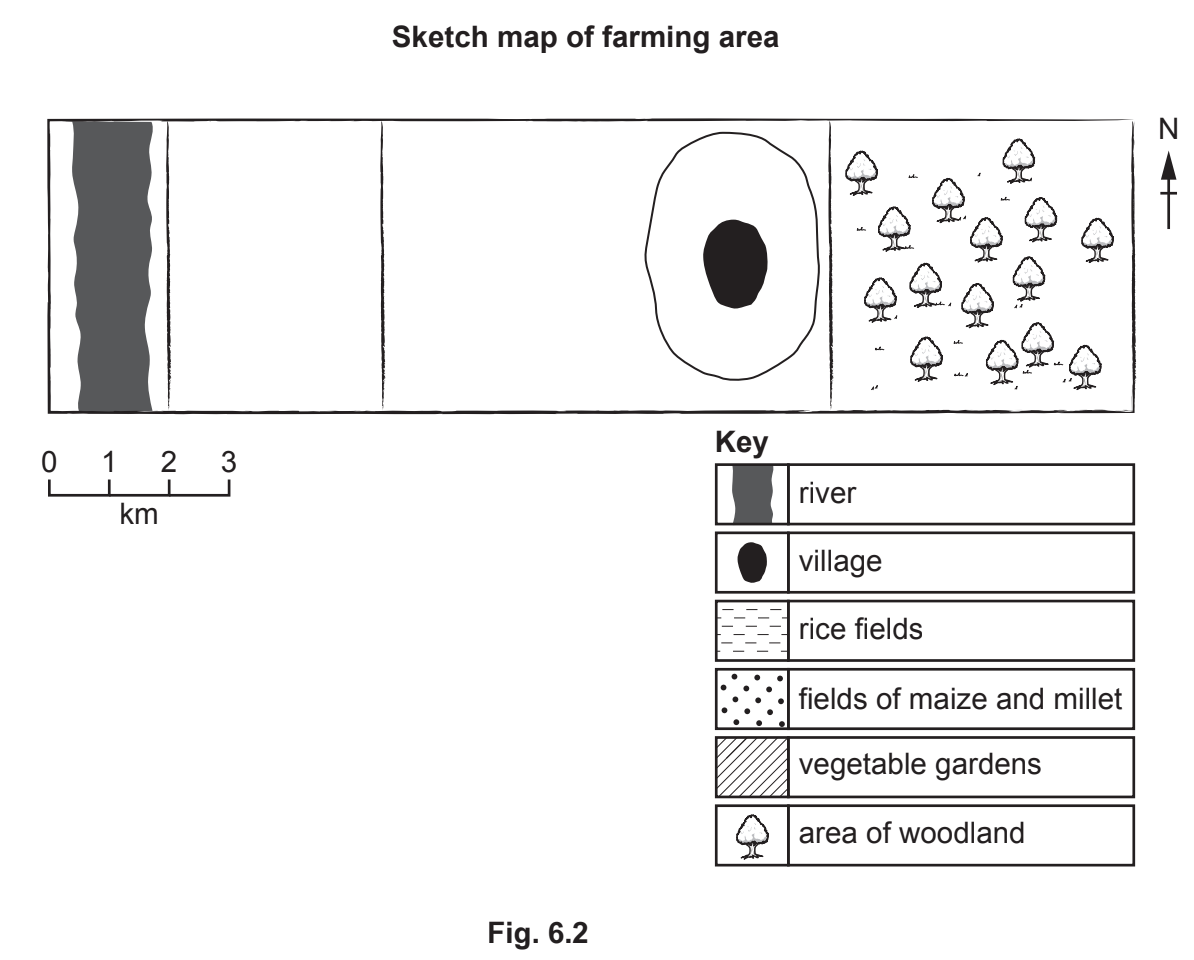
Study Figs. 6.1 and 6.2, which show information about a subsistence farming area in The Gambia (an LEDC in Africa).
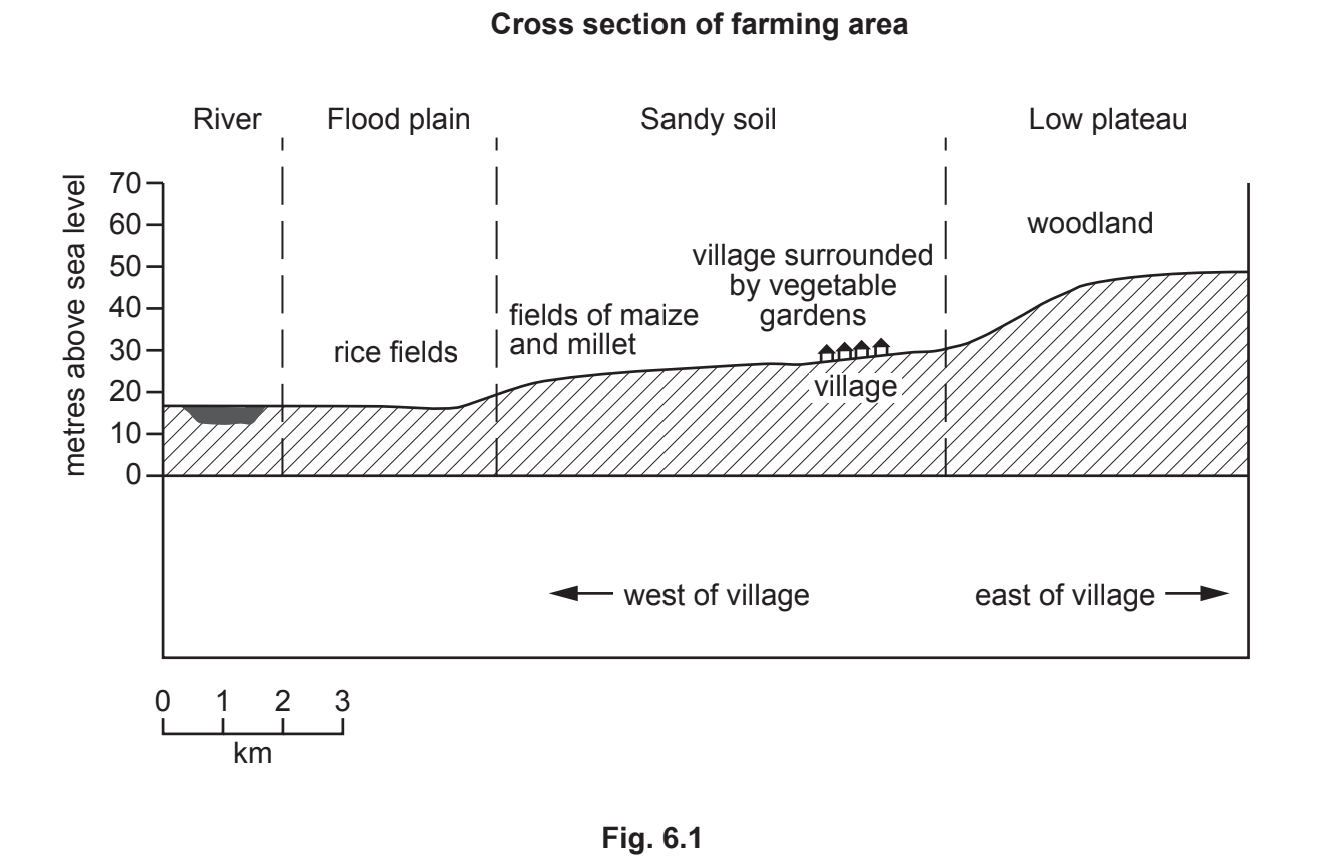
(i)
What is meant by subsistence farming?
[1]
(ii)
Use the key to complete the sketch map, Fig. 6.2, which shows land use in the farming area by shading:
- the rice fields
- the vegetable gardens
- the fields of maize and millet.
- the rice fields
- the vegetable gardens
- the fields of maize and millet.
[2]
(iii)
Suggest three reasons why the vegetable gardens are closer to the village than the rice fields.
[3]
Did this page help you?