110 marks
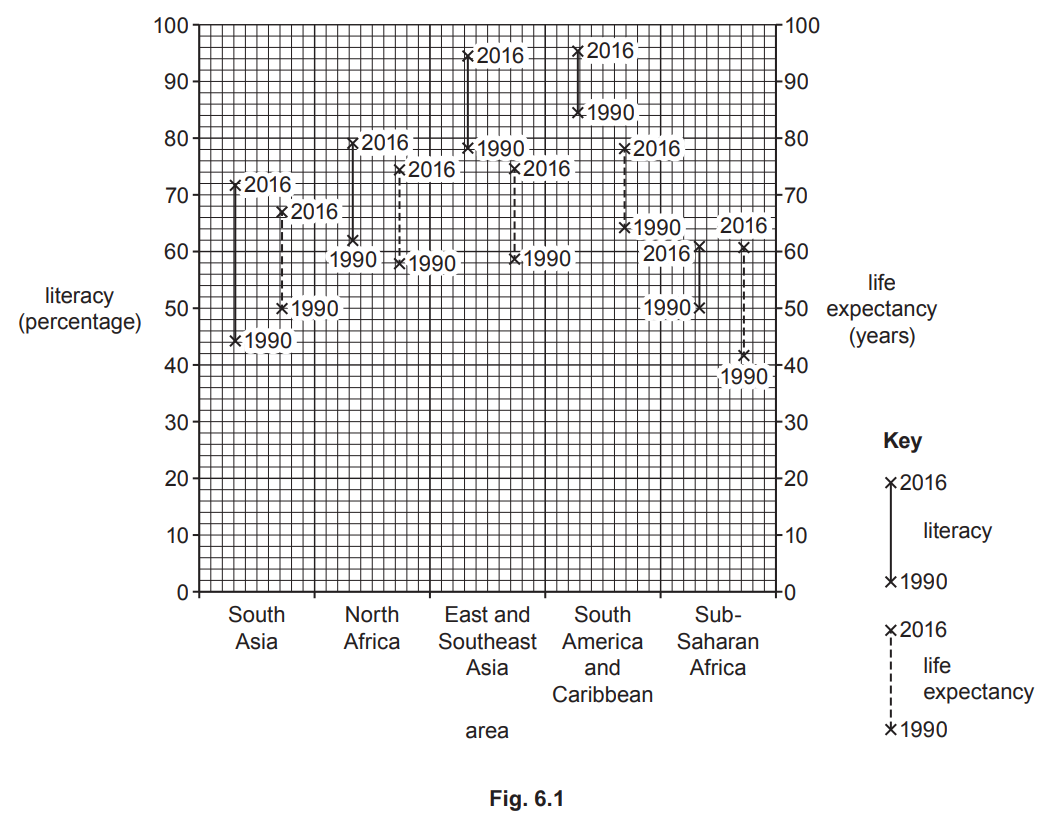
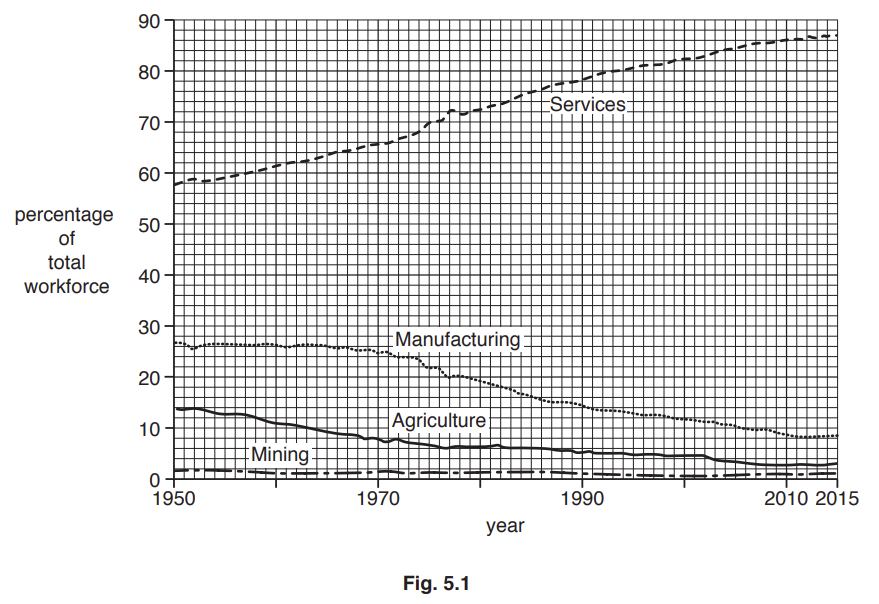
Study Fig. 6.1, which shows the employment structure of Germany (an MEDC) and Egypt (an LEDC) in 1960, 1985 and 2010.

(i)
What percentage of the working population was employed in the primary sector in Egypt in 1960?
[1]
(ii)
Identify one similarity and one difference between the employment structures of Germany and Egypt in 2010.
Similarity .......................
Difference .........................
[2]
(iii)
Suggest reasons for the decline of employment in secondary industry in Germany since 1985.
[3]
(iv)
Suggest reasons for the growth of tertiary employment in Egypt between 1960 and 2010.
[4]
Did this page help you?


format('truetype')%3Bfont-weight%3Anormal%3Bfont-style%3Anormal%3B%7D%3C%2Fstyle%3E%3C%2Fdefs%3E%3Ctext%20font-family%3D%22stixf5dffc111454b227fbcdf36178d%22%20font-size%3D%2218%22%20text-anchor%3D%22middle%22%20x%3D%229.5%22%20y%3D%2218%22%3E%26%23x2713%3B%3C%2Ftext%3E%3C%2Fsvg%3E)


 Fig. 5.2
 Fig. 5.3