Weather (CIE IGCSE Geography)

Topic Questions

16 marks

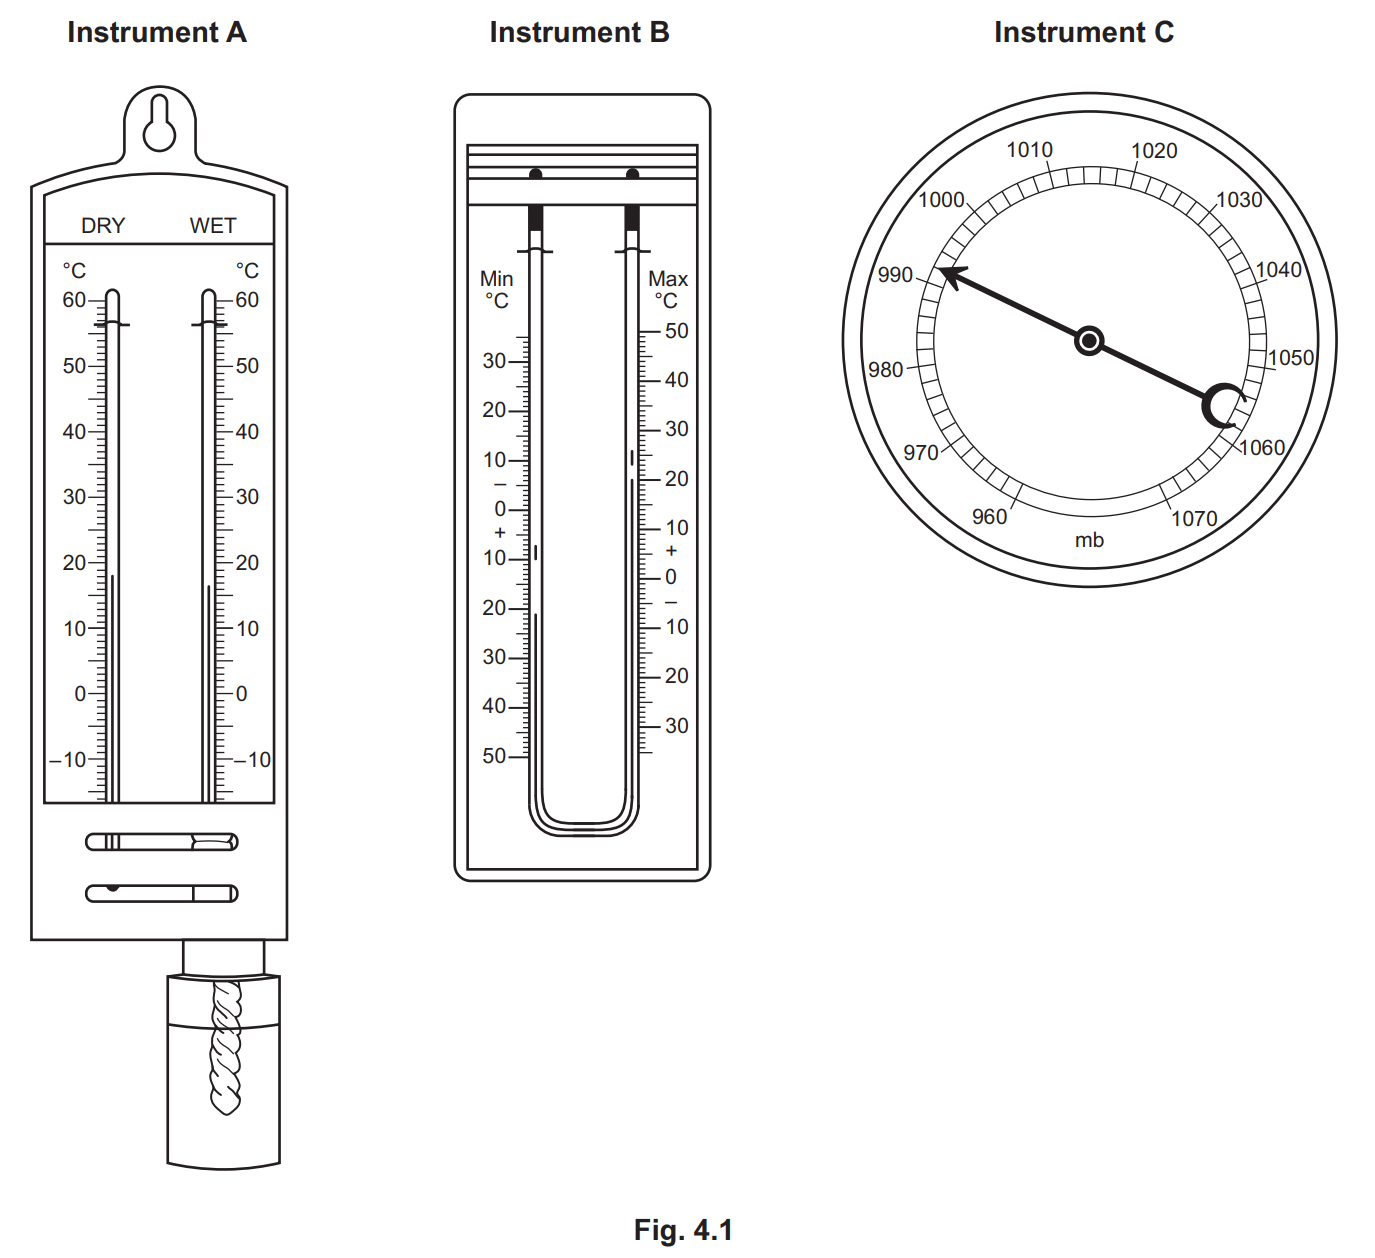
Study Fig. 4.1, which shows three traditional weather instruments.

q4a-nov-2020-cie-igcse-geography
(i)
Which diagram, A, B or C, shows a barometer?

[1]

(ii)
Using Fig. 4.1, state:
– the atmospheric pressure
– the maximum temperature

[2]

(iii)
Explain how the instrument labelled A in Fig. 4.1 is used to work out relative humidity.

[3]

Did this page help you?

26 marks

Study Fig. 4.1, which shows information collected in June 2012 and June 2013 at a weather station in Maleny, Australia.

  2012 2013
Rainfall (mm) 267.2 164.6
Days with rainfall 16 14
Evaporation (mm) 40.4 58.1
Humidity (%) 77 78
Minimum temperature (°C) 5.8 5.0
Maximum temperature (°C) 21.2 21.8
Wind direction SSW SSW
Sunshine hours (per month) 85 80

Fig. 4.1

(i)
Using evidence from Fig. 4.1, underline the weather element in the list below which showed the greatest difference between June 2012 and June 2013.

rainfall sunshine hours  temperature wind direction


[1]

(ii)
Which weather instrument is used to measure:

Humidity  
Wind direction  
[2]
(iii)
Describe how information about the amount of rainfall is collected at a weather station.
[3]

Did this page help you?

3
Sme Calculator
4 marks

Some weather instruments are kept in a Stevenson screen.

Explain how the features of the Stevenson screen ensure that the information collected by these instruments is accurate.

[4]

Did this page help you?

44 marks

Draw and label the traditional weather instrument which is used to measure wind direction.

[4]

Did this page help you?

510 marks

Study Fig. 4.1, which is a photograph of a weather instrument.

fig-4-1-q4-0460-s20-in-12
Fig 4.1
(i)
Identify the weather instrument shown in Fig. 4.1.
[1]
(ii)
Explain how readings are taken from the weather instrument shown in Fig. 4.1.
[2]
(iii)
Describe and explain the ideal location of the weather instrument shown in Fig. 4.1.
[3]
(iv)
Explain why many weather stations now use digital instruments rather than traditional ones.
[4]

Did this page help you?

610 marks

Study Fig. 3.1, which is a photograph of a Stevenson screen.

fig-3-1-q3-11-0460-12-2019-164092
Fig 3.1
(i)
Which of the following weather instruments is kept in a Stevenson screen?
Circle one of the answers below.
anemometer barometer rain gauge wind vane
                                        

[1]

(ii)
Some instruments kept in a Stevenson screen are digital. Give two advantages of using digital weather instruments rather than traditional ones.
[2]
(iii)
Describe three features of a Stevenson screen which ensure that the information collected is reliable.
[3]
(iv)
State two factors which should be considered when deciding on the site of a Stevenson screen.
For each factor explain why it is important.
[4]

Did this page help you?

18 marks

Study Fig. 3.2, which is a photograph of an instrument used in a weather station.

fig-3-2-q3-11-0460-12-2019-164092
Fig 3.2 
(i)
Name the instrument shown in Fig. 3.2 and explain how it is used to collect weather data.

Name of instrument ...........................

How it is used ................................
[3]
(ii)
Explain how a student could observe and record cloud types and amounts at his school over a period of one week.
[5]

Did this page help you?

28 marks

Study Fig. 4.2, which shows the relative humidity at Carnarvon Airport, Western Australia, during August 2017.

q4b-0460-s20-qp-12
(i)
Compare the pattern of relative humidity at 09:00 and at 15:00 during August 2017 at Carnarvon Airport. Use statistics in your answer.
[3]
(ii)
Explain how a traditional weather instrument can be used to obtain data on relative humidity such as that shown in Fig. 4.2.
[5]

Did this page help you?

38 marks

Study Fig. 4.2, which shows a Stevenson Screen.

q4b-nov-2020-cie-igcse-geography

(i)
Explain how the following features of a Stevenson Screen make sure that the instruments inside give accurate readings:
– it is painted white
– it is on legs
– it is made from wood

[3]

(ii)
Describe and explain the ideal location of a Stevenson Screen.
[5]

Did this page help you?

410 marks

Study Fig. 3.1, which shows information about the weather recorded in Manilla, Australia, in October 2018.

fig-3-1-qp-paper11-cie-igcse-geography

Fig. 3.1

(i)
What was the cloud cover at Manilla on 12 October?

.............................. oktas

[1]

(ii)
Identify from Fig. 3.1:
the date which had most rainfall ................................
the date with the smallest range of temperature. ..................................
[2]
(iii)
Using Fig. 3.1 only, compare the weather at Manilla on 19 and 25 October.
Do not use statistics in your answer.

[3]

(iv)

State two other characteristics of weather that can be measured at a weather station.
For each characteristic, name the instrument used to measure it.

Weather characteristic 1 ...................................
Instrument ........................................................
Weather characteristic 2 ..................................
Instrument ........................................................

[4]

Did this page help you?

58 marks

Study Fig. 3.2, which shows part of the instructions for siting a digital weather recording instrument.

fig-3-2-qp-paper11-cie-igcse-geography

Fig. 3.2

(i)
Using the diagrams in Fig. 3.2 only, give three pieces of advice about the location of the weather recording instrument.

1 ..............................................

2 ..............................................

3 ..............................................

[3]

(ii)
Explain the advantages of using digital weather recording instruments rather than traditional instruments.

[5]

Did this page help you?