Weather (CIE IGCSE Geography)

Topic Questions

1
Sme Calculator
4 marks

Study Fig. 1, which shows information about the weather recorded in Manilla, Australia, in October 2018.
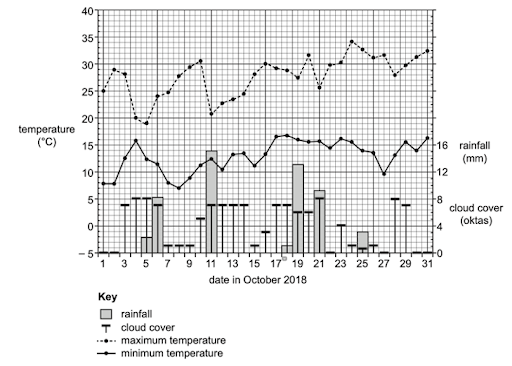
q1-2-4-paper-2-easy-cie-igcse-geography-tqs-

Fig 1

(i)

What was the rainfall in Manilla on:

11 October …………………………. mm

18 October …………………………. mm 

[2]

(ii)

Identify from Fig. 1: 

the date with the highest maximum temperature …………………………..

the date with the lowest minimum temperature ……………………………. 

[2]

Did this page help you?

2
Sme Calculator
4 marks

Study Fig 1, which shows information collected in June 2012 and June 2013 at a weather station in Maleny, Australia.

  2012 2013
Rainfall (mm) 267.2 164.6
Days with rainfall 16 14
Evaporation (mm) 40.4 58.1
Humidity (%) 77 78
Minimum Temperature (°C) 5.8 5.0
Maximum Temperature (°C) 21.2 21.8
Wind direction SSW SSW
Sunshine hours (per month) 85 80

Fig 1 - Weather data

(i)
Calculate the diurnal temperature range in 2012 and 2013.  

[2]

(ii)

Which weather instrument is used to measure:

- rainfall ……………………………

- temperature? ……………………

[2]

Did this page help you?

3
Sme Calculator
2 marks

Study Fig. 1, which shows information about the weather at midday on 29 March and 31 March 2016 at Poole Harbour in the UK.

q3-1-2-4-paper-2-easy-cie-igcse-geography-tqs

q3-2-4-paper-2-easy-cie-igcse-geography-tqs

Fig 1 - Weather Data

(i)

Identify from Fig. 3.1 the weather characteristic measured by the following instruments. 

Hygrometer …………………….

Wind vane ……………………….

[2]

Did this page help you?

44 marks

Fig. 3.1, shows a weather station in South Africa.

fig-3-1-q3-0460-s20-in-23
Fig 3.1

(i)
Name the box at A.
[1]
(ii)
What is measured by the instruments at B?
[1]
(iii)
What is measured by the instrument at C?
[1]
(iv)
Suggest the reason for the cable at D.
 [1]

Did this page help you?

54 marks

Clouds are observed and described, but not measured by instruments. Fig. 3.2 shows clouds in Kazakhstan.

fig-3-2-q3-0460-s20-in-23
Fig 3.2


Describe the clouds shown at X and Y in Fig. 3.2.

Did this page help you?

1
Sme Calculator
4 marks

q1-2-4-paper-2-easy-cie-igcse-geography-tqs-

Fig 1

(i
)
Using Fig. 1 only, compare the weather at Manilla on 11 and 21 October. Do not use statistics in your answer. 

Did this page help you?

2
Sme Calculator
4 marks

Describe how information about sunshine hours is collected at a weather station.

Did this page help you?

3
Sme Calculator
4 marks

Study Fig. 1, which shows information about the weather at midday on 29 March and 31 March 2016 at Poole Harbour in the UK.

q3-1-2-4-paper-2-easy-cie-igcse-geography-tqs

q3-2-4-paper-2-easy-cie-igcse-geography-tqs

Fig 1

(i)
Using Fig.1 only, compare the weather at Poole Harbour on 29 and 31 March. 

Did this page help you?

45 marks

Figs. 4.1 and 4.2 are photographs and Fig. 4.3, a diagram, showing types of cloud.

fig-4-1-q4-11-0460-23-2019-163886

Fig 4.1

fig-4-2-q4-11-0460-23-2019-163886

Fig 4.2

q4-4-0460-w19-qp-23

Use Figs. 4.1, 4.2 and 4.3 to complete the tables that follow.


Cloud in Fig. 4.1

shape of the cloud

.............................................................

.............................................................

colour of cloud

.............................................................

.............................................................

name of cloud type .............................................................
shape of the cloud

.............................................................

.............................................................

.............................................................

.............................................................

main colour of cloud .............................................................
name of cloud type .............................................................

Did this page help you?

58 marks

Students in Northern Ireland were studying the topic of weather and how to measure and collect weather data. Their school had a variety of instruments to measure elements of weather, including traditional instruments and digital equipment linked to the school’s computer network.

(i)
Fig. 1.1 is a diagram of a traditional weather station. What are the pieces of equipment labelled A and B?

fig-1-1-q1-0460-s20-insert-41

A .......................................................
B .......................................................
[2]
(ii)
Describe three features of equipment A and explain why each feature is important.
[6]

Did this page help you?