11 mark

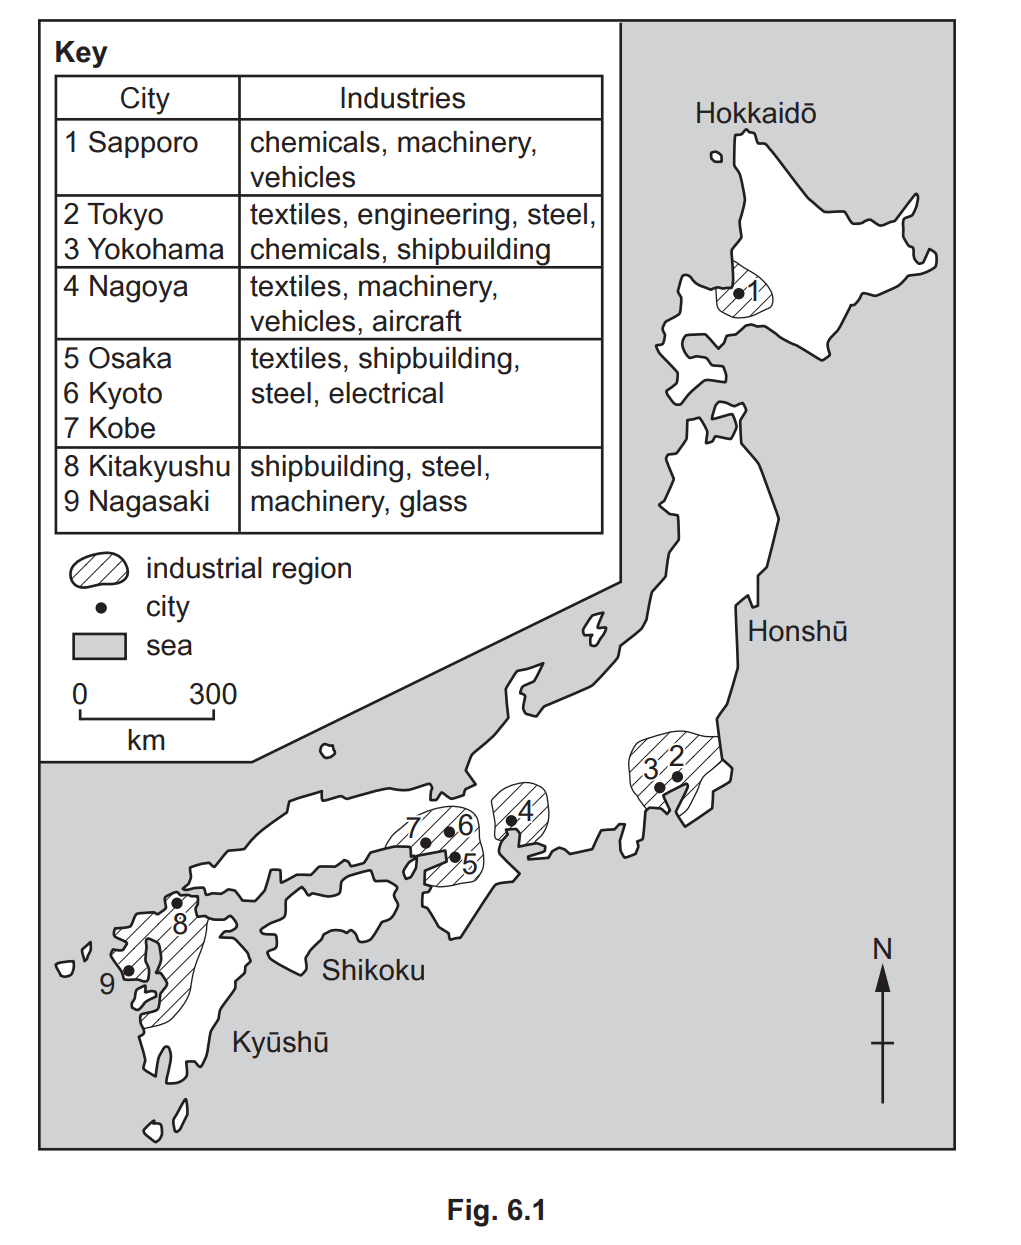
What type of industries are shown in Fig. 6.1? Circle one answer below.
| primary | secondary | tertiary | quaternary |
[1]
Did this page help you?
| primary | secondary | tertiary | quaternary |
[1]
Did this page help you?

Use Fig. 5.1 to explain why a country with no bauxite deposits usually imports alumina rather than bauxite to manufacture aluminium.
Did this page help you?
Figs. 2.1 and 2.2 show the tonnage (total weight) of ships built by the top five shipbuilding countries in 1968 and 2013.


[1]
[2]
Did this page help you?
Fig. 5.2 shows information about countries producing aluminium and mining bauxite for 2014.

(i) Name the country with the same ranks for bauxite mining and aluminium production.
[1]
(ii) State the quantity of bauxite mined in Guinea in 2014.
[1]
(iii) Suggest one reason why Guinea, an LEDC, does not manufacture aluminium.
[1]
Did this page help you?
Identify one physical input and one human input of the agricultural system which can be seen in Fig. 5.2.

[2]
Did this page help you?
Fig. 5.1 shows the two stages in the production of aluminium from bauxite.

(ii) Name one output of refining bauxite, apart from alumina.
[1]
(iii) What is mixed with bauxite in the refinery?
[1]
(iv) Which substance on Fig. 5.1 is both an output of the refinery and an input of the smelter?
[1]
Did this page help you?
Fig. 6.2 shows Japan’s relief, imports and exports.

Using evidence from Figs. 6.1 and 6.2 only, explain the factors which have influenced the location of industrial regions in Japan.
Did this page help you?