Migration (CIE IGCSE Geography)

Topic Questions

14 marks

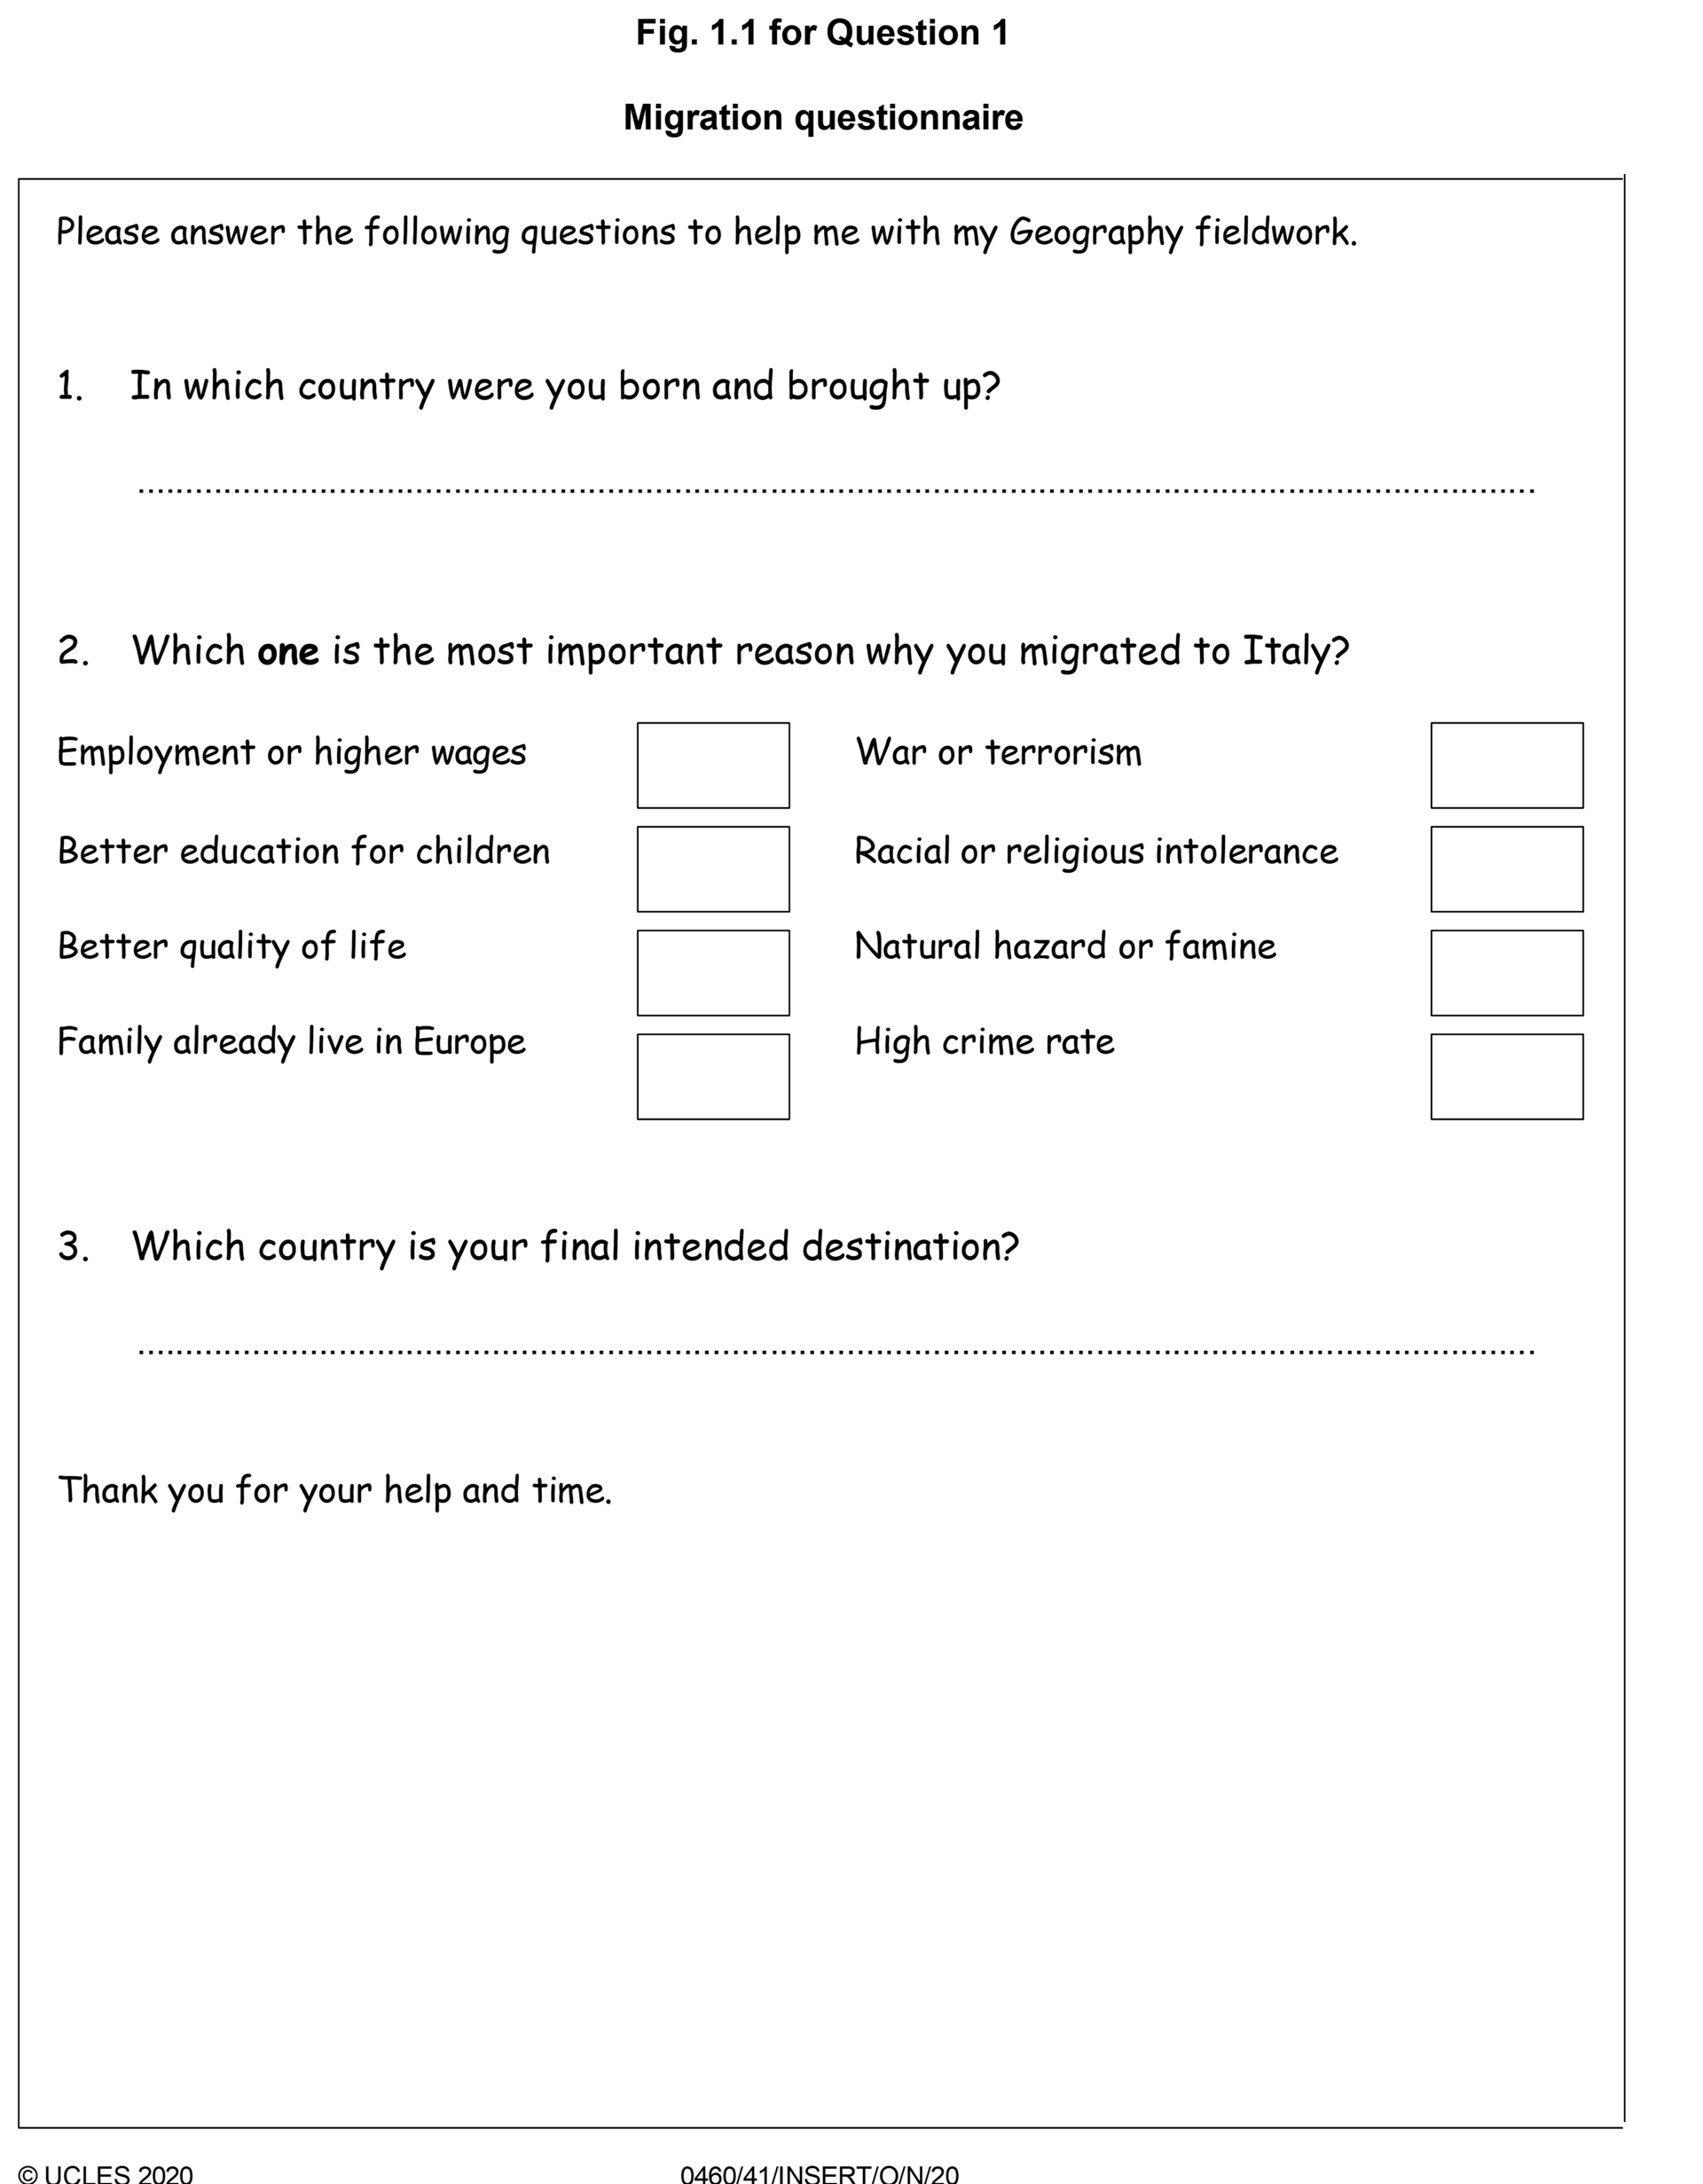
Students in Italy were studying population migration. They decided to do a fieldwork investigation about migration into their country.

Before they began their fieldwork they revised key terms to do with migration.

(i)
Match the types of migrant with the correct description. One has been completed for you.

q1ai-0460_w20_qp_41
[2]
(ii)
Explain the difference between push and pull migration factors.
[2]

Did this page help you?

25 marks

The students visited a local town on the coast near Rome to use a questionnaire with 40 migrants who had recently arrived in Italy. The questionnaire is shown in Fig. 1.1 below.

C0nrvavi_nov-2020-4-1-1
(i)
They used a random sampling method to select people to complete the questionnaire. Describe this method of sampling.
[2]
(ii)
Suggest three difficulties of using the questionnaire with migrants.
[3]

Did this page help you?

36 marks

The students wanted to test the following hypotheses:

Hypothesis 1: Most migrants come from Africa.

Hypothesis 2: Pull factors affect the decision to migrate more than push factors.

The answers to Question 1 in the questionnaire (In which country were you born and brought up?) are shown in Table 1.1 below.
HS1lJGn5_nov-2020-4-1-1c

(i)
Use the results to draw the bar for Eritrea in Fig. 1.2 below.

q1c-0460_w20_qp_41
[1]
(ii)
What conclusion would the students make about Hypothesis 1: Most migrants come from Africa? Support your answer with evidence from Fig. 1.2 and Table 1.1.
[2]
(iii)
The students compared their results to Question 1 with secondary data collected five years earlier. What is meant by secondary data?
[1]
(iv)
The earlier results are shown in Table 1.2 below. Identify two differences between the results in the different years.
nov-2020-4-1-1civ
[2]

Did this page help you?

46 marks
(i)
Table 1.3 (below) shows the results of Question 2 in the questionnaire (Which one is the most important reason why you migrated to Italy?).
nov-2020-4-1-1di
Use the results from Table 1.3 to draw and label the divided bar graph for the push factors in Fig. 1.3 below.

q1d-0460_w20_qp_41
[3]
(ii)
Do you agree with Hypothesis 2: Pull factors affect the decision to migrate more than push factors? Use evidence from Fig. 1.3 and Table 1.3 to support your decision.
[3]

Did this page help you?

55 marks
(i)
The results of Question 3 in the questionnaire (Which country is your final intended destination?) are shown in Table 1.4 below.
nov-2020-4-1-1ei
Use the results to plot the data for Germany and France in Fig. 1.4 below.
q1e-0460_w20_qp_41
[2]
(ii)
The answers to Question 3 suggest that migration is done in stages. Put the following countries in the correct order in the boxes below to show the stages of a typical migration.
  • Italy
  • Somalia (shown in Fig. 1.2)
  • United Kingdom

q1e-ii-0460_w20_qp_41

[1]

(iii)
Suggest why migration takes place in stages.
[2]

Did this page help you?

14 marks

Give two advantages and two disadvantages of immigration for an MEDC such as Italy.

Advantages

1 ...................................

2 ...................................

Disadvantages

1 ...................................

2 ...................................

Did this page help you?