Weather (CIE IGCSE Geography)

Topic Questions

11 mark

Study Fig 1, which shows weather recording equipment

q1-2-4-paper-4-easy-cie-igcse-geography-tqs

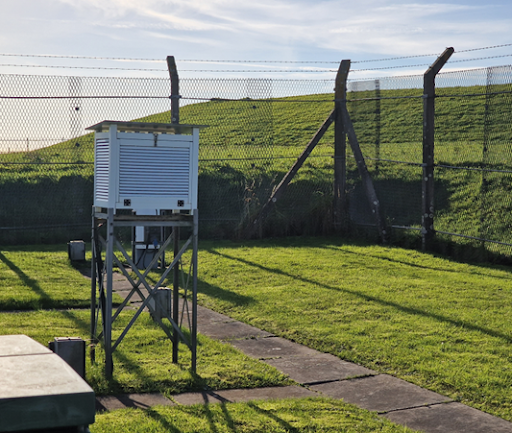
Fig 1 - Weather recording equipment

Name this equipment that is used to record weather 

Did this page help you?

24 marks

A feature of weather which may vary over a small area is relative humidity.

(i)
Which one of the following is the correct definition of relative humidity?
Tick your answer.

Definition Tick(✓)
the amount of moisture in the air during the day compared to the night  
the amount of moisture in the air as a percentage of the total moisture
it could hold at that temperature
 
the maximum amount of moisture in the air when it is warmed up  
the percentage of moisture in the air when it is raining compared to
when it stops raining
 

[1]

(ii)
Relative humidity is calculated by using a wet-and-dry bulb thermometer (hygrometer). This is shown in Fig. 1.7. Explain how students would use this instrument to work out relative humidity.
fig-1-7-q1-0460_w20_in_43
[3]

Did this page help you?

35 marks

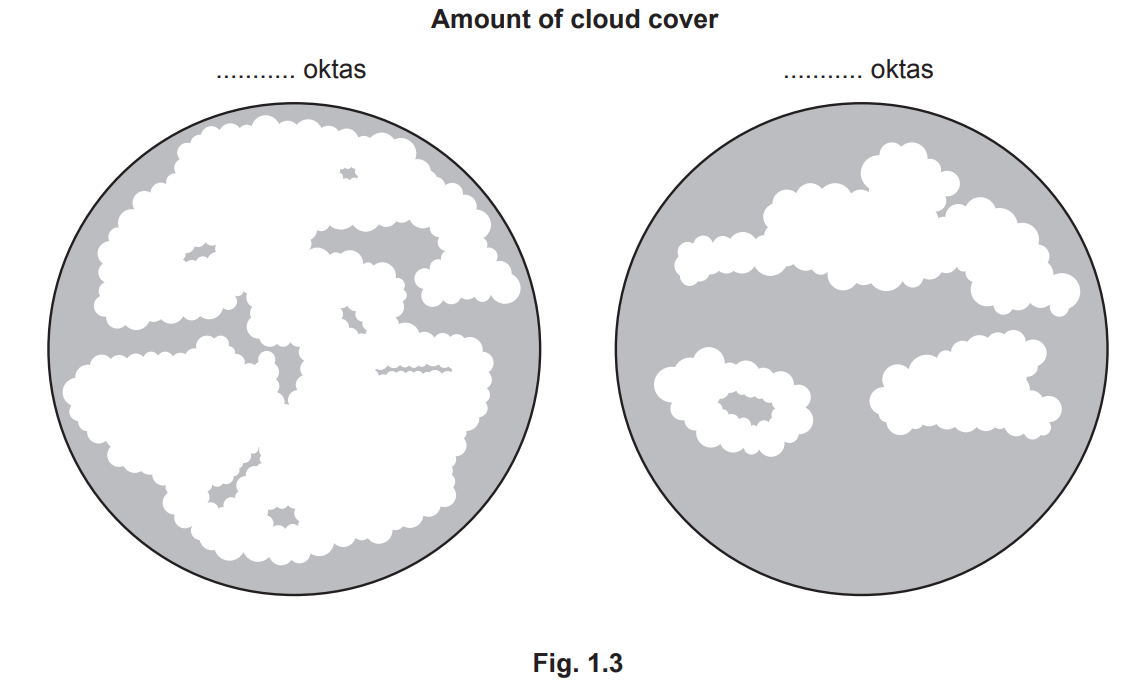
A pair of students investigated how the amount of cloud cover and cloud type had changed over three days.

(i)
Fig. 1.3 (below) shows two examples of the amount of cloud cover they recorded. The students recorded the amounts in oktas (eighths). Choose from the values below and fill in the correct number of oktas for each example.
[2]

Choose from the following:

1 okta              3 oktas             7 oktas              8 oktas

q1e0460-s20-qp-41
(ii)
Fig. 1.4 shows three different types of cloud recorded by the students.
Identify the cloud type in each photograph.
fig-1-4-q1-1-q1-0460-s20-insert-41
fig-1-4-q1-2-q1-0460-s20-insert-41
Fig 1.4
Type A .....................................................
Type B .....................................................
Type C .....................................................
[3]

Did this page help you?

43 marks

Look at Fig. 1.1.

fig-1-1-q1-0460_w20_in_43

Fig. 1.1

Suggest reasons why each of the following vary between the sites in the city centre square:

  • temperatures
  • wind direction
  • speeds

Did this page help you?

54 marks

Fig. 4.1 shows the sunshine hours per month for an area in southern England.

fig-4-1-paper-2-march-2021-cie-igcse-geography

Fig. 4.1

(i)
Using Fig. 4.1, state the total sunshine hours in April.

............................................... hours

[1]

(ii)
Complete Fig. 4.1 to show the following information:

total sunshine hours for July: 160 hours.
 [1]
(iii)
Describe the best location for a sunshine recorder.
[2]

Did this page help you?

62 marks

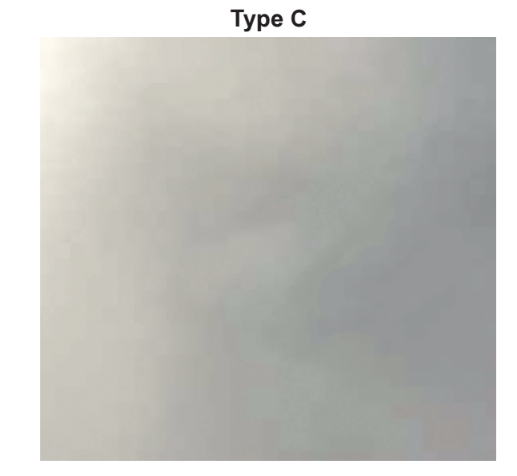
Fig. 4.2 (below) shows some clouds.

fig-4-2-rb-paper-2-march-2021-cie-igcse-geography
Fig. 4.2.


Describe the clouds shown in Fig. 4.2.

Did this page help you?

72 marks

Describe how cloud cover is measured. 

Did this page help you?

82 marks

Students at a school in Seattle, USA, measured atmospheric pressure, temperature and rainfall during 15 days in November. They tested the following hypotheses:

Hypothesis 1: Temperatures increase as atmospheric pressure rises and decrease as atmospheric pressure falls.

Hypothesis 2: There is a relationship between atmospheric pressure and daily rainfall totals.

(i)
The results of the students’ measurements of temperature are shown in Table 1.1.   

Table 1.1
table-1-1-q1-0460_w20_in_42     
Plot the maximum temperature for 13 November on the graph, Fig. 1.2 below.
q1a-ii-1-0460_w20_qp_42
q1a-ii-2-0460_w20_qp_42

[1]

(ii)
On which date in November was the largest temperature range?

 [1]


Did this page help you?

1a7 marks

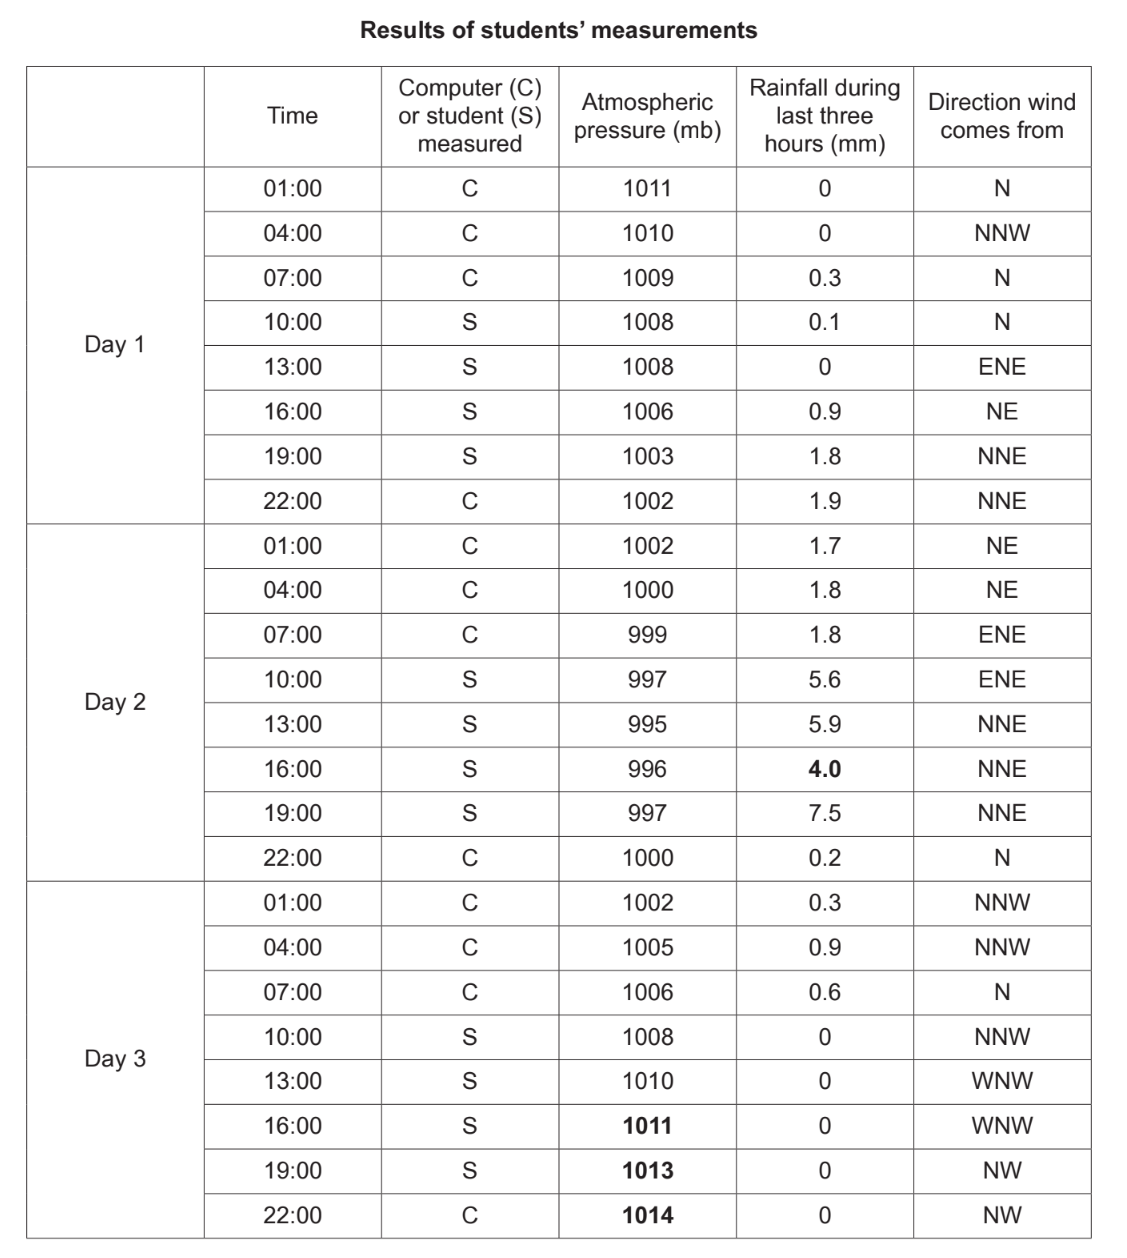
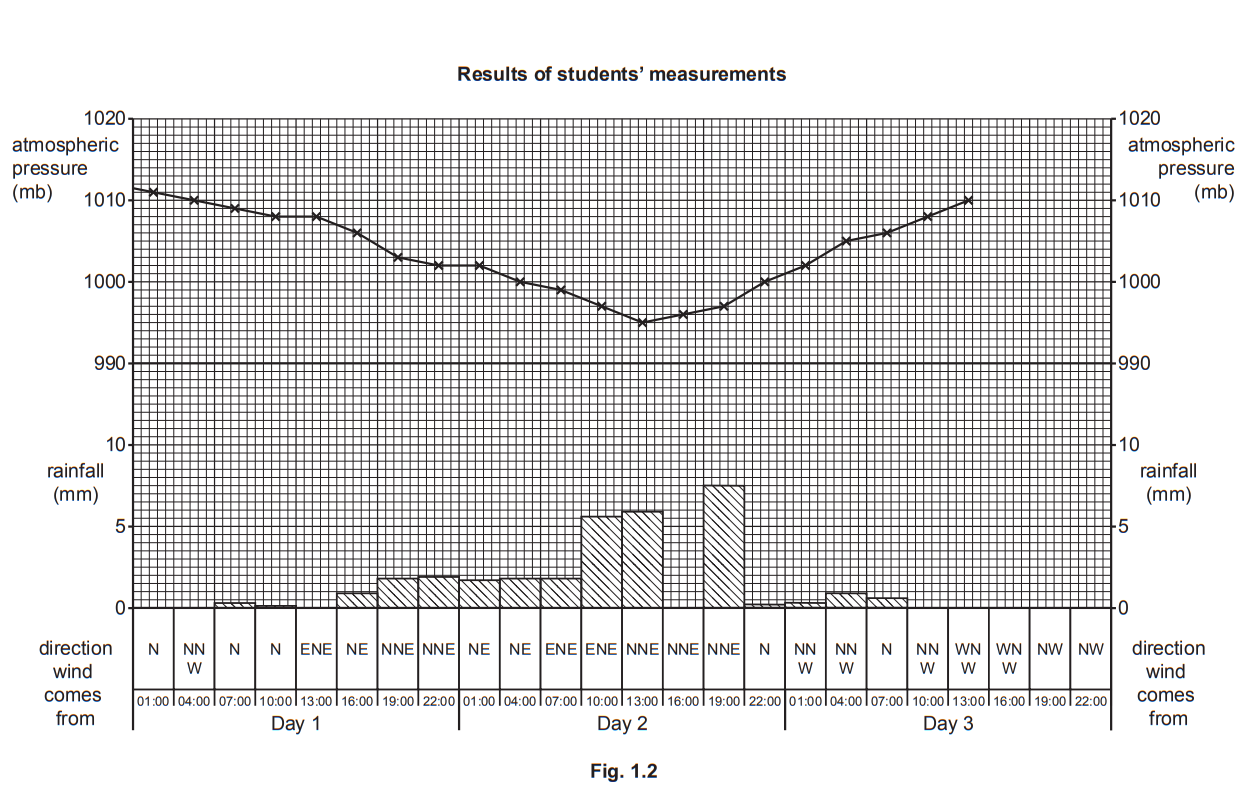
Students in Northern Ireland were studying the topic of weather and how to measure and collect weather data. The students noticed that the weather was forecast to change over the next three days, so they decided to take some measurements to investigate these changes.

One pair of students decided to test the following hypotheses:

Hypothesis 1: As atmospheric pressure changes rainfall amounts will vary.

Hypothesis 2: Atmospheric pressure affects the direction from which the wind blows.

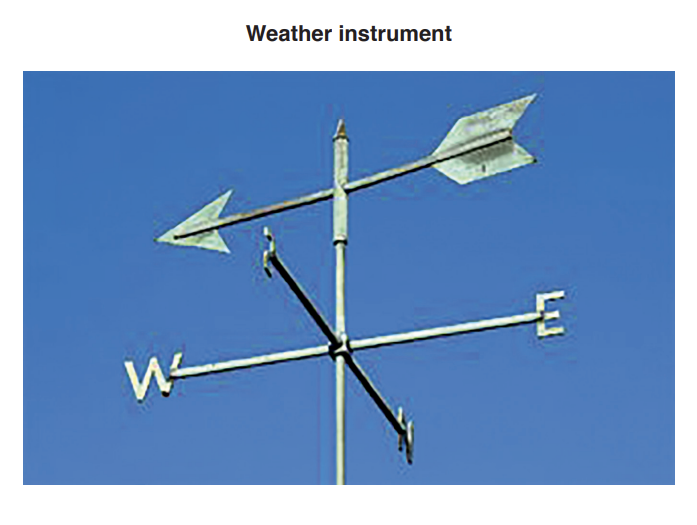
The two students measured atmospheric pressure, rainfall and which direction the wind was blowing from. They took measurements every three hours using a combination of traditional and digital instruments.

(a)(i)
Which one of the following instruments is used to measure atmospheric pressure? Tick () your answer in the box below.
[1]
  Tick ()
anemometer  
barometer  
hygrometer  
thermometer  

(ii)

A rain gauge is shown in Fig. 1.1. Explain how it is used to measure rainfall.
 [4]
fig-1-1-q1-0460-s20-insert-41
(iii)
Explain how a wind vane, which is also shown in Fig. 1.1, is used to show the direction from which the wind is blowing.
 [2]
1b3 marks
(b)
The students’ results are shown in Table 1.1. Use information from the table to complete the following tasks in Fig. 1.2 below.
Table 1.1
table-1-1-q1-q1-0460-s20-insert-41
q1c-0460-s20-qp-41-1
(i)
Complete the atmospheric pressure line graph at 16:00, 19:00 and 22:00 hours on Day 3.
[1]
(ii)
Draw the rainfall bar at 16:00 hours on Day 2.
[1]
(iii)
On which day and at what time was the following set of results recorded?

Atmospheric pressure (mb) 1002
Rainfall during the last three hours (mm) 0.3
Wind direction NNW

Day ...................................... Time ......................................
[1]
1c7 marks
(c)
Using their results, the students made conclusions about their two hypotheses.

(i)
What is your conclusion to Hypothesis 1: As atmospheric pressure changes rainfall amounts will vary? Support your conclusion with data from Fig. 1.2 and Table 1.1.
 [4]
(ii)
The students decided that Hypothesis 2: Atmospheric pressure affects the direction from which the wind blows, was partly true. Support their conclusion with evidence from Fig. 1.2 and Table 1.1.
[3]

Did this page help you?

2a13 marks

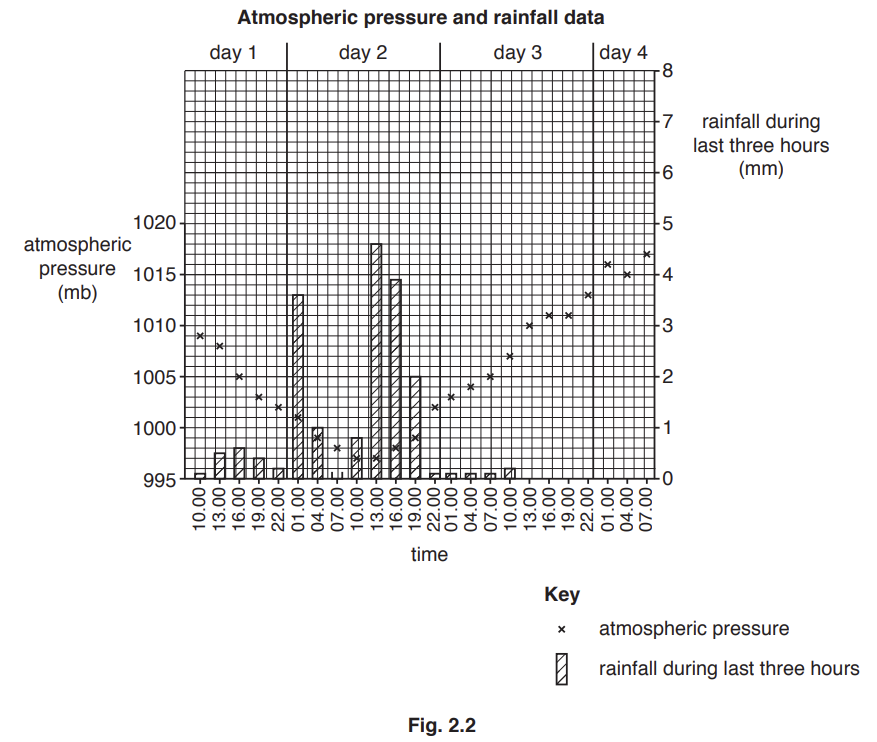
Geography students from Bantry in south west Ireland did a weather investigation. They wanted to see if there was a link between atmospheric pressure and rainfall, and a link between wind direction and temperature.

The students agreed to investigate the following hypotheses:

Hypothesis 1: Rainfall increases when atmospheric pressure rises.

Hypothesis 2: Temperature is affected by the direction from which the wind is blowing.

(a)(i)
The students used a computerised weather station to obtain data every three hours over a period of three days. Give two advantages of using electronic recording instruments.
[2]
(ii)
Their teacher instructed the students to make some measurements using traditional instruments so they would understand how to use them.
Use arrows to match the weather feature with the correct measuring instrument in the table below. One has been completed for you.
q2-2aii-qp-0460-w19-qp-41

[2]

(iii)
Draw and label a traditional rain gauge.
[3]
(iv)
Describe and explain a good position to put a rain gauge to make sure that the data collected will be accurate.
[4]
(v)
Fig. 2.1 shows a weather instrument. How does this instrument measure wind direction?
fig-2-1-q2-0460-w19-qp-41
Fig 2.1
[2]

2b6 marks
(b)
The students’ measurements of atmospheric pressure and rainfall are shown in Table 2.1 (Insert).
Table 2.1
Atmospheric pressure and rainfall data

  Time Measurement
number
Atmospheric
pressure
(mb)
Rainfall during
last three
hours (mm)
Day 1 10.00 1 1009 0.1
  13.00 2 1008 0.5
  16.00 3 1005 0.6
  19.00 4 1003 0.4
  22.00 5 1002 0.2
Day 2 01:00 6 1001 3.6
  04:00 7 999 1.0
  07:00 8 998 2.8
  10:00 9 997 0.8
  13:00 10 997 4.6
  16:00 11 998 3.9
  19:00 12 999 2.0
  22:00 13 1002 0.1
Day 3 01:00 14 1003 0.1
  04:00 15 1004 0.1
  07:00 16 1005 0.1
  10:00 17 1007 0.2
  13:00 18 1010 0
  16:00 19 1011 0
  19:00 20 1011 0
  22:00 21 1013 0
Day 4 01:00 22 1016 0
  04:00 23 1015 0
  07:00 24 1017 0
(i)
Use data from Table 2.1 to draw on Fig. 2.2 below the rainfall bar for 07.00 on day 2 (measurement number 8).

q2-2bi-qp-0460-w19-qp-41
[1]
(ii)
Complete the table below to show the highest and lowest atmospheric pressure measurements recorded by the students.

Highest atmospheric pressure
(mb)

Lowest atmospheric pressure
(mb)


[1]
(iii)
Do the measurements shown in Fig. 2.2 and Table 2.1 support Hypothesis 1: Rainfall increases when atmospheric pressure rises?
Support your decision with data.
[4]
2c6 marks
(c)

The students’ measurements of wind direction and temperature are shown in Table 2.2 (Insert).

Table 2.2 
Wind direction and temperature data

  Time Measurement
number
Direction
wind came
from
Temperature
to nearest
degree (°C)
Day 1 10:00 1 SE 11
  13:00 2 SE 13
  16:00 3 SE 11
  19:00 4 ESE 12
  22:00 5 ESE 10
Day 2 01:00 6 SSE 9
  04:00 7 S 10
  07:00  8 S 9
  10:00 9 SSE 10
  13.00 10 SSE 12
  16:00 11 NNW 10
  19:00 12 NNW 9
  22:00 13 NW 7
Day 3 01:00 14 NNW 7
  04:00 15 NNW 6
  07:00 16 N 5
  10:00 17 N 7
  13:00 18 NNW 9
  16:00 19 NNW 8
  19:00 20 NNW 7
  22:00 21 N 4
Day 4 01:00 22 N 4
  04:00 23 N 3
  07:00 24 N 3
(i)
Use data from Table 2.2 to plot on Fig. 2.3 below the temperatures when the wind came from the east south east (ESE) direction.
q2-2ci-qp-0460-w19-qp-41
[2]
(ii)
From which direction did the wind blow most frequently?
 [1]
(iii)
The students made the conclusion that Hypothesis 2: Temperature is affected by the direction from which the wind is blowing is true. Support this conclusion with data from Fig. 2.3 and Table 2.2.
[3]
2d5 marks
(d)
Give one other weather element which the students could have measured to extend their fieldwork. (Do not write about temperature, rainfall, atmospheric pressure or wind direction.)

(i)
Weather element
[1]
(ii)
Describe how the students could collect data about the weather element named in (i) above.
[4]

Did this page help you?

3a5 marks

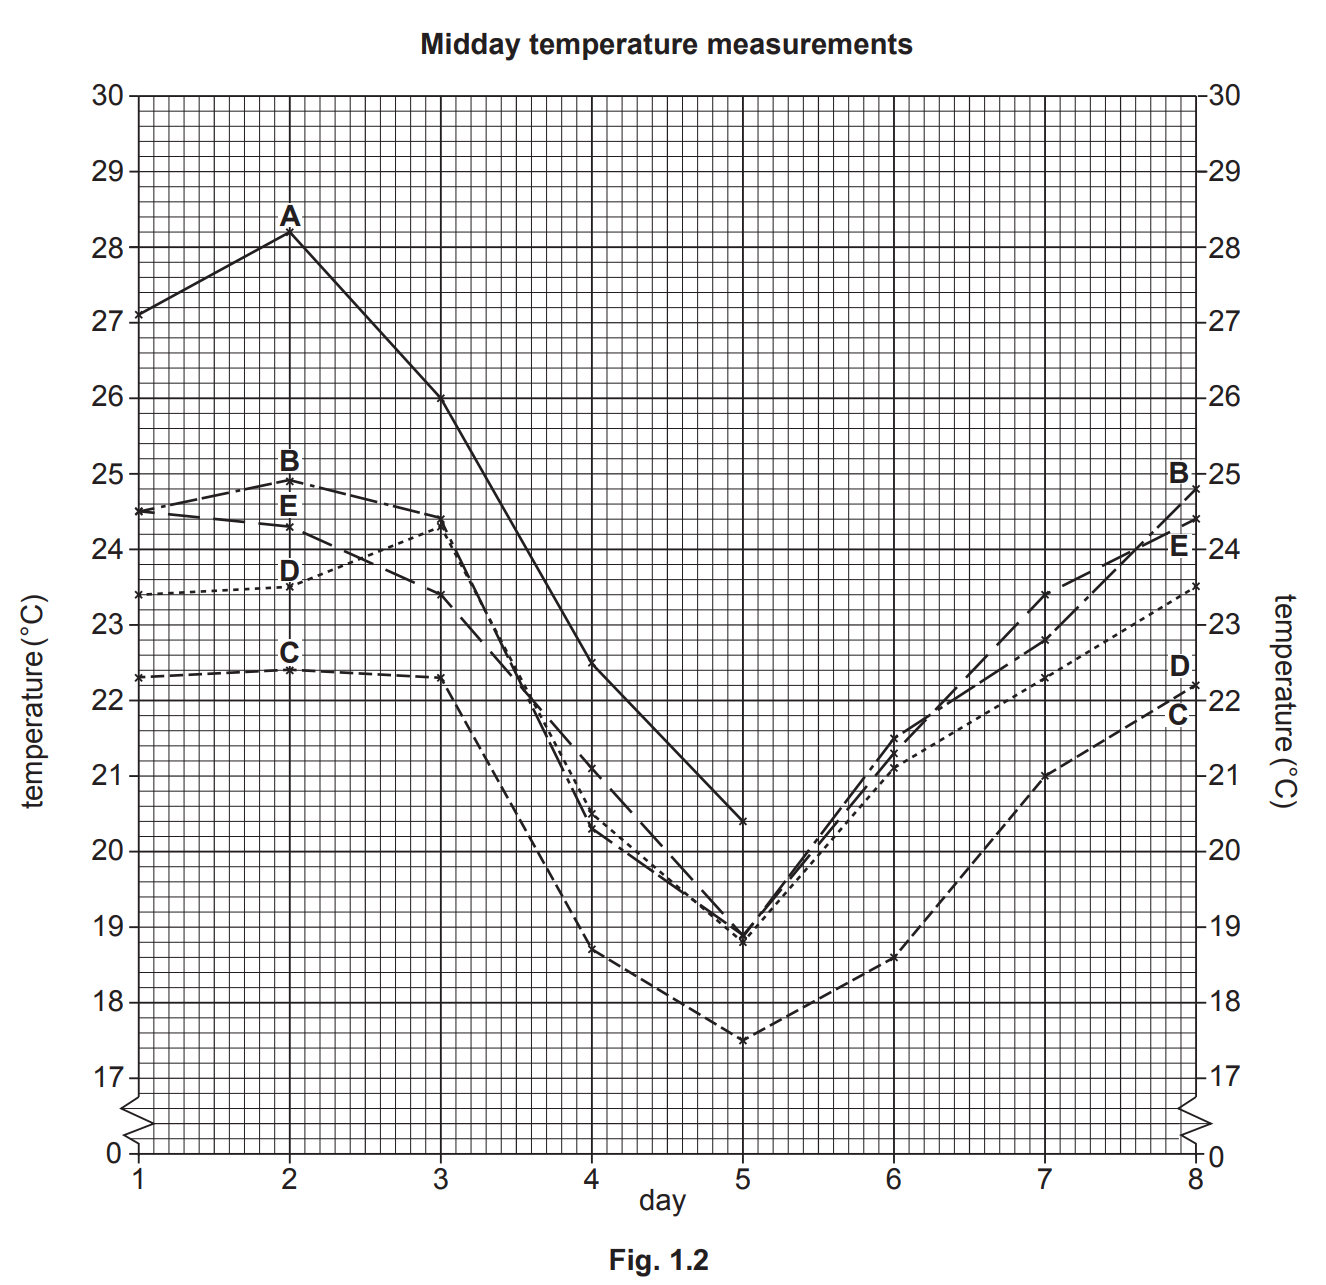
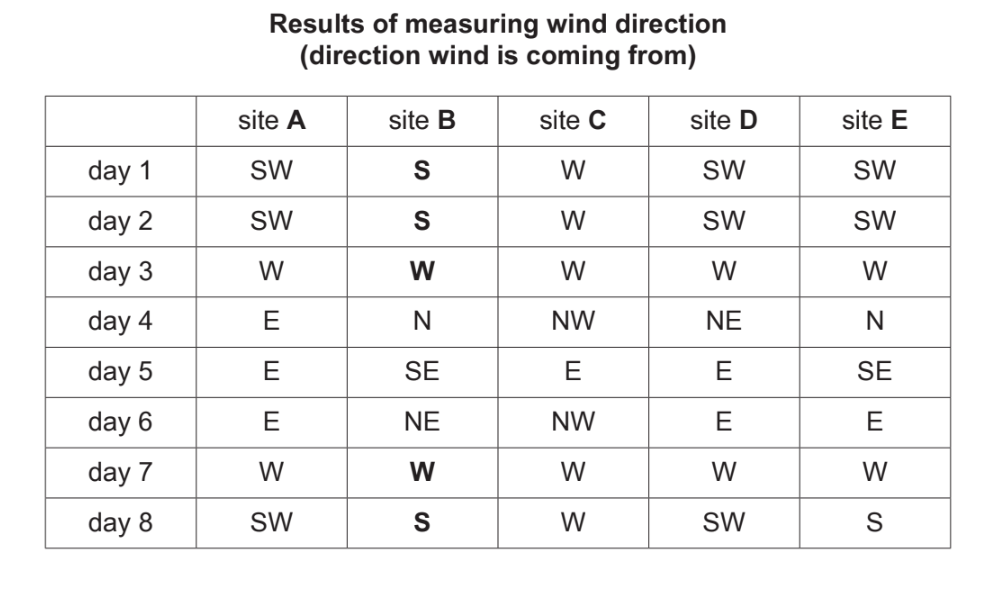
Students investigated differences in weather in a city centre square. Fig. 1.1 shows the square which is pedestrianised. They identified five sites in the square where they could measure temperature, wind direction and wind speed at midday (12:00 hours) and in the early evening on eight consecutive days.

fig-1-1-q1-0460_w20_in_43

Fig. 1.1

The students investigated the following hypotheses:

Hypothesis 1: Midday temperatures are higher at sites A, B and C than at sites D and E.

Hypothesis 2: Wind direction and wind speed vary more at site C than at site E.

(a)
To measure the temperature the students considered using a traditional maximum-minimum thermometer at each site.

(i)
Suggest why their teacher thought that it was not a good idea to use a maximum-minimum thermometer in the city centre square when they wanted to make their measurements.
[2]
(ii)
As an alternative method the students decided to use a digital thermometer to measure temperature at each site around midday (12:00 hours) and in the early evening. Give three advantages of using a digital thermometer.
[3]
3b6 marks
(b)
The results of the students’ midday temperature measurements are shown in Table 1.1.

Table 1.1
table-1-1-q1-0460_w20_in_43
(i)
Use the results in Table 1.1 to complete Fig. 1.2 on the page opposite by plotting the midday temperatures of days 6, 7 and 8 at site A.
q1b-0460_w20_qp_43
[2]
(ii)
What is your conclusion to Hypothesis 1: Midday temperatures are higher at sites A, B and C than at sites D and E? Support your decision with evidence from Fig. 1.2 and Table 1.1.
[4]
3c2 marks
(c)
Early evening temperatures in the square also varied. These temperatures are shown in Fig. 1.3. Use Fig. 1.3 to:

1-3-q1-0460_w20_in_43
(i)
Describe one difference in early evening temperatures between the sites. Do not use statistics in your answer.
[1]
(ii)
Describe one difference in early evening temperatures during the eight days. Do not use statistics in your answer.
[1]
3d10 marks
(d)
To investigate Hypothesis 2: Wind direction and wind speed vary more at site C than at site E, the students took measurements at midday on each day.

(i)
What is the instrument called which is used to measure wind direction? Tick (✓) your choice below.

  Tick (✓)
wind dial  
wind gauge  
wind vane  

[1]

(ii)
The students’ results of measuring wind direction are shown in Table 1.2. Use these results to complete the wind directions at site B in Fig. 1.4 below.

Table 1.2
table-1-2-q1-0460_w20_in_43
q1d-ii-0460_w20_qp_43
[2]
(iii)
Explain how an anemometer, like that shown in Fig. 1.5, measures wind speed.

fig-1-5-q1-0460_w20_in_43
Fig 1.5
[2]
(iv)
The students’ results of measuring wind speed are shown in Table 1.3. In Fig. 1.6 below, plot the wind speed measurements at site B on days 1 and 7.

Table 1.3
table-1-3-q1-0460_w20_in_43
q1d-iv-0460_w20_qp_43
[2]
(v)
The students decided that Hypothesis 2: Wind direction and wind speed vary more at site C than at site E, was partly true. Which part of the hypothesis is true? Tick your decision below and support your decision with data from Figs. 1.4 and 1.6 and Tables 1.2 and 1.3.

  Tick(✓)
Wind direction varies more at site C than at site E  
Wind speed varies more at site C than at site E  

[3]

Did this page help you?

4a9 marks

A student who was studying weather did fieldwork to measure and record rainfall at her school. To extend her fieldwork she decided to compare her results with data from a weather station at the local university about 50km away from the school.

The student decided to investigate the following hypotheses:

Hypothesis 1: At the school rainfall is higher on days when the wind is blowing from the west

Hypothesis 2: Rainfall is higher at the school than at the university.

(a)
To investigate the hypotheses the student used a rain gauge.

(i)
Which two of the following locations should be chosen when deciding where to put a rain gauge? Tick () your choices below.

[2]

(ii)
In the space below, draw a labelled diagram of a rain gauge.

[4]

(iii)
The student used a wind vane to record the wind direction. This was fixed to the roof of the school. Fig. 1.1 (below) is a diagram of a wind vane.
fig-1-1-paper42-cie-igcse-geographyFig. 1.1 

Complete the sentences below to explain how a wind vane is used.

The letters (N, E, S, W) show ..............................................
The pointer (arrow) shows ...................................................
The wind vane is located on the roof so that ........................

[3]

4b5 marks
(b)
The student’s measurements for each day are shown in Table 1.1 (below).

Table 1.1
Student’s fieldwork measurements 

day rainfall
(mm)
wind direction
from
1 2 NW
2 3 NW
3 5 W
4 0 SW
5 0 S
6 0 S
7 3 SW
8 8 W
9 4 W
10 0 NW
11 0 N
12 0 N
13 0 NE
14 0 NE
15 2 NE
16 2 N
17 1 N
18 3 NW
19 7 W
20 2 NW
Average 2.1  


(i)
Use the data from Table 1.1 to plot the rainfall measurements for days 3 and 16 on Fig. 1.2 below. 

[2]

Daily rainfall measurements when wind is
coming from different directions

fig-1-2-qp-paper42-cie-igcse-geography

Fig. 1.2

(ii)
Do the fieldwork results support Hypothesis 1: At the school rainfall is higher on days when the wind is blowing from the west? Support your conclusion with data from Fig. 1.2 and Table 1.1.

[3]

4c9 marks
(c)
To investigate Hypothesis 2: Rainfall is higher at the school than at the university, the student used secondary data from an automated weather recording station at the university. 

(i)
How is primary data different from secondary data?

[2]

(ii)
Give two advantages of using electronic recording instruments at an automated weather recording station.

1 .....................................................................................
2 .....................................................................................

[2]

(iii)
To compare the rainfall amounts at the school and the university, the student plotted both sets of rainfall data onto the graph, shown in Fig. 1.3, below.

Complete Fig. 1.3 by plotting the following information.

[2]

rainfall on one day at the university 4.0mm
average daily rainfall at the university 3.2mm

fig-1-3-qp-paper42-cie-igcse-geography

Fig. 1.3

(iv)
What conclusion would the student make about Hypothesis 2: Rainfall is higher at the school than at the university? Support your answer with evidence from Fig. 1.3.

[3]

4d3 marks
(d)
Whilst doing her fieldwork the student realised that there was more cloud cover on days when it rained more.

(i)
Which one of the following units of measurement is used to show cloud cover?
Tick () your choice below.

unit of measurement tick (✓)
degrees  
millibars  
millimetres  
oktas  

[1]

(ii)
The student observed three different types of cloud.
Use arrows to match the types of cloud with the correct description in the table below.

type of cloud   description
cirrus   Low altitude grey clouds which occur in layers; rainfall is usually light and is described as ‘drizzle’. 
cumulus   High altitude white clouds which appear ‘wispy’ or look like feathers; no rain falls.
stratus   Low altitude clouds which are separate from each other and appear ‘fluffy’ or look like cotton wool; rain showers may occur.

[2]

4e4 marks
(e)
To extend her fieldwork the student used a sunshine recorder to measure the amount of sunlight on each day. Fig. 1.4 (below) shows a sunshine recorder. Describe how a sunshine recorder is used
fig-1-4-paper42-cie-igcse-geography
Fig.1.4

[4]

Did this page help you?

54 marks

Students at a school in Seattle, USA, measured atmospheric pressure, temperature and rainfall during 15 days in November. 

The students measured the maximum and minimum temperature for each day using a thermometer like the one shown in Fig. 1.1. Explain how the students would use the thermometer to measure temperature. 
 

fig-1-1-q1-0460_w20_in_42
Fig 1.1

[4]

Did this page help you?

66 marks

The results of the students’ measurements of atmospheric pressure are also shown in Table 1.1 and in Fig.1.2.

(i)
Which one of the following instruments would the students use to measure atmospheric pressure? Circle your answer.


anemometer  barometer   hygrometer


      [1]

(ii)
To measure atmospheric pressure the students took readings at midday (12:00 hours) each day. Why was it important to take readings at the same time of day?

 [1]

(iii)
What conclusion did the students make about Hypothesis 1: Temperatures increase as atmospheric pressure rises and decrease as atmospheric pressure falls?
Refer to both maximum and minimum temperatures and support your answer with evidence from Table 1.1 and Fig. 1.2.
[4]

table-1-1-q1-0460_w20_in_42

q1a-ii-1-0460_w20_qp_42

q1a-ii-2-0460_w20_qp_42

Did this page help you?

711 marks
(i)
The students used the instrument shown in Fig. 1.3 (below) to measure daily rainfall.
Describe how the instrument is used to measure rainfall.

fig-1-3-q1-0460_w20_in_42
Fig 1.3
[3]

(ii)
Suggest two factors which the students should consider when choosing a site for the instrument shown in Fig. 1.3 (above). Explain why each factor is important in choosing the site.

Factor 1
Explanation

Factor 2
Explanation
[4]

(iii)
The results of the rainfall measurements are shown in Table 1.2 (below). Plot the rainfall for 13 November on Fig.1.4, below.
Table 1.2
table-1-2-q1-0460_w20_in_42
q1c-iii-1-0460_w20_qp_42
q1c-iii-2-0460_w20_qp_42
[1]

(iv)
The students decided that Hypothesis 2: There is a relationship between atmospheric pressure and daily rainfall totals was true.
Describe the relationship between atmospheric pressure and daily rainfall totals. Use evidence from Fig. 1.4 and Tables 1.1 and 1.2 to support the relationship.
[3]

Table 1.1

table-1-1-q1-0460_w20_in_42

Did this page help you?

87 marks
(i)
To extend their fieldwork the students measured the wind speed and wind direction at midday (12:00 hours). Describe how they would make these measurements.

Wind speed

Wind direction
[4]

(ii)
The results of their measurements of wind speed and wind direction are shown in Table 1.3 (below).

table-1-3-q1-0460_w20_in_42

Complete the wind rose diagram
, Fig. 1.5 below, by adding the number of days that the wind direction was from the south.
q1d-ii-0460_w20_qp_42
[1]

(iii)
What evidence from Table 1.3 supports the statement that there is a relationship between wind speed and wind direction (the direction from which the wind is blowing)?

[2]

Did this page help you?