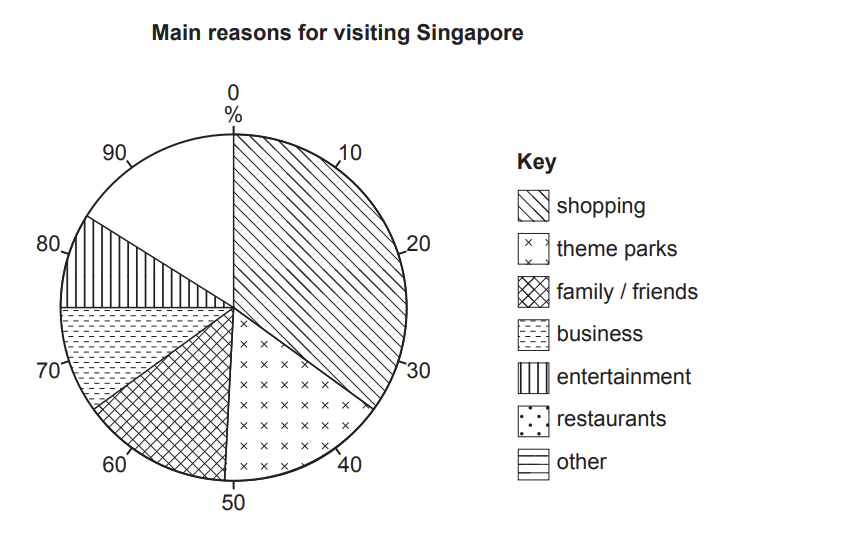
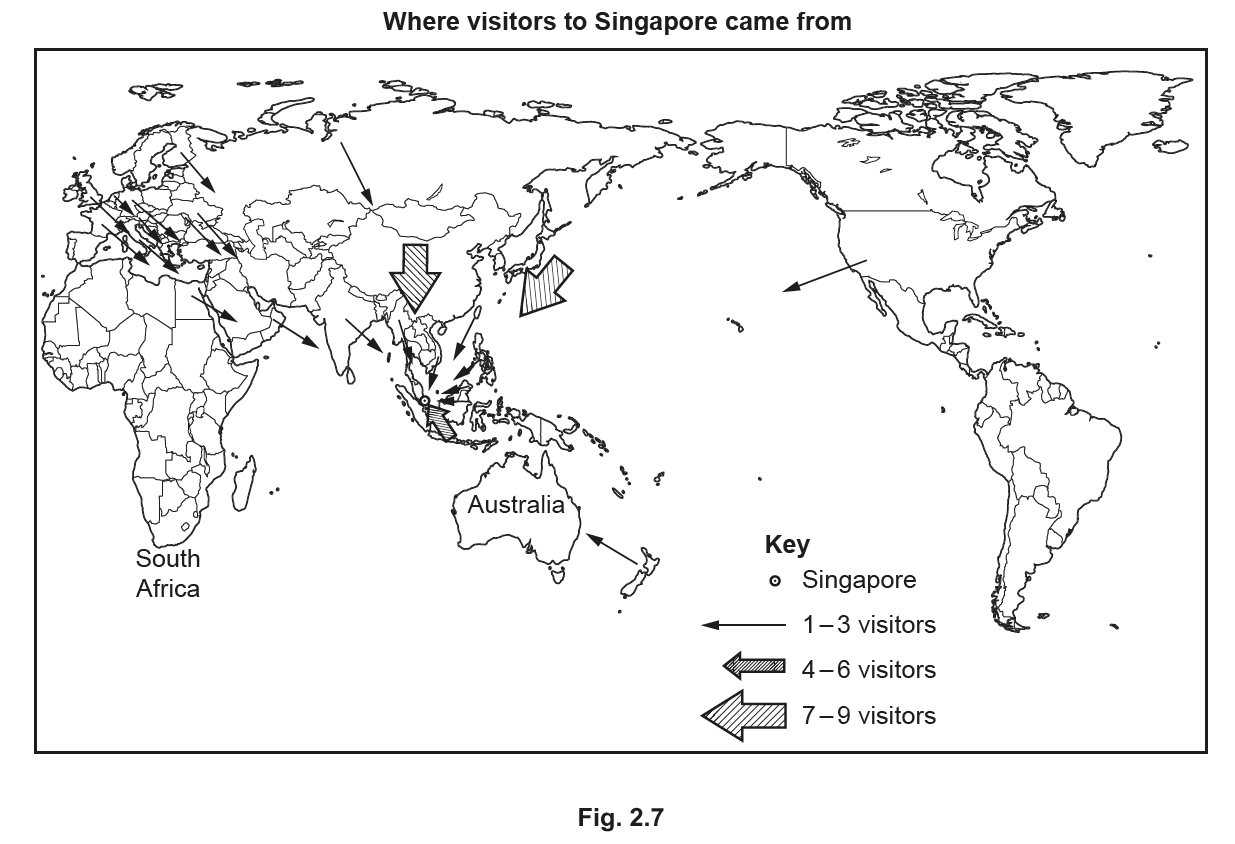
Tourism (CIE IGCSE Geography)

Topic Questions

16 marks

Students from an international school in Singapore, a country in Southeast Asia, were studying tourism. Tourism is an important industry in Singapore and contributes about 10% of the country’s wealth.

Fig. 2.1 (below) shows the change in the number of tourists who visited Singapore between 2002 and 2017.

fig-2-1-paper42-cie-igcse-geography
Note – SARS stands for Severe Acute Respiratory Syndrome 
Fig.2.1

(i)
How many tourists visited Singapore in 2015?

............................. million

[1]

(ii)
Fig. 2.1 shows the impact of two global events on the number of tourists to Singapore. How did these events affect tourist numbers? Include statistics in your answer. 

[3]

(iii)
Suggest two disadvantages for local people of many tourists going to Singapore. 

1 ......................................................................................................
2 ......................................................................................................

[2]

Did this page help you?

23 marks

Singapore has many tourist attractions. Some of these are shown in Fig. 2.2 (below). 

fig-2-2-paper42-cie-igcse-geography
Key
1   Singapore Zoo
2   Singapore Botanic Gardens
3   Orchard Road shops
4   Chinatown temples and historic buildings
5   Raffles Hotel
6   Marina Bay Gardens
7   Sentosa Island theme park
Fig. 2.2

(i)
Which one of the following best describes the Raffles Hotel? Tick () your choice.

[1]

type of attraction tick (✓)
cultural  
man-made  
natural vegetation  
physical landscape  

(ii)
Describe the distribution of the tourist attractions shown in Fig. 2.2.

[2]

Did this page help you?

36 marks

The students produced a questionnaire for visitors to complete in order to test some hypotheses.

The questionnaire is shown in Fig. 2.3 (below).

Visitor survey


 I am doing a survey of visitors to Singapore for my Geography fieldwork task. Please can you answer the     following questions?

  1. Are you a visitor to Singapore?   Yes squareNo
  2. Which age group are you in?

    square10-19              square50-59
    square20-29              square60-69
    square30-39              square70-79
    square40-49              square80 and over

  3. Which city/airport did you travel from? ............................................
  4. How many days will you be staying in Singapore? ............................................
  5. What is your main reason for coming to Singapore?

    squareBusiness
    squareEntertainment
    squareFamily or friends 
    squareRestaurants
    squareShopping
    squareTheme parks  
    squareOther

  6. Is your visit to Singapore a stop on a journey to another destination?
    squareYes  squareNo

   Thank you for your time


Fig. 2.3 

(i)
Why did the students first ask if the person was a visitor to Singapore?

[2]

(ii)
The students went to different tourist attractions to use their questionnaire. Fig. 2.4, below, is an extract from one student’s fieldwork diary, which describes his method for selecting people to survey.

Sampling method
The survey was done by systematic sampling.

Description of the method
I approached any person who walked past me and asked them to complete my questionnaire.  

Fig. 2.4

What is wrong with the student’s description of his method? How should he have described his method?

[2]

(iii)
In class the students agreed on four hypotheses to test. These are shown in the table below. From their questionnaire in Fig. 2.3 (above), choose the questions which provide correct information for the hypotheses and write the question numbers in the table below.

Hypothesis Question(s) to provide
information
Most visitors to Singapore are over the age of 50. .....................
Shopping is the main reason why people come to Singapore. .....................
Most visitors stop in Singapore on their journey to another destination.  .....................
There is a positive relationship between the distance people travel to Singapore and the length of their visit. ..................... and .....................
 

[2]

Did this page help you?

44 marks

One student chose to test the following hypotheses:

Hypothesis 1: Shopping is the main reason why people visit Singapore.

Hypothesis 2: There is a positive relationship between the distance people travel to Singapore and the length of their visit

The reasons people gave for visiting Singapore are shown in Table 2.1 (below).  

Table 2.1
Main reasons for visiting Singapore 

Main reason Percentage (%)
of visitors
 Shopping 35
 Theme parks 16
 Family/friends 14
 Business 10
 Entertainment 9
 Restaurants 5
 Other 11

(i)
Use these results to complete the pie graph in Fig. 2.5 below. 
fig-2-5-qp-paper42-cie-igcse-geography
Fig. 2.5

[2]

(ii)
What conclusion would the students make about Hypothesis 1: Shopping is the main reason why people visit Singapore? Support your decision with evidence from Fig. 2.5 and Table 2.1 (above).

[2]

Did this page help you?

55 marks

To investigate Hypothesis 2: There is a positive relationship between the distance people travel to Singapore and the length of their visit, the students plotted their results on a scatter graph, Fig. 2.6, below. ia)

(i) Plot the following information from two visitors on Fig. 2.6.

distance travelled (km) length of visit (days)
4000 7
1100 8

fig-2-6

[2]

(ii)

Do the results support Hypothesis 2: There is a positive relationship between the distance people travel to Singapore and the length of their visit ? Support your conclusion with evidence from Fig. 2.6 (above).

[3]

Did this page help you?

63 marks

The students used the results of Question 3 in the questionnaire ‘Which city / airport did you travel from?’ to work out the number of visitors coming from different countries. This is shown in Table 2.2 (below).

table-2-2

Use these results to show the number of visitors coming from South Africa and Australia on Fig. 2.7 below.

fig--2-7

[2]

(ii) Which continent did most visitors come from?


 [1]

Did this page help you?

73 marks

When the students checked the completed questionnaire survey sheets, they found three errors.
The survey sheets are shown in Figs. 2.8, 2.9 and 2.10 (below).

fig--2-8

fig--2-9

fig--2-10

 Identify the different error on each survey sheet.

  • Fig. 2.8

  • Fig. 2.9

  • Fig. 2.10

[3]

Did this page help you?

16 marks

Students in Mauritius, an island in the Indian Ocean, were studying tourism. Tourism is an important industry in Mauritius and earns much foreign income.

Fig. 2.1 shows the number of international tourists who visited Mauritius between 1995 and 2015.

(i) How many international tourists visited Mauritius in 2005?

fig-2-1-q2-11-0460-43-2019-163898
Fig 2.1

 [1]

(ii) Between which two years was there a decline in the number of international tourists visiting Mauritius?

[1]


(iii) Suggest four reasons why the number of international tourists visiting LEDCs, such as Mauritius, has increased in the last 30 years.
1 ........................................................................................................................................

2 ........................................................................................................................................

3 ........................................................................................................................................

4 ........................................................................................................................................

 [4]

Did this page help you?

26 marks

The students decided to investigate why international tourists came to Mauritius and what impact tourists had on people who lived on the island. Their two hypotheses were:

Hypothesis 1: The physical landscape attracts more tourists to Mauritius than the human landscape.

Hypothesis 2: Tourism is a good development for the residents of Mauritius.

To investigate Hypothesis 1 the students produced a questionnaire. This is shown in Fig. 2.2.

fig-2-2-q2-11-0460-43-2019-163898
Fig 2.2
(i) When they showed their questionnaire to their teacher she suggested that before using the questionnaire they should ask:
‘Are you a tourist or do you live in Mauritius?’
Why do you think the teacher made this suggestion?

(ii) The answers to Question 1 (Which continent do you come from?) are shown in Table 2.1 below.

Table 2.1
Answers to Question 1

Continent Number of tourists
Asia 17
Africa 14
Europe 55
Australia 2
North America 11
South America 1
Total 100

Using Table 2.1, give two conclusions about where tourists came from to visit Mauritius. Do not just copy out the statistics.

1 ........................................................................................................................................

2 ........................................................................................................................................

[2]

(iii) The answers to Question 2 (Which of the following physical landscape attractions are you visiting in Mauritius?) and Question 3 (Which of the following human landscape attractions are you visiting in Mauritius?) are shown in Table 2.2.

f129a739-6513-44cf-9754-d493b5ee8ea4

Use this data to complete the bar graphs in Fig. 2.3 below, to show the number of visits made to the Casela Bird Park and the Grand Bassin temples.

e142b7f7-8c5c-4dda-92af-71ec81d74dcd

(iv) Complete the pie graph and key in Fig. 2.4 below to show the answers to Question 4 (Overall which attracted you most to Mauritius?).

  Percentage of tourists
Physical landscape attractions 58
Human landscape attractions 42

8785146e-1952-4c83-8df4-565a7ddca418

(v) What conclusion would the students make to Hypothesis 1: The physical landscape attracts more tourists to Mauritius than the human landscape? Support your decision with evidence from Figs. 2.3 and 2.4 and Table 2.2.

[4]

Did this page help you?

33 marks

The students used a different questionnaire to investigate Hypothesis 2: Tourism is a good development for the residents of Mauritius. The questionnaire is shown in Fig. 2.5.

fig-2-5-q2-11-0460-43-2019-163898


Name and describe a sampling method to choose people to complete their questionnaire.

[3]

Did this page help you?

43 marks

The answers to Question 2 (Which are the three main benefits of tourism in Mauritius?) and Question 3 (Which are the three main disadvantages of tourism in Mauritius?) are shown in Table 2.3.

The students devised this simple index to work out which benefits and disadvantages were most important.

(i) The students used the results in Table 2.3 to draw the graph in Fig. 2.6 below. Plot the total index scores for improved transport and air pollution on Fig. 2.6.
Table 2.3 for Question 2
Results of resident questionnaire

Question 2: Main benefits of tourism

First choice Second choice Third choice Total index
score
More jobs and income 39 25 11 178
Improved standard of living 15 20 28 113
More modern services 4 10 13 45
Cleaner environment 5 2 3 22
Improved transport 12 10 14 70
More global awareness 3 19 11 58
Reduction in crime 10 9 7 55
More goods in shops 12 5  13 59

Question 3: Main
disadvantages of tourism
First choice Second Third choice Total index
score
Noise pollution 7 12 10 55
Air pollution 26 16 12 122
Traffic congestion 27 23 18 145
More crime 5 7 8 37
Decline of traditional culture 11 8 16 65
Destruction of natural environment 5 12 15 54
More litter 7 14 12 61
Increase in cost of living 12 8  9 61

Question 4: Overall effect of

tourism

Answers
Benefits 87
Disadvantages 13

q2-2di-0460-w19-qp-43

[2]

Using evidence in Table 2.3 only, which one of the following statements supports

Hypothesis 2: Tourism is a good development for the residents of Mauritius?

Statement Tick (✓)
There are more benefits of tourism than disadvantages of
tourism.
 
The total index score for benefits is greater than the total
index score for disadvantages.
 
Overall people think the benefits of tourism are greater
than the disadvantages.
 

Did this page help you?

56 marks

Local people identified traffic congestion as the main disadvantage of tourism in Mauritius.
(i) Suggest why tourism is likely to increase traffic congestion.

 [2]


(ii) Describe how the students could carry out fieldwork to investigate the impact of traffic congestion in Mauritius.
 

[4]

Did this page help you?