Statistical Infrequency
Statistical infrequency
- Statistical infrequency (or statistical deviation as it is also known) uses statistics, to determine the difference between normal and abnormal behaviour
- A behaviour is regarded as abnormal if it is statistically uncommon/unusual i.e. not present often or regularly per society for example:
- The average IQ is approximately 100 - 95% of the population have an IQ of 70 to 130: approximately 5% of the population have an IQ below 70 or above 130 both of which are statistically uncommon i.e. abnormal
- About 1 in 300 (0.33%) people worldwide have schizophrenia, making it an abnormal condition/illness
- Rare behaviours/conditions are considered statistically abnormal
- Behaviours that are considered normal/abnormal are based on where they sit within a normal distribution
- A distribution curve (graph) can be used to represent the proportions of a population who share a particular characteristic
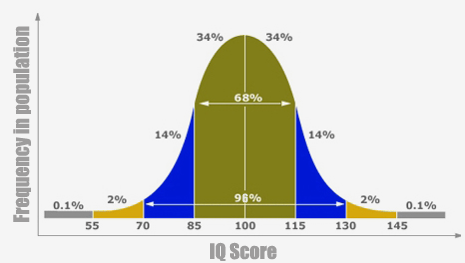
The distribution curve for IQ, showing a classic normal distribution (www.highiqpro.com/iq-tests/what-does-my-iq-score-mean)
- The diagram above shows the distribution curve for IQ: at each end of the curve are the outliers: 2.5% of the population on the furthest left of the curve demonstrate an IQ below 70 and 2.5% on the furthest right demonstrate an IQ above 130
- These people (the 2.5%-ers are statistically infrequent/deviant and would therefore be classed as abnormal
- Most people score around the mean (in the case above, 85-115 IQ score) of the normal distribution with rare behaviours located at the 'pointy ends' of the curve
Evaluation of statistical infrequency
Strengths
- This method of defining abnormality uses an objective, standardised measure which means that it is reliable
- Distribution curves are based on real data and, therefore, should be unbiased
Weaknesses
- Depression is regarded as abnormal behaviour (a psychopathology) yet is so prevalent (1 in 6 adults in the UK have depression - 17% of the population) which means that it is not statistically deviant, hence using this as a measure of abnormality is unrepresentative
- Having an IQ of 130 might be regarded as advantageous rather than as evidence of 'abnormality'
Exam Tip
When you answer a question on statistical infrequency/deviation make sure that you are aware that labelling anyone 'abnormal' is damaging to their self-image, self-esteem and potentially their relationships with other people. If you are told that your IQ makes you 'abnormal' you may question yourself, your choices in life, how other people view you etc. The concept of 'normality' is at best flawed and unreliable so it can be a dangerous thing to apply such a 'cold' measure as statistics to human behaviour.