Investigating Cooling Curves for Stearic Acid (Oxford AQA IGCSE Physics)
Revision Note

Author
Ann HowellExpertise
Physics Content Creator
Required Practical: Investigating Cooling Curves for Stearic Acid
Aim of the experiment
The aim of this experiment is to obtain a cooling curve for stearic acid as it is cooled and use the curve to find the melting point of stearic acid
Variables
Independent variable = Time, t
Dependent variable = Temperature, T
Control variables:
Volume of acid, V
Initial mass of acid, m
Equipment
Equipment List
Equipment | Purpose |
|---|---|
Clamp & Stand | To hold the boiling tube and thermometer in place |
Thermometer | To measure the temperature of the stearic acid |
Boiling tube | To contain the stearic acid |
Beaker | To hold the warm water in which the boiling tube is held |
Warm water | To cool around the stearic acid to facilitate a more measurable change in temperature (cold water may cause the glass to break) |
Stopwatch | To measure the time of the stearic acid to cool |
Beaker of boiling stearic acid | To provide the initial sample of boiling stearic acid |
Resolution of measuring equipment:
Thermometer = 1 °C
Stopwatch = 0.01 s
Method
Equipment for obtaining the cooling curve of stearic acid

Secure the boiling tube of boiling stearic acid in place with the clamp stand inside the beaker of boiling water. Position the thermometer and start your stopwatch
Record the temperature in degrees Celsius every minute until it reaches about 40 °C
For each reading state in the results table whether the stearic acid looks more like a solid or a liquid
Example Results Table

Analysis of results
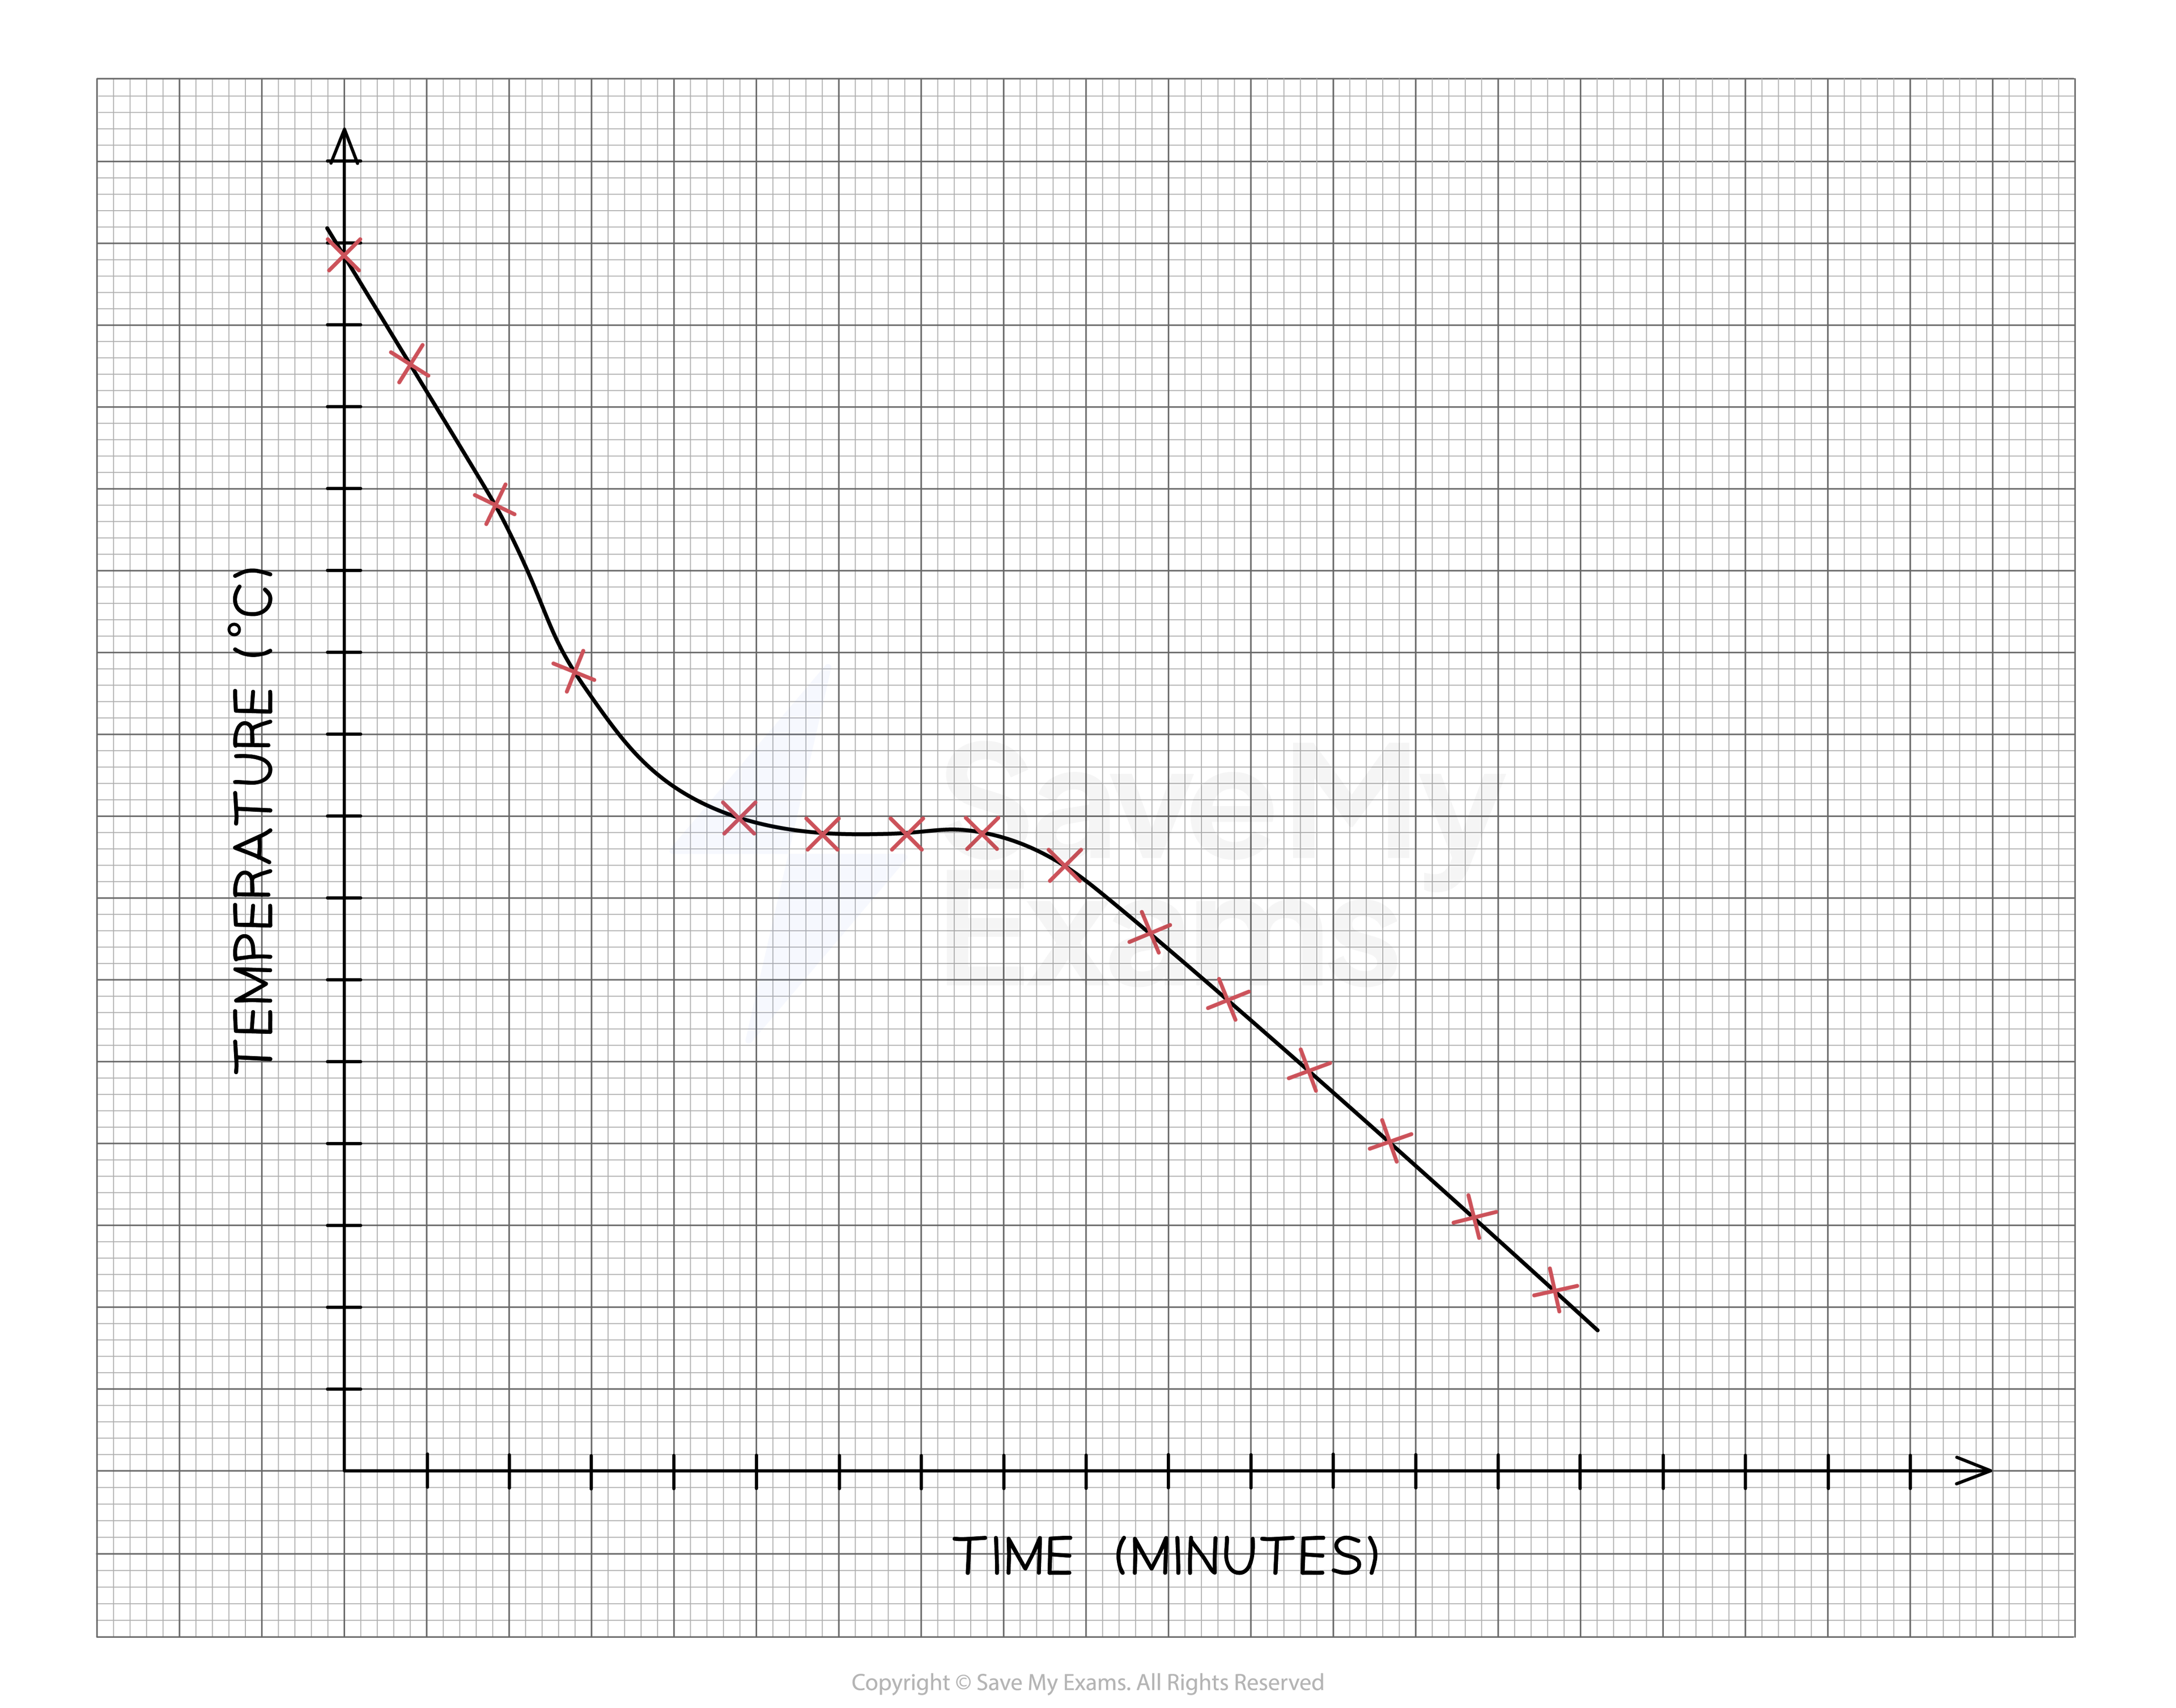
Plot a graph of temperature against time
Draw a line for the cooling curve passing through all the indicated points
If the cooling curve shows a horizontal straight line then this indicates the time when the stearic acid is changing state
An example of a cooling curve for stearic acid
Evaluating the experiment
Systematic Errors:
Make sure the measurements on the thermometer and stopwatch are taken at eye level to avoid parallax error
Random Errors:
Make sure the thermometer is fully in contact with the stearic acid and not in contact with the glass boiling tube
Repeat the experiment several times
Make sure the thermometer and the boiling tube are in the same depth every time
Safety considerations
Wear goggles during this experiment in case the stearic acid splatters
Wear gloves during this experiment in case the stearic acid spills
Stand up while carrying out the experiment making sure not to knock the clamp stand and boiling tube or beaker
Place a mat or a soft material below the beaker to absorb any acid that might spill
Use a G clamp to secure the clamp stand to the desk so that the boiling tube does not fall over

You've read 0 of your 0 free revision notes
Get unlimited access
to absolutely everything:
- Downloadable PDFs
- Unlimited Revision Notes
- Topic Questions
- Past Papers
- Model Answers
- Videos (Maths and Science)
Did this page help you?