Half-Life (Oxford AQA IGCSE Physics)
Revision Note

Author
Caroline CarrollExpertise
Physics Subject Lead
Half-Life
It is impossible to know when a particular unstable nucleus will decay
With a large enough sample of unstable nuclei, it becomes possible to predict how many unstable nuclei will undergo radioactive decay
The half-life of a radioactive isotope is defined as:
The average time it takes for the number of nuclei of a sample of radioactive isotopes to decrease by half
In other words, half-life is the time it takes for the count rate of a sample to fall to half its original level
Different isotopes have different half-lives and half-lives can vary from a fraction of a second to billions of years in length
Using half-life
Scientists can measure the half-lives of different isotopes accurately:
Uranium-235 has a half-life of 704 million years
This means it would take 704 million years for the count rate of a uranium-235 sample to decrease to half its original amount
Carbon-14 has a half-life of 5700 years
So after 5700 years, there would be 50% of the original amount of carbon-14 remaining
After two half-lives, or 11 400 years, there would be just 25% of the carbon-14 remaining
With each half-life, the number of nuclei of the original element remaining decreases by half
Remember that when the nuclei decay, they become another element, they do not disappear
For this reason, the mass of the sample does not significantly change
Graph of count rate against time
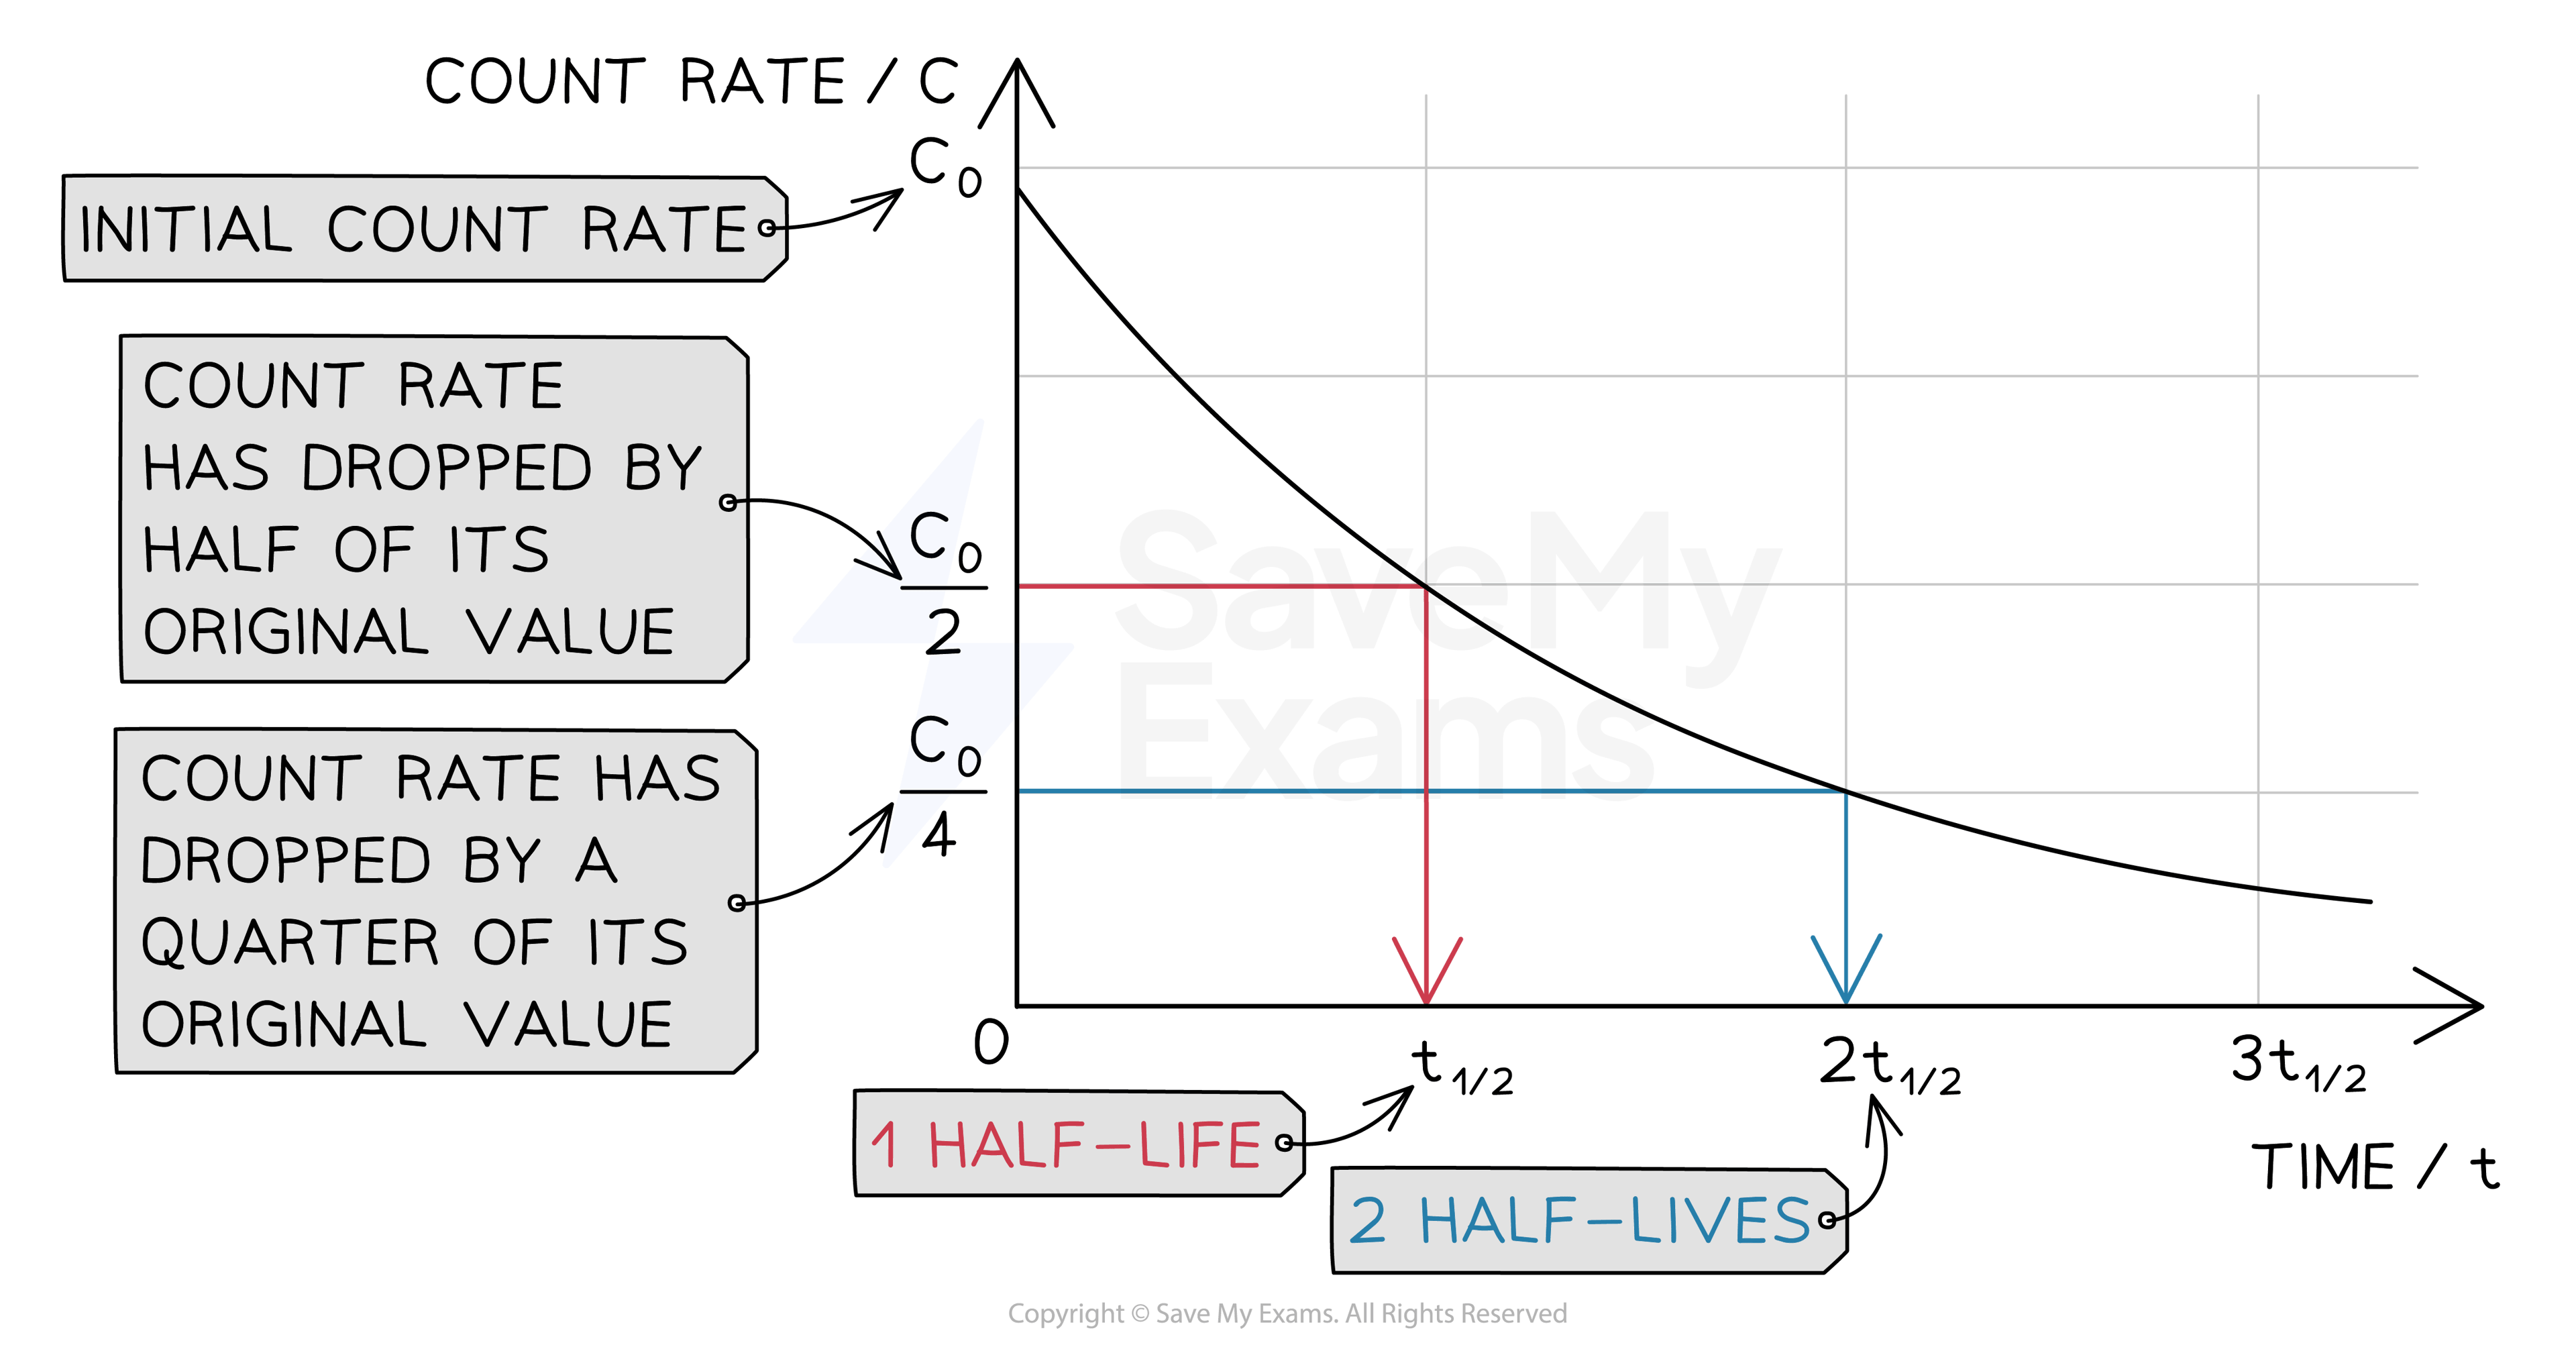
The time it takes for the count rate of the sample to decrease from 100 % to 50 % is the half-life
It is the same length of time as it would take to decrease from 50 % activity to 25 % activity
The half-life is constant for a particular isotope
Calculating half-Life
To calculate the half-life of a sample, the procedure is:
Measure the initial count rate of the sample
Measure how the count rate changes with time
The time taken for the count rate to decrease to half its original value is the half-life
Worked Example
The radioisotope technetium is used extensively in medicine. The graph below shows how the count rate of a sample varies with time.

Determine the half-life of this material.
Answer:
Step 1: Draw lines on the graph to determine the time it takes for technetium to drop to half of its original count rate
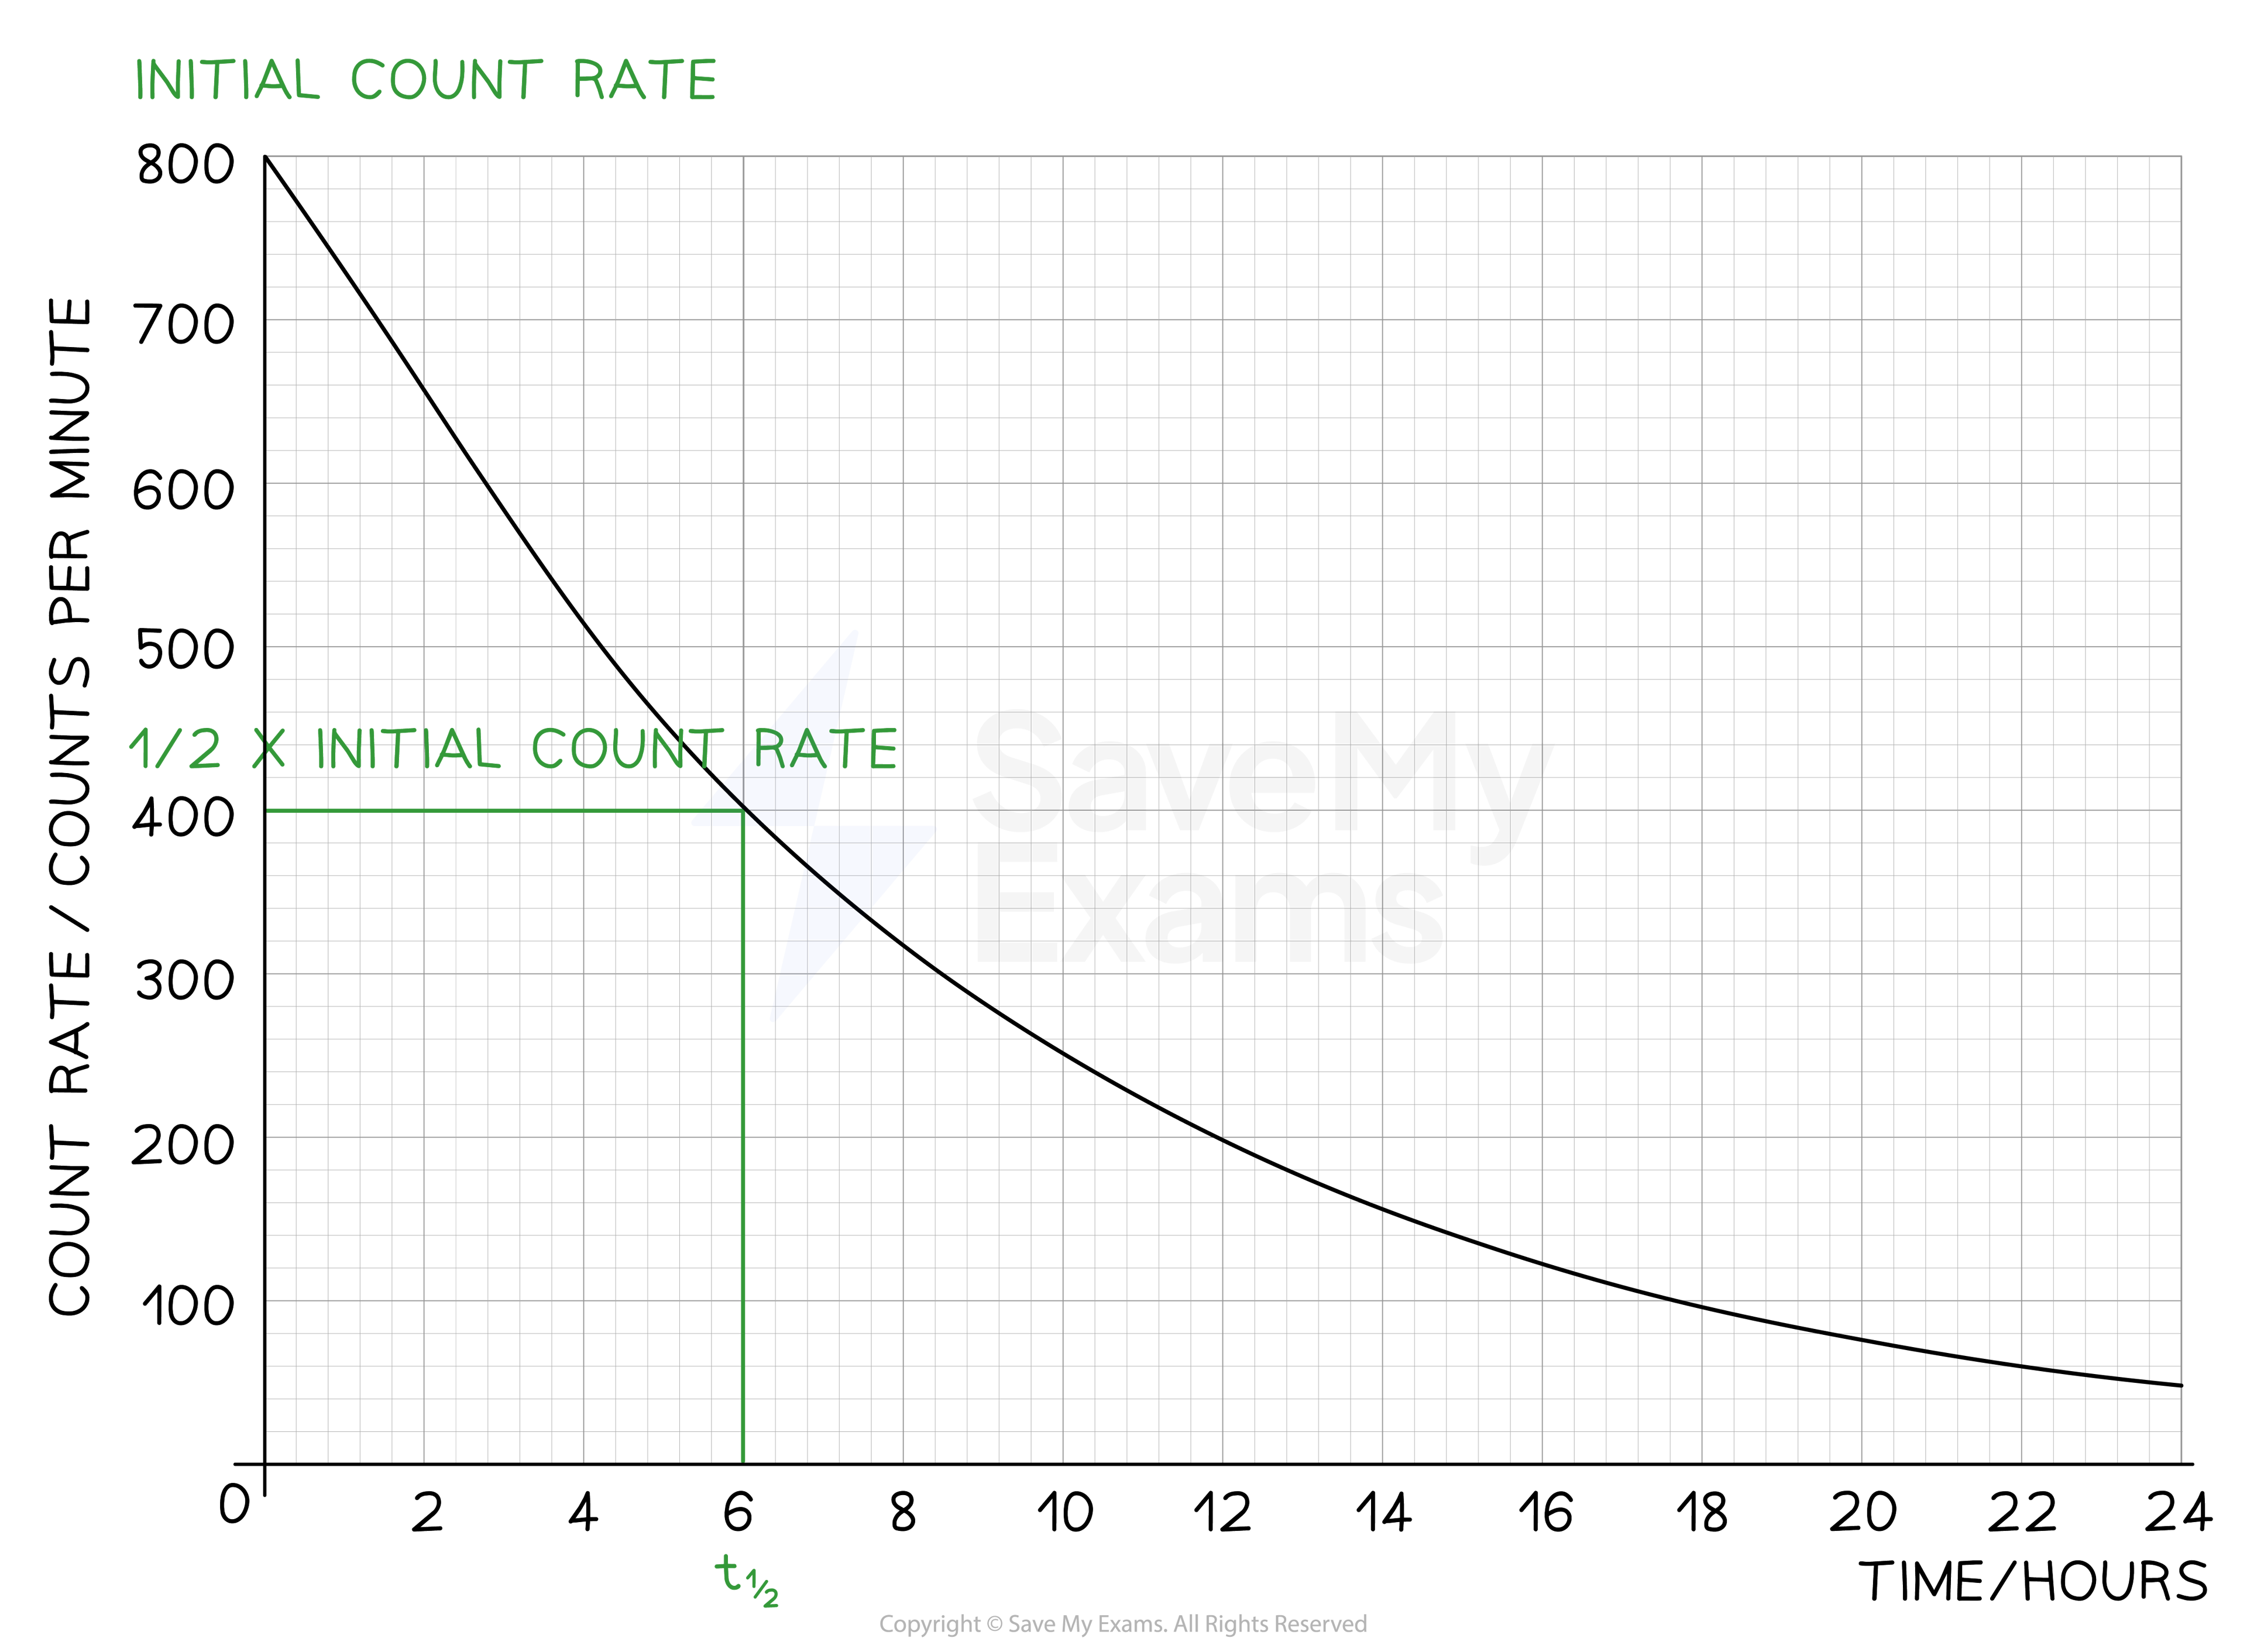
Step 2: Read the half-life from the graph
In the diagram above the initial count rate is 800 counts per minute
The time taken to decrease to 400 counts per minute is 6 hours
The time taken to decrease to 200 counts per minute is 6 more hours
The time taken to decrease to 100 counts per minute is 6 more hours
Therefore, the half-life of this isotope is 6 hours
Worked Example
A particular radioactive sample contains 2 million un-decayed atoms. After a year, there is only 500 000 atoms left un-decayed. What is the half-life of this material?
Answer:
Step 1: Calculate how many times the number of un-decayed atoms has halved
There were 2 000 000 atoms to start with
1 000 000 atoms would remain after 1 half-life
500 000 atoms would remain after 2 half-lives
Therefore, the sample has undergone 2 half-lives
Step 2: Divide the time period by the number of half-lives
The time period is a year
The number of half-lives is 2
1 year divided by 2 is half a year or 6 months
Therefore, the half-life is 6 months
Exam Tip
You can use models to demonstrate the random process of radioactive decay.
Imagine rolling a dice and hoping to roll a six. Each time you roll the dice, you cannot know what the result will be, but you know there is a 1/6 probability that it will be a six. If you rolled the dice 1000 times, you can expect to roll a '6' around 1000 ÷ 6 ≈ 127 times
Another common model is to use the flip of a coin to model radioactive decay. For each coin, the probability of a landing 'heads' is 1/2, but we still cannot predict the outcome or confidently say when a 'heads' will appear, this is why it's important to use a very large sample of coins (or dice!) to represent the process of radioactive decay.

You've read 0 of your 0 free revision notes
Get unlimited access
to absolutely everything:
- Downloadable PDFs
- Unlimited Revision Notes
- Topic Questions
- Past Papers
- Model Answers
- Videos (Maths and Science)
Did this page help you?