Distance-Time Graphs (Oxford AQA IGCSE Physics)
Revision Note

Author
Leander OatesExpertise
Physics
Distance-Time Graphs
A distance-time graph is used to describe the motion of an object and calculate its speed
A Distance-Time graph of an object moving in a straight line

Constant speed on a Distance-Time graph
A straight line represents constant speed
The slope of the straight line represents the magnitude of the speed:
A very steep slope means the object is moving at a fast speed
A shallow slope means the object is moving at a slower speed
A flat, horizontal line means the object is stationary (not moving)
The gradient of a Distance-Time graph

Calculating Speed from a Distance-Time Graph
The speed of a moving object can be calculated from the gradient of the line on a distance-time graph:
![]()
Where:
format('truetype')%3Bfont-weight%3Anormal%3Bfont-style%3Anormal%3B%7D%3C%2Fstyle%3E%3C%2Fdefs%3E%3Ctext%20font-family%3D%22math1ed582716bfb4738ccd92405301%22%20font-size%3D%2216%22%20text-anchor%3D%22middle%22%20x%3D%227.5%22%20y%3D%2216%22%3E%26%23x2206%3B%3C%2Ftext%3E%3Ctext%20font-family%3D%22Times%20New%20Roman%22%20font-size%3D%2218%22%20font-style%3D%22italic%22%20text-anchor%3D%22middle%22%20x%3D%2219.5%22%20y%3D%2216%22%3Ey%3C%2Ftext%3E%3C%2Fsvg%3E) is the change in y (distance) values
is the change in y (distance) valuesformat('truetype')%3Bfont-weight%3Anormal%3Bfont-style%3Anormal%3B%7D%3C%2Fstyle%3E%3C%2Fdefs%3E%3Ctext%20font-family%3D%22math1ed582716bfb4738ccd92405301%22%20font-size%3D%2216%22%20text-anchor%3D%22middle%22%20x%3D%227.5%22%20y%3D%2216%22%3E%26%23x2206%3B%3C%2Ftext%3E%3Ctext%20font-family%3D%22Times%20New%20Roman%22%20font-size%3D%2218%22%20font-style%3D%22italic%22%20text-anchor%3D%22middle%22%20x%3D%2219.5%22%20y%3D%2216%22%3Ex%3C%2Ftext%3E%3C%2Fsvg%3E) is the change in x (time) values
is the change in x (time) values
Calculating the gradient of a straight line

The gradient of a distance-time graph is equal to the object's speed
Worked Example
A distance-time graph is drawn below for part of a train journey. The train is travelling at a constant speed.

Calculate the speed of the train.
Answer:
Step 1: Draw a large gradient triangle on the graph
The image below shows a large gradient triangle drawn with dashed lines
The
and magnitudes are labelled, using the units as stated on each axes

Step 2: Convert units for distance and time into standard units
The distance travelled = 8 km = 8000 m
The time taken = 6 mins = 360 s
Step 3: State that speed is equal to the gradient of a distance-time graph
The gradient of a distance-time graph is equal to the speed of a moving object:
![]()
Step 4: Substitute values to calculate the speed
![]()
![]()
Worked Example
A man decides to take a stroll to the park. He finds a bench in a quiet spot and takes a seat, picking up where he left off reading his book on black holes. After some time reading, the man realises he lost track of time and runs home.
A distance-time graph for his trip is drawn below.

(a) How long does the man spend reading his book?
(b) There are three sections labelled on the graph, A, B and C. Which section represents the man running home?
(c) What is the total distance travelled by the man?
Answer:
Part (a)
The man spends 40 minutes reading his book
The flat section of the line (section B) represents an object which is stationary - so section B represents the man sitting on the bench reading
This section lasts for 40 minutes - as shown in the graph below
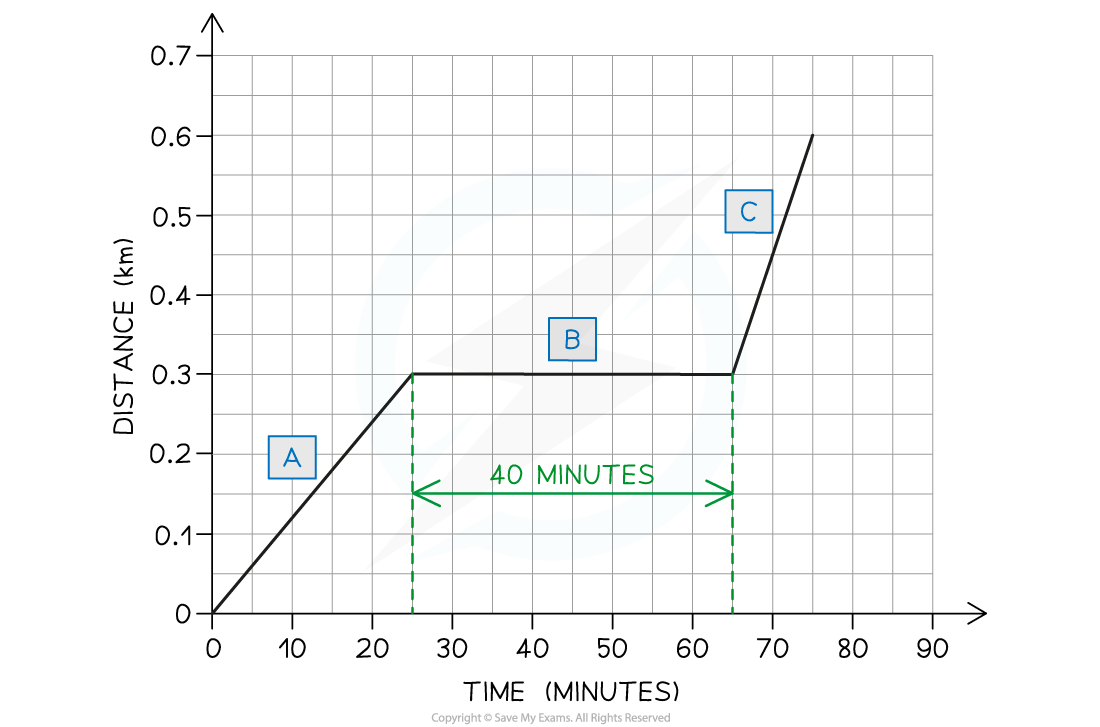
Part (b)
Section C represents the man running home
The slope of the line in section C is steeper than the slope in section A
This means the man was moving with a faster speed (running) in section C
Part (c)
The total distance travelled by the man is 0.6 km
The total distance travelled by an object is given by the final point on the line - in this case, the line ends at 0.6 km on the distance axis. This is shown in the image below:

Exam Tip
Use the entire line or line segment to calculate the gradient. Examiners tend to award credit if they see a large gradient triangle used - so remember to draw these directly on the graph itself!
Remember to check the units of variables measured on each axis. These may not always be in standard units - in these examples, the unit of distance was km and the unit of time was minutes. Double-check which units to use in your answer.

You've read 0 of your 0 free revision notes
Get unlimited access
to absolutely everything:
- Downloadable PDFs
- Unlimited Revision Notes
- Topic Questions
- Past Papers
- Model Answers
- Videos (Maths and Science)
Did this page help you?