1 6 marks
Figure 5a shows the percentage of low-paid residents in each London borough in 2015–16.
Figure 5b shows the percentage of waste that was recycled in each London borough in 2015–16.
Figure 5c shows a Spearman’s rank calculation used to study whether there is a relationship between the proportion of low-paid residents and rates of recycling in London boroughs in 2015–16.
Figure 5a
The percentage of low-paid residents in each London borough in 2015–16
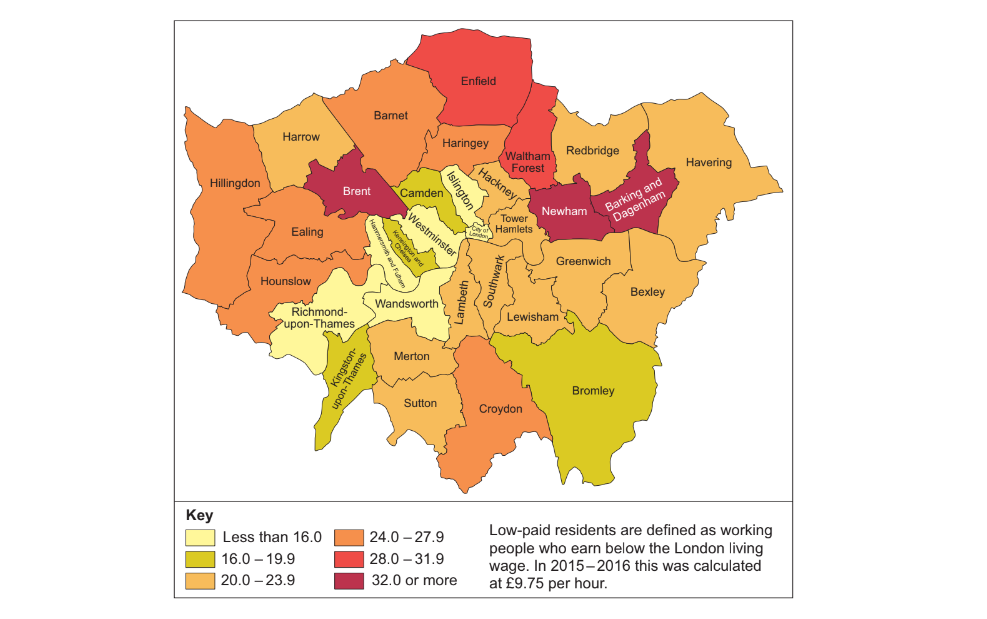
Figure 5b – Percentage of waste recycled, 2015–16

Figure 5c
The null hypothesis is: ‘There is no relationship between proportions of low-paid residents and rates of recycling in London boroughs.’
| Rs Value | –0.206 |
|
Critical Value at 0.05 significance level (n = 33) |
0.345 |
Analyse the data shown in Figures 5a, 5b and 5c.
[6]
Did this page help you?