Quantitative & Qualitative skills (AQA A Level Geography)

Topic Questions

1
Sme Calculator
6 marks

Figure 6 shows data obtained from students from an estate agent indicating how average house prices in the local town had changed over the previous 30-year period.

Figure 6

House price £ 1986 1991 1996 2001 2006 2011 2016
1 bedroomed flat or house 27 45 41 86 105 103 114
2 bedroomed house 32 51 49 95 146 141 158
3 or 4 bedroomed house 43 68 67 157 238 227 247
2 or 3 bedroomed bungalow 39 61 59 140 205 195 209

*All figures in thousands

Assess the usefulness of house price data such as that shown in Figure 6 in helping to understand the nature of a local place, comparing it with other quantitative sources that you used in studying place.

[6]

Did this page help you?

2
Sme Calculator
6 marks

Figure 3a shows a poem and sketch, written and drawn in 1906, about Ancoats, an inner-city area of Manchester.

Figure 3b is an aerial photograph of Ancoats taken in 2014.

Figure 3a – a poem and sketch, written and drawn in 1906, about Ancoats, an inner-city area of Manchester

fig-3a-inserts-paper2-nov2021-aqa-alevel-geography

Note: This was written by Roger Oldham in 1906 for a book entitled ‘A–Z of Manchester’

Figure 3b – aerial photograph of Ancoats taken in 2014

fig-3b-inserts-paper2-nov2021-aqa-alevel-geography

Evaluate the usefulness of Figure 3a and Figure 3b in showing change in Ancoats.

[6]

Did this page help you?

3
Sme Calculator
20 marks

With reference to your local place, assess the extent to which qualitative sources (for example songs, artwork) present contrasting images to quantitative sources (for example census data, maps).

[20]

Did this page help you?

4
Sme Calculator
4 marks

Outline how geospatial data can be used to present place characteristics.


[4]

Did this page help you?

5
Sme Calculator
6 marks

Figure 3a shows a word cloud produced as a result of a recent health survey asking: ‘What factors do you feel most influence your health and wellbeing?’

Figure 3b shows the ward’s population structure in 2011.

Figure 3c shows the reasons for residents not being in employment in the ward in 2011.

Figure 3a

A word cloud produced as a result of a recent health survey asking
‘What factors do you feel most influence your health and wellbeing?’

fig-3a-inserts-paper2-june2019-aqa-alevel-geography

Note: a word cloud displays the responses in a font size and colour relating to the frequency of these responses.

Figure 3bPopulation structure, Weston-super-Mare Central ward, 2011

p~919fPx_fig-3b-inserts-paper2-june2019-aqa-alevel-geography

Figure 3c – Reasons for residents not being in employment in 2011

fig-3c-inserts-paper2-june2019-aqa-alevel-geography

Analyse the data shown in Figures 3a, 3b and 3c.

[6]

Did this page help you?

6
Sme Calculator
6 marks

Figure 3a shows qualitative data measuring personal well-being across selected inner London boroughs.

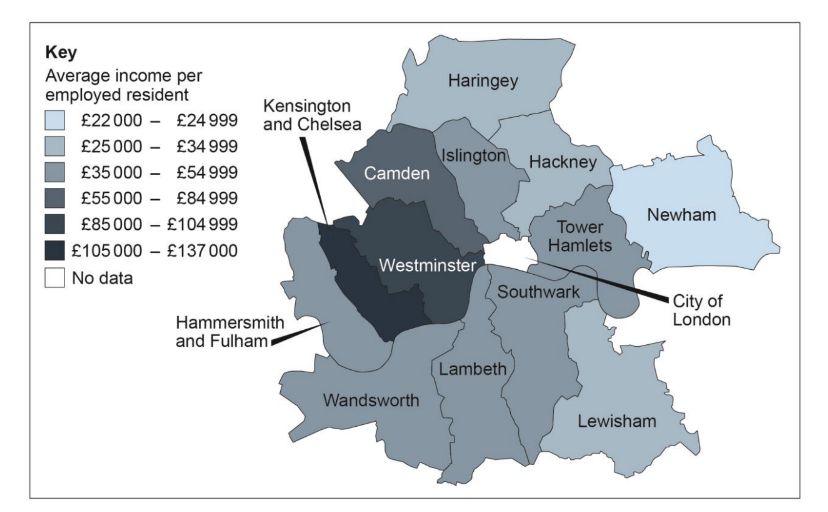
Figure 3b shows average income of employed residents in each selected borough.

Figure 3a

fig-3a-paper2-june2018-aqa-alevel-geography

Figure 3b

fig-3b-paper2-june2018-aqa-alevel-geography

Analyse the data shown in Figure 3a and Figure 3b.

[6]

Did this page help you?