Quantitative & Qualitative skills (AQA A Level Geography)

Topic Questions

1
Sme Calculator
6 marks

Figure 8 shows the location of three US glaciers.

Figure 9 shows the change in their size (mass balance) between 1958 and 2005.

Figure 10 shows the cumulative impact of the annual change in mass balance within the three glaciers.

Figure 8                                                        Figure 9

fig-8-and-9-paper1-specimen-aqa-alevel-geography

Figure 10

fig-10-paper1-specimen-aqa-alevel-geography

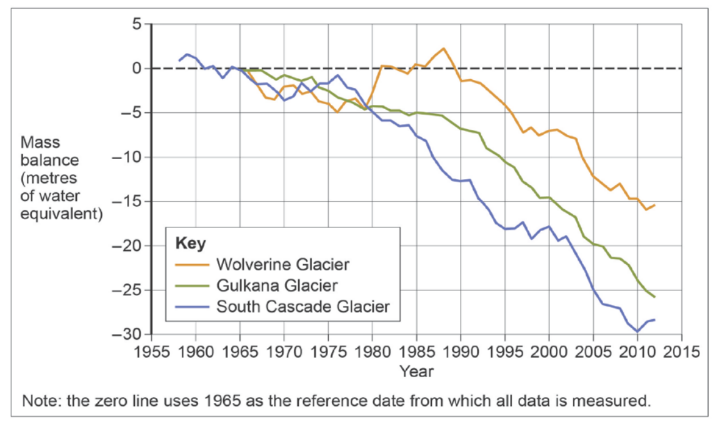
Using Figures 8, 9 and 10, compare the differences between the glaciers.


[6]

Did this page help you?

2
Sme Calculator
6 marks

Figure 7 shows information about ground temperatures at the Endalen permafrost station in central Spitsbergen, Svalbard. Temperatures have been recorded in a 19-metre-deep borehole since September 2008.

Figure 7

ground-temps-at-endalen
Ground temperatures at the Endalen permafrost station in central Spitsbergen, Svalbard; Geology Department at the University Centre in Svalbard (UNIS). International Permafrost Association (IPA)

Analyse the data shown in Figure 7.
[6]

Did this page help you?