- The elements can be identified in the break-even chart below
- The selling price is £32 per unit
- Variable costs are £7.60 per unit
- Fixed costs are £8,000
Diagram: Break-even Chart with Key Elements
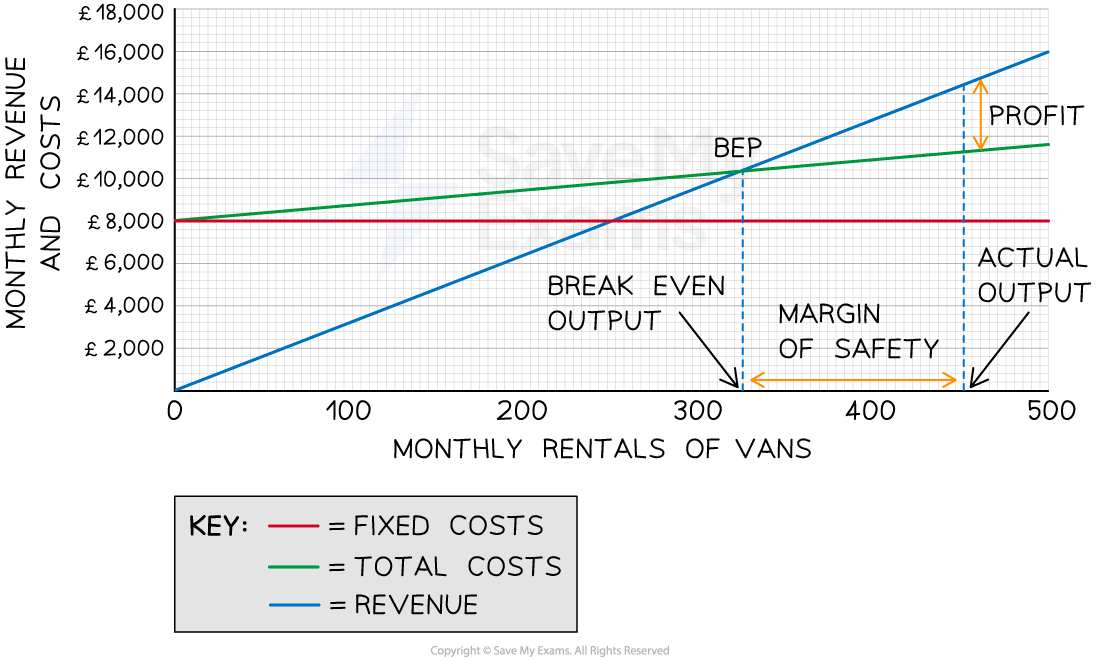
The break-even chart shows the break-even point, profit at a given level of output and the margin of safety
Diagram analysis
- Fixed costs do not change as output increases
- Fixed costs are £8,000 and these do not change whether the business produces 0 units or 500 units
- It is therefore represented by a horizontal line at £8,000 for all levels of output
- Total costs are made up of fixed and variable costs
Fixed, Variable and Total Costs at Different Levels of Output
| Units |
0 |
100 |
200 |
300 |
400 |
500 |
Variable costs (£)
|
0
|
760 |
1,520 |
2,280 |
3,040 |
3,800 |
Fixed costs (£)
|
8,000 |
8,000 |
8,000 |
8,000 |
8,000 |
8,000 |
Total costs (£)
|
8,000 |
8,760 |
9,520 |
10,280 |
11,040 |
11,800 |
-
- At 0 units of output, total costs are made up exclusively of fixed costs
- At 500 units, the total costs are £11,800
format('truetype')%3Bfont-weight%3Anormal%3Bfont-style%3Anormal%3B%7D%3C%2Fstyle%3E%3C%2Fdefs%3E%3Ctext%20font-family%3D%22Arial%22%20font-size%3D%2216%22%20text-anchor%3D%22middle%22%20x%3D%2218.5%22%20y%3D%2216%22%3ETotal%3C%2Ftext%3E%3Ctext%20font-family%3D%22Arial%22%20font-size%3D%2216%22%20text-anchor%3D%22middle%22%20x%3D%2269.5%22%20y%3D%2216%22%3EVariable%3C%2Ftext%3E%3Ctext%20font-family%3D%22Arial%22%20font-size%3D%2216%22%20text-anchor%3D%22middle%22%20x%3D%22123.5%22%20y%3D%2216%22%3ECosts%3C%2Ftext%3E%3Ctext%20font-family%3D%22math17fc2f01a1f847f9077daadcbe9%22%20font-size%3D%2216%22%20text-anchor%3D%22middle%22%20x%3D%22156.5%22%20y%3D%2216%22%3E%3D%3C%2Ftext%3E%3Ctext%20font-family%3D%22Arial%22%20font-size%3D%2216%22%20text-anchor%3D%22middle%22%20x%3D%22187.5%22%20y%3D%2216%22%3EUnits%3C%2Ftext%3E%3Ctext%20font-family%3D%22math17fc2f01a1f847f9077daadcbe9%22%20font-size%3D%2216%22%20text-anchor%3D%22middle%22%20x%3D%22216.5%22%20y%3D%2216%22%3E%26%23xD7%3B%3C%2Ftext%3E%3Ctext%20font-family%3D%22Arial%22%20font-size%3D%2216%22%20text-anchor%3D%22middle%22%20x%3D%22257.5%22%20y%3D%2216%22%3EVariable%3C%2Ftext%3E%3Ctext%20font-family%3D%22Arial%22%20font-size%3D%2216%22%20text-anchor%3D%22middle%22%20x%3D%22307.5%22%20y%3D%2216%22%3ECost%3C%2Ftext%3E%3Ctext%20font-family%3D%22Arial%22%20font-size%3D%2216%22%20text-anchor%3D%22middle%22%20x%3D%22339.5%22%20y%3D%2216%22%3Eper%3C%2Ftext%3E%3Ctext%20font-family%3D%22Arial%22%20font-size%3D%2216%22%20text-anchor%3D%22middle%22%20x%3D%22369.5%22%20y%3D%2216%22%3EUnit%3C%2Ftext%3E%3Ctext%20font-family%3D%22math17fc2f01a1f847f9077daadcbe9%22%20font-size%3D%2216%22%20text-anchor%3D%22middle%22%20x%3D%228.5%22%20y%3D%2259%22%3E%3D%3C%2Ftext%3E%3Ctext%20font-family%3D%22Arial%22%20font-size%3D%2216%22%20text-anchor%3D%22middle%22%20x%3D%2234.5%22%20y%3D%2259%22%3E500%3C%2Ftext%3E%3Ctext%20font-family%3D%22math17fc2f01a1f847f9077daadcbe9%22%20font-size%3D%2216%22%20text-anchor%3D%22middle%22%20x%3D%2259.5%22%20y%3D%2259%22%3E%26%23xD7%3B%3C%2Ftext%3E%3Ctext%20font-family%3D%22Arial%22%20font-size%3D%2216%22%20text-anchor%3D%22middle%22%20x%3D%2277.5%22%20y%3D%2259%22%3E%26%23xA3%3B%3C%2Ftext%3E%3Ctext%20font-family%3D%22Arial%22%20font-size%3D%2216%22%20text-anchor%3D%22middle%22%20x%3D%2288.5%22%20y%3D%2259%22%3E7%3C%2Ftext%3E%3Ctext%20font-family%3D%22math17fc2f01a1f847f9077daadcbe9%22%20font-size%3D%2216%22%20text-anchor%3D%22middle%22%20x%3D%2295.5%22%20y%3D%2259%22%3E.%3C%2Ftext%3E%3Ctext%20font-family%3D%22Arial%22%20font-size%3D%2216%22%20text-anchor%3D%22middle%22%20x%3D%22107.5%22%20y%3D%2259%22%3E60%3C%2Ftext%3E%3Ctext%20font-family%3D%22math17fc2f01a1f847f9077daadcbe9%22%20font-size%3D%2216%22%20text-anchor%3D%22middle%22%20x%3D%228.5%22%20y%3D%22102%22%3E%3D%3C%2Ftext%3E%3Ctext%20font-family%3D%22Arial%22%20font-size%3D%2216%22%20text-anchor%3D%22middle%22%20x%3D%2227.5%22%20y%3D%22102%22%3E%26%23xA3%3B%3C%2Ftext%3E%3Ctext%20font-family%3D%22Arial%22%20font-size%3D%2216%22%20text-anchor%3D%22middle%22%20x%3D%2238.5%22%20y%3D%22102%22%3E3%3C%2Ftext%3E%3Ctext%20font-family%3D%22math17fc2f01a1f847f9077daadcbe9%22%20font-size%3D%2216%22%20text-anchor%3D%22middle%22%20x%3D%2245.5%22%20y%3D%22102%22%3E%2C%3C%2Ftext%3E%3Ctext%20font-family%3D%22Arial%22%20font-size%3D%2216%22%20text-anchor%3D%22middle%22%20x%3D%2261.5%22%20y%3D%22102%22%3E800%3C%2Ftext%3E%3Ctext%20font-family%3D%22Arial%22%20font-size%3D%2216%22%20text-anchor%3D%22middle%22%20x%3D%2218.5%22%20y%3D%22145%22%3ETotal%3C%2Ftext%3E%3Ctext%20font-family%3D%22Arial%22%20font-size%3D%2216%22%20text-anchor%3D%22middle%22%20x%3D%2260.5%22%20y%3D%22145%22%3ECosts%3C%2Ftext%3E%3Ctext%20font-family%3D%22math17fc2f01a1f847f9077daadcbe9%22%20font-size%3D%2216%22%20text-anchor%3D%22middle%22%20x%3D%2293.5%22%20y%3D%22145%22%3E%3D%3C%2Ftext%3E%3Ctext%20font-family%3D%22Arial%22%20font-size%3D%2216%22%20text-anchor%3D%22middle%22%20x%3D%22125.5%22%20y%3D%22145%22%3EFixed%3C%2Ftext%3E%3Ctext%20font-family%3D%22Arial%22%20font-size%3D%2216%22%20text-anchor%3D%22middle%22%20x%3D%22169.5%22%20y%3D%22145%22%3ECosts%3C%2Ftext%3E%3Ctext%20font-family%3D%22math17fc2f01a1f847f9077daadcbe9%22%20font-size%3D%2216%22%20text-anchor%3D%22middle%22%20x%3D%22201.5%22%20y%3D%22145%22%3E%2B%3C%2Ftext%3E%3Ctext%20font-family%3D%22Arial%22%20font-size%3D%2216%22%20text-anchor%3D%22middle%22%20x%3D%22231.5%22%20y%3D%22145%22%3ETotal%3C%2Ftext%3E%3Ctext%20font-family%3D%22Arial%22%20font-size%3D%2216%22%20text-anchor%3D%22middle%22%20x%3D%22282.5%22%20y%3D%22145%22%3EVariable%3C%2Ftext%3E%3Ctext%20font-family%3D%22Arial%22%20font-size%3D%2216%22%20text-anchor%3D%22middle%22%20x%3D%22336.5%22%20y%3D%22145%22%3ECosts%3C%2Ftext%3E%3Ctext%20font-family%3D%22math17fc2f01a1f847f9077daadcbe9%22%20font-size%3D%2216%22%20text-anchor%3D%22middle%22%20x%3D%228.5%22%20y%3D%22188%22%3E%3D%3C%2Ftext%3E%3Ctext%20font-family%3D%22Arial%22%20font-size%3D%2216%22%20text-anchor%3D%22middle%22%20x%3D%2227.5%22%20y%3D%22188%22%3E%26%23xA3%3B%3C%2Ftext%3E%3Ctext%20font-family%3D%22Arial%22%20font-size%3D%2216%22%20text-anchor%3D%22middle%22%20x%3D%2238.5%22%20y%3D%22188%22%3E8%3C%2Ftext%3E%3Ctext%20font-family%3D%22math17fc2f01a1f847f9077daadcbe9%22%20font-size%3D%2216%22%20text-anchor%3D%22middle%22%20x%3D%2245.5%22%20y%3D%22188%22%3E%2C%3C%2Ftext%3E%3Ctext%20font-family%3D%22Arial%22%20font-size%3D%2216%22%20text-anchor%3D%22middle%22%20x%3D%2261.5%22%20y%3D%22188%22%3E000%3C%2Ftext%3E%3Ctext%20font-family%3D%22math17fc2f01a1f847f9077daadcbe9%22%20font-size%3D%2216%22%20text-anchor%3D%22middle%22%20x%3D%2286.5%22%20y%3D%22188%22%3E%2B%3C%2Ftext%3E%3Ctext%20font-family%3D%22Arial%22%20font-size%3D%2216%22%20text-anchor%3D%22middle%22%20x%3D%22104.5%22%20y%3D%22188%22%3E%26%23xA3%3B%3C%2Ftext%3E%3Ctext%20font-family%3D%22Arial%22%20font-size%3D%2216%22%20text-anchor%3D%22middle%22%20x%3D%22115.5%22%20y%3D%22188%22%3E3%3C%2Ftext%3E%3Ctext%20font-family%3D%22math17fc2f01a1f847f9077daadcbe9%22%20font-size%3D%2216%22%20text-anchor%3D%22middle%22%20x%3D%22122.5%22%20y%3D%22188%22%3E%2C%3C%2Ftext%3E%3Ctext%20font-family%3D%22Arial%22%20font-size%3D%2216%22%20text-anchor%3D%22middle%22%20x%3D%22138.5%22%20y%3D%22188%22%3E800%3C%2Ftext%3E%3Ctext%20font-family%3D%22math17fc2f01a1f847f9077daadcbe9%22%20font-size%3D%2216%22%20text-anchor%3D%22middle%22%20x%3D%228.5%22%20y%3D%22231%22%3E%3D%3C%2Ftext%3E%3Ctext%20font-family%3D%22Arial%22%20font-size%3D%2216%22%20text-anchor%3D%22middle%22%20x%3D%2227.5%22%20y%3D%22231%22%3E%26%23xA3%3B%3C%2Ftext%3E%3Ctext%20font-family%3D%22Arial%22%20font-size%3D%2216%22%20text-anchor%3D%22middle%22%20x%3D%2243.5%22%20y%3D%22231%22%3E11%3C%2Ftext%3E%3Ctext%20font-family%3D%22math17fc2f01a1f847f9077daadcbe9%22%20font-size%3D%2216%22%20text-anchor%3D%22middle%22%20x%3D%2254.5%22%20y%3D%22231%22%3E%2C%3C%2Ftext%3E%3Ctext%20font-family%3D%22Arial%22%20font-size%3D%2216%22%20text-anchor%3D%22middle%22%20x%3D%2270.5%22%20y%3D%22231%22%3E800%3C%2Ftext%3E%3C%2Fsvg%3E)
-
- In the chart, the total costs line slopes upwards because total variable costs increase as output increases
- Revenue is the quantity sold x selling price
Revenue at Different Levels of Output
| Units |
0 |
100 |
200 |
300 |
400 |
500 |
Revenue (£)
|
0 |
3,200 |
6,400 |
9,600 |
12,800 |
16,000 |
- The revenue line also slopes upwards
- At 0 units of output, the revenue is £0
- At 500 units the total revenue equates to £16,000
- Revenue increases with output
- The line will slope more steeply than the total costs and will cross the total costs line at some point
- The point at which the total costs and the revenue lines cross is the break-even point
- The break-even level of output is 328 units
- The margin of safety can be identified as the difference on the x-axis between the actual level of output (in this case, 450 units) and the break-even point
- The margin of safety is 450 - 328 = 122 units
- The profit made at a specific level of output can be identified as the space between the revenue and total costs lines
- In this instance, the profit made at 450 units of output is £14,400 - £11,420 = £2,980


