Introduction to Quantitative Sales Forecasting
- The sales forecast is an important business planning tool
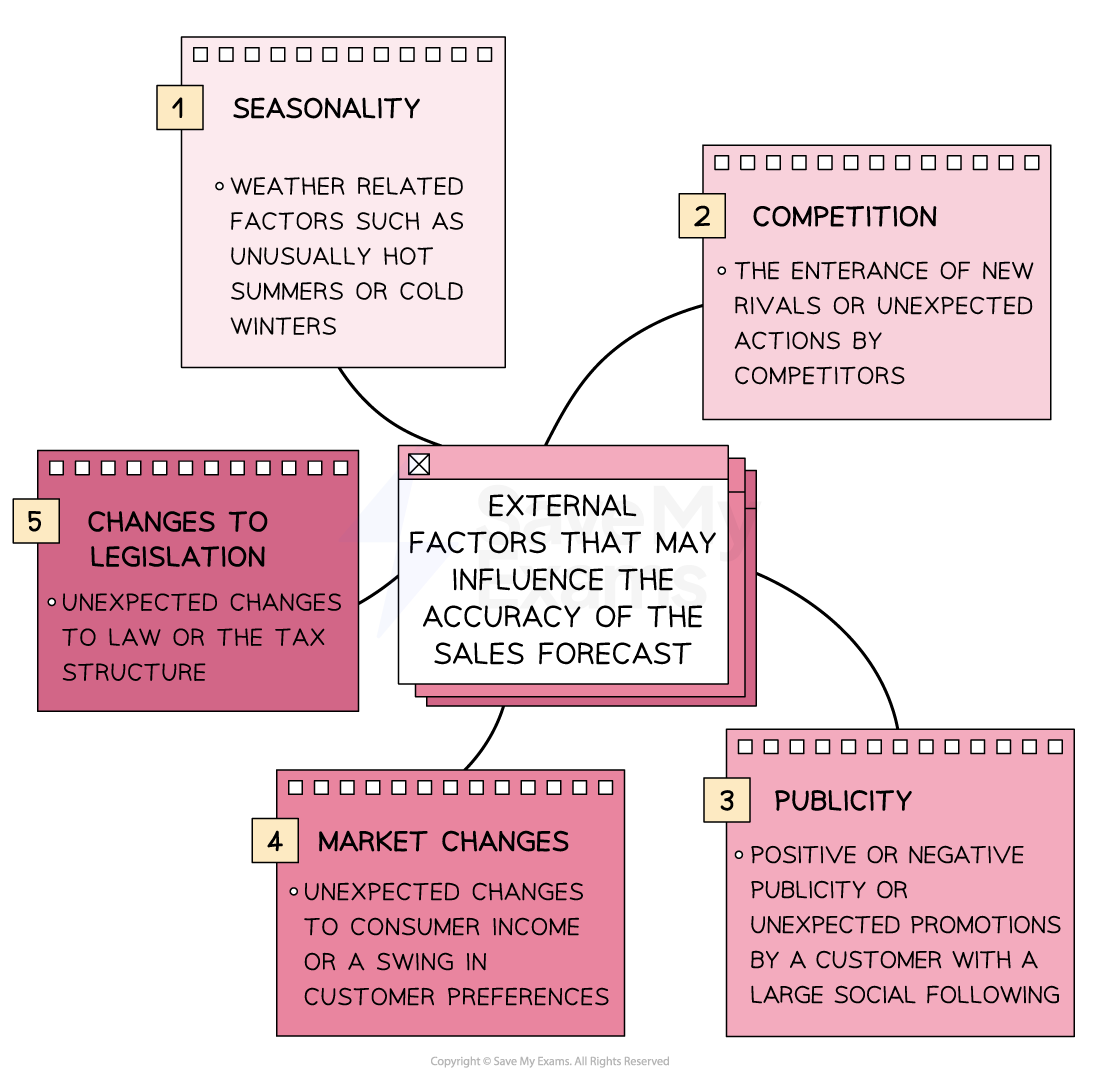
- It provides an estimation of future sales figures using past data and considering predictable external factors
- It provides an estimation of future sales figures using past data and considering predictable external factors
- Sales forecasts can be used to identify trends in product sales which can then be compared with the market as a whole
Main Methods used in Quantitative Sales Forecasting
|
|
|
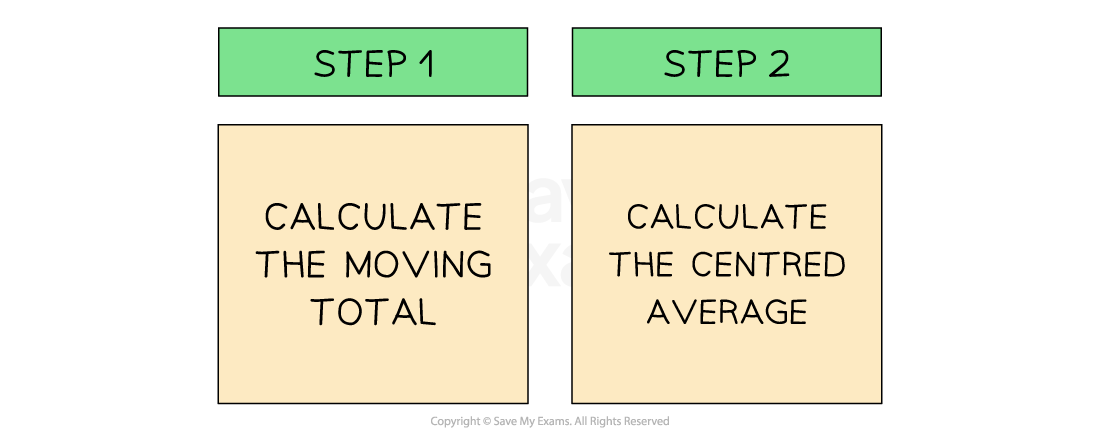
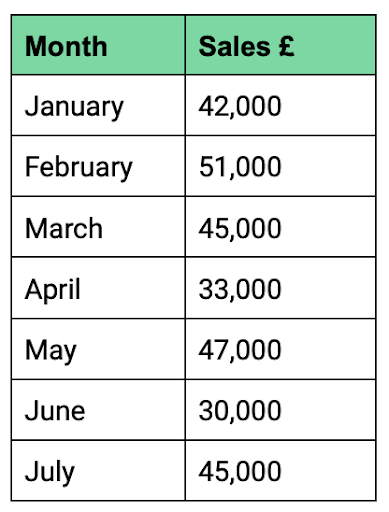
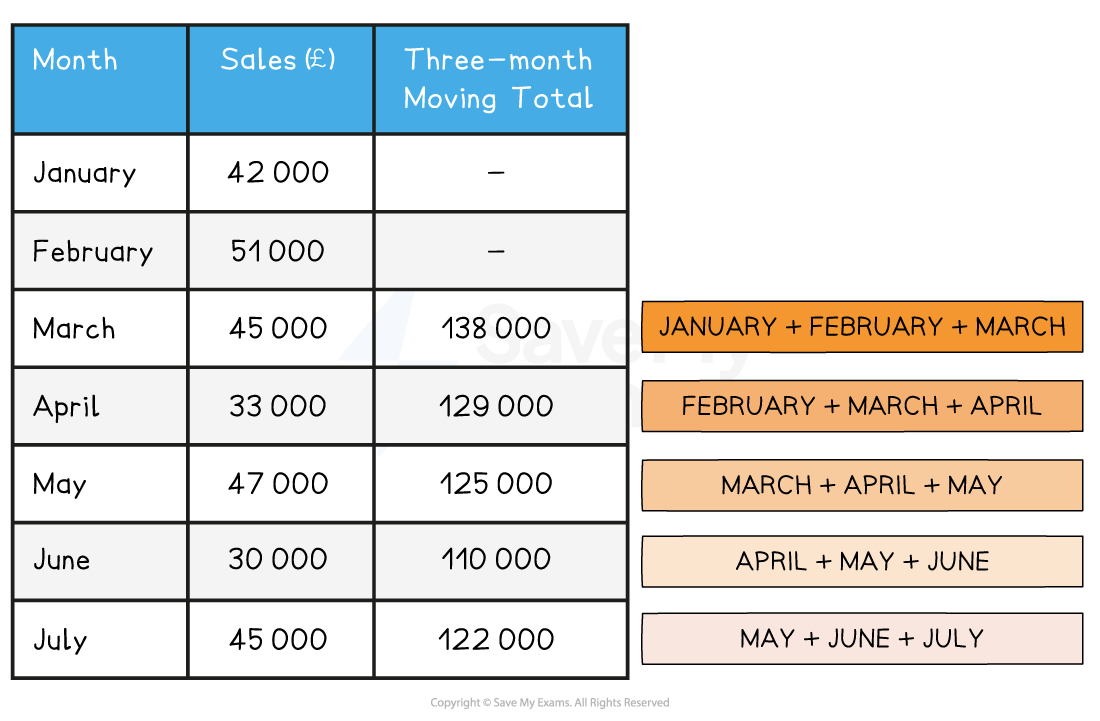
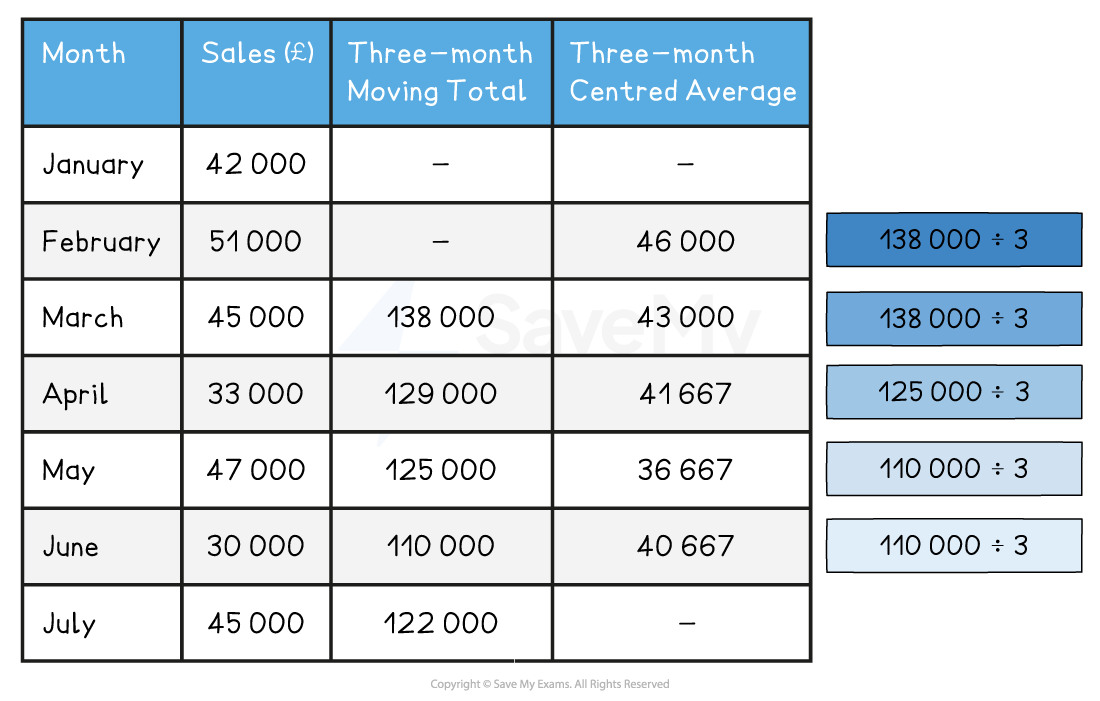
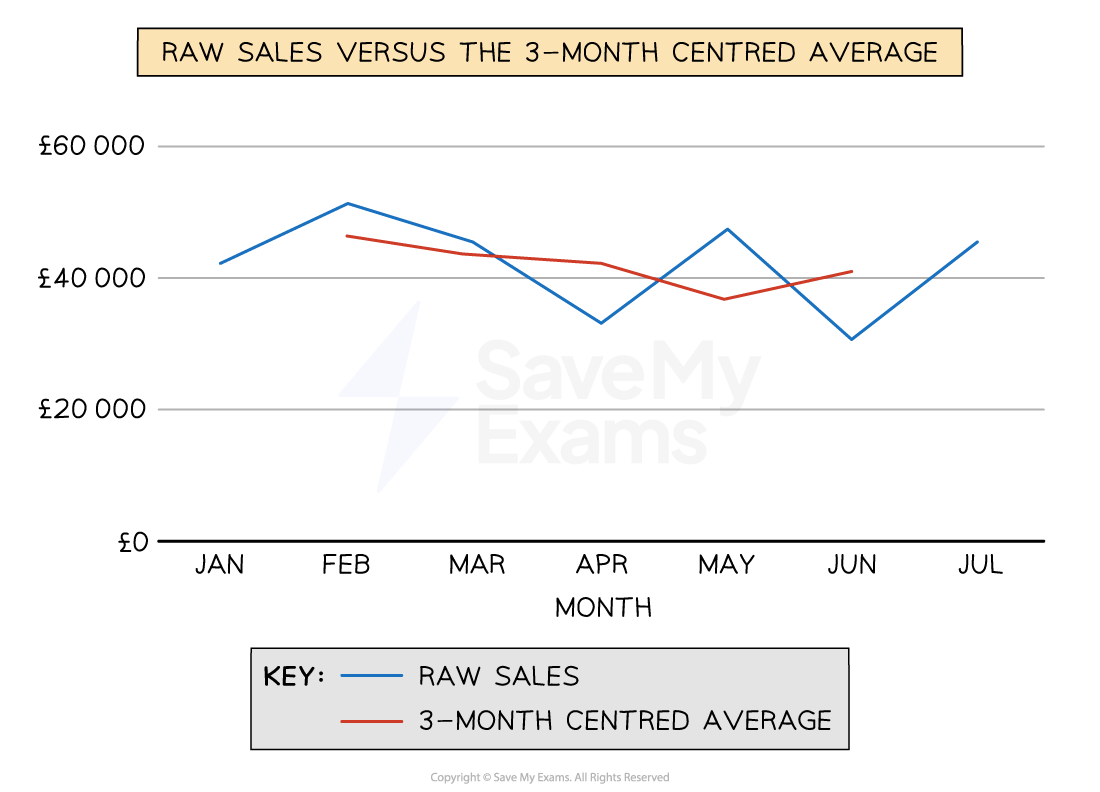
Moving Averages |
|
Extrapolation |
|
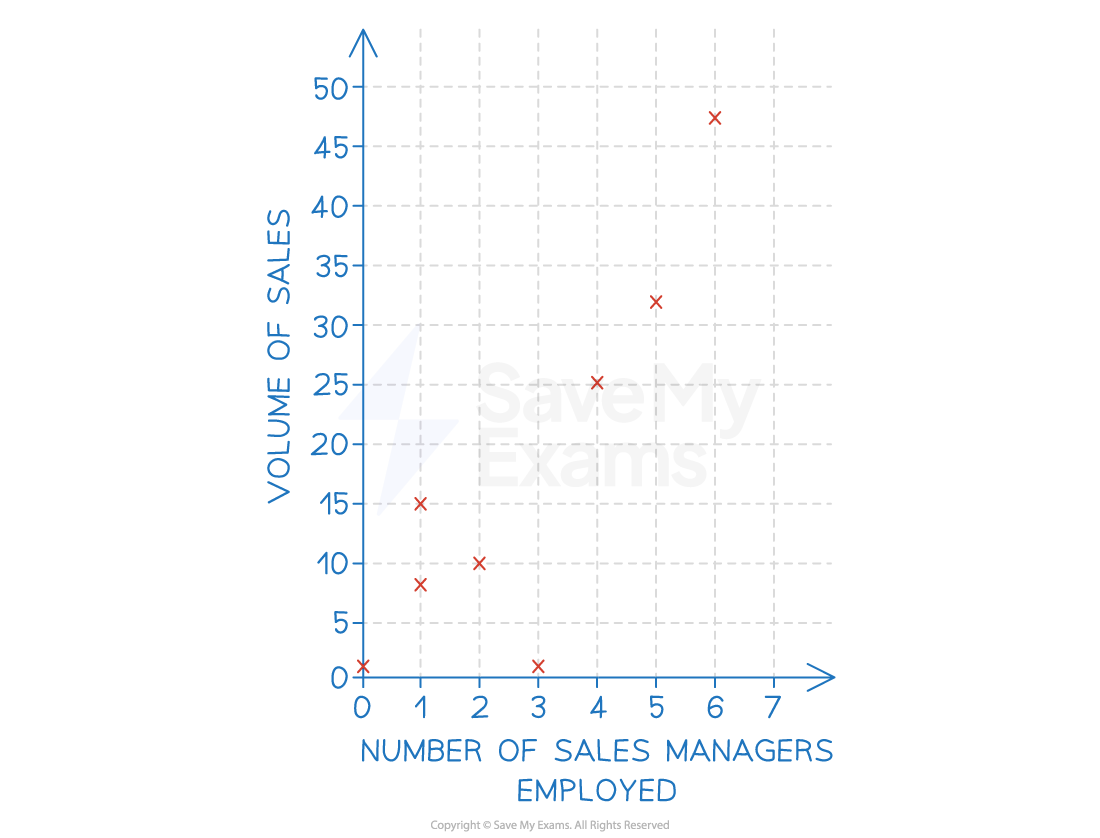
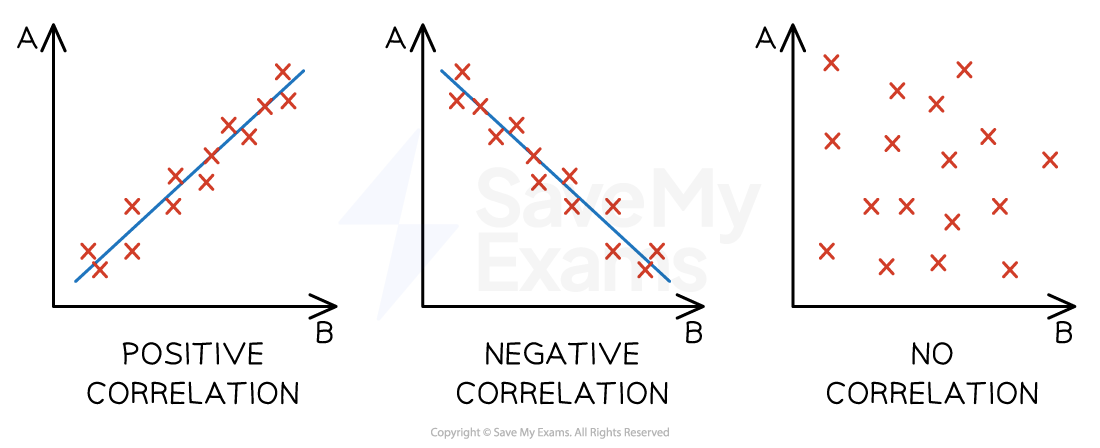
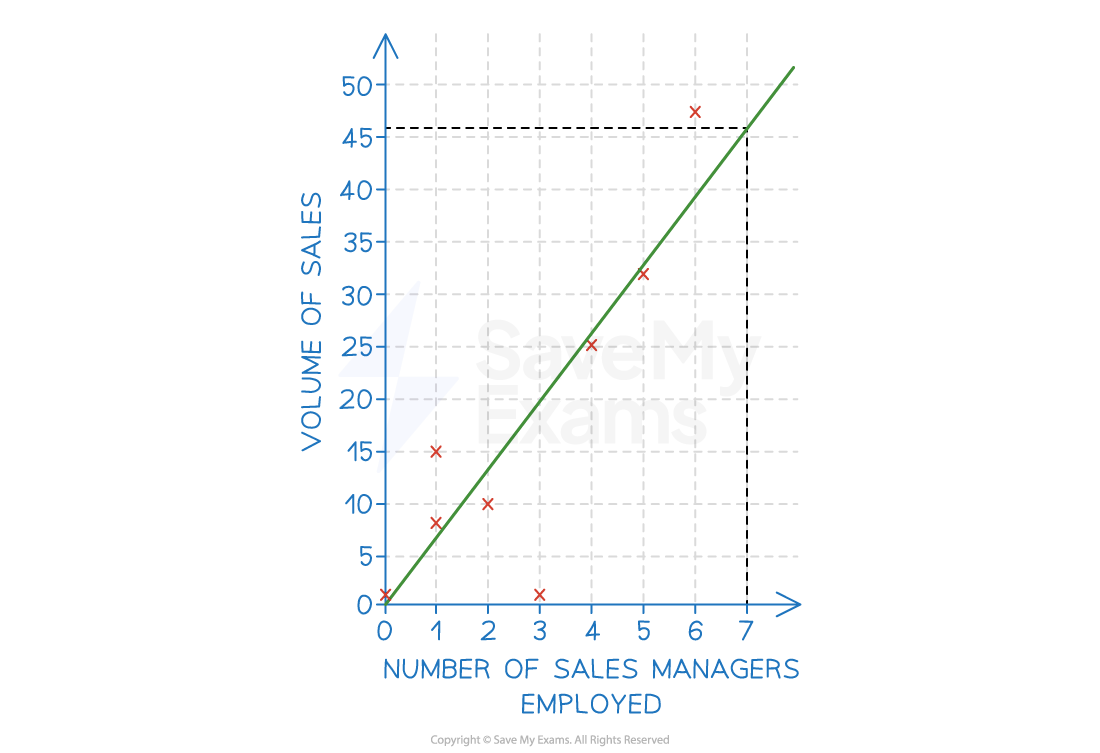
Correlation |
|