Water Uses, Demand & Supply (Edexcel IGCSE Geography)

Revision Note

Test Yourself
Bridgette

Author

Bridgette

Expertise

Geography Lead

Water Uses

  • Only 2.5% of the water on Earth is freshwater
  • 68.7% of freshwater is stored in glaciers and ice sheets and 30% is groundwater
  • The remaining 1.3% of freshwater is in rivers, soil moisture, lakes and the atmosphere

sources-of-water

Sources of water

  • Global water use by sector is: 
    • 70% agriculture - irrigation of crops and water for livestock
    • 20% industry - producing goods and generating energy
    • 10% domestic - toilets, cooking, cleaning, washing
  • The use by sector varies across countries depending on whether they are developed, emerging or developing
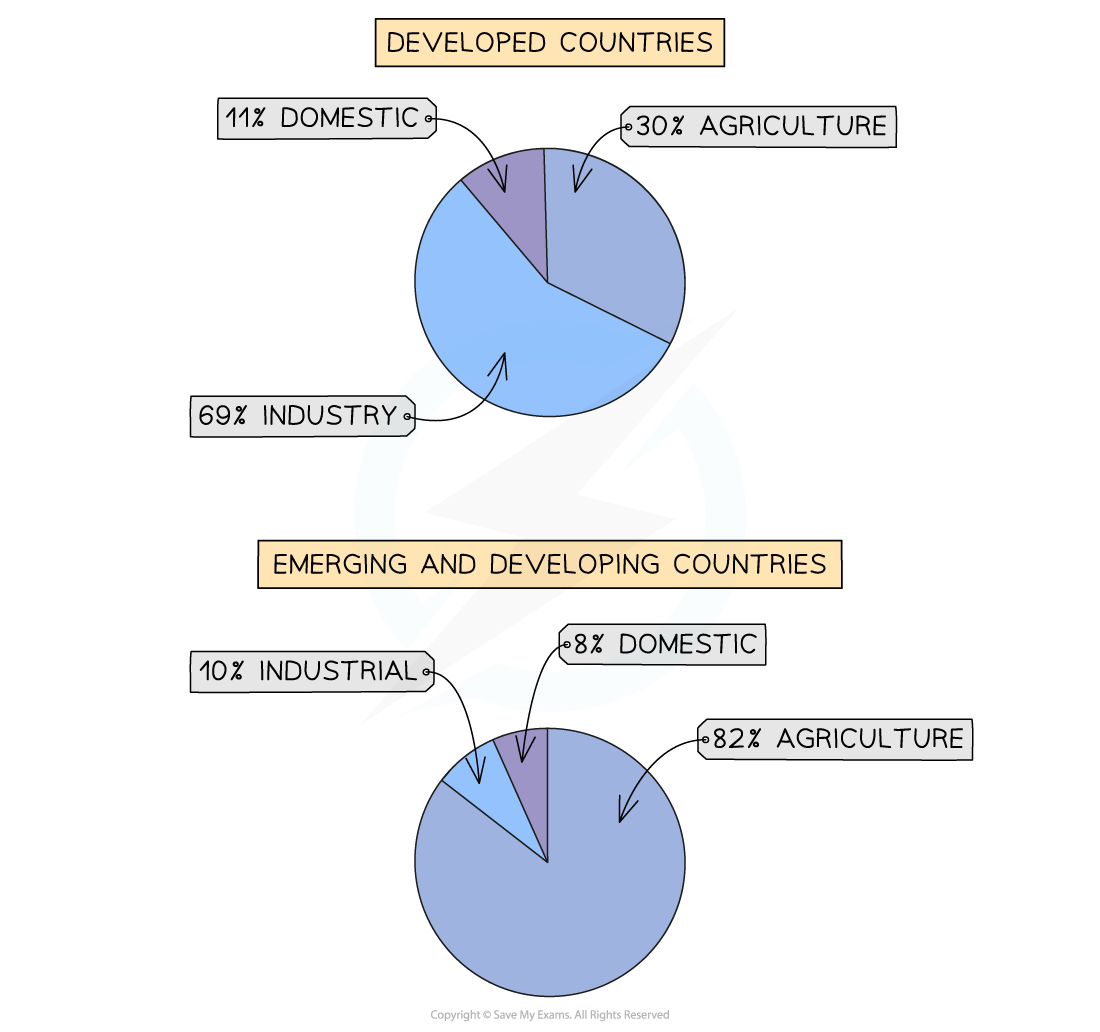
water-use in Developed and developing countries

Water Use 

  • In developing and emerging countries most water is used for agriculture
  • The use of water in leisure and tourism is increasing, particularly in developed countries
  • In developed countries most water is used for industry

Rising Demand for & Supply of Water

  • Demand is the amount of water requested by users to meet their needs
  • Supply is the amount of water available
  • Water balance is the difference between supply and demand
  • Countries may have a deficit (greater demand than supply) or surplus (more supply than demand)

Water Demand

  • The global demand for water is increasing
  • Between 1934 and 2014 demand increased from 1 trillion mto 4 trillion m3

global-water-useage

Water Supply

  • The supply of water comes from three main sources:
    • Lakes and rivers
    • Aquifers
    • Reservoir
  • The reasons for increased demand include:
    • Improving living standards - people have more appliances/sanitation which use water
    • Increased use of water in leisure and tourism - water parks, golf courses
    • Increased urbanisation 
    • Population growth - the more people there are, the more water is needed
    • Increasing industry - water is needed for the production of goods and energy production
    • Increasing use in agriculture - more water is needed for livestock

Exam Tip

Remember when interpreting at graphs you need to 

  • Identify the overall trend - is it increasing/decreasing/fluctuating
  • Identify the highest and lowest points
  • In any answer based on a graph make sure that you include figures

Areas of Water Shortages & Surpluses

Water Shortages (Deficit)

  • Many areas of the world have water shortages (deficits)
  • Water deficit can be due to:
    • Low supply - lack of precipitation, high levels of evaporation, poor water management
    • High demand - increasing population, industry and agriculture
    • A combination of low supply and high demand
  • Areas with the greatest water-deficit include:
    • Australia
    • North, East and South Africa
    • Middle East
    • West USA
    • Parts of South America 
    • India

Global water-deficit and surplus

Water surplus and deficit

  • Many of these areas have a deficit due to low precipitation throughout the year 
  • In some areas demand is greater than supply due to increasing population, industry and agriculture
  • There are different levels of water shortage - these are water stress and water scarcity:
    • Water stress occurs when the supply of water is below 1700m3 a year per person
    • Water scarcity is when the supply is below 1000m3 a year per person

Water Surplus

  • Some areas of the world have a water surplus 
  • Water surplus can be due to:
    • High supply - high precipitation, low evaporation rates, effective water management
    • Low demand - low population, effective water management, low temperatures
    • A combination of high supply and low demand
  • Areas with a surplus include:
    • North-east Brazil in the Amazon rainforest
    • Canada and parts of the northern USA
    • Russia

Exam Tip

Remember when interpreting maps you need to pay close attention to the key and title. 

In the above example the map shows both surplus and deficit of water supply on a sliding scale. Areas of greatest water surplus are dark blue and areas of greatest water deficit are dark orange.

You've read 0 of your 0 free revision notes

Get unlimited access

to absolutely everything:

  • Downloadable PDFs
  • Unlimited Revision Notes
  • Topic Questions
  • Past Papers
  • Model Answers
  • Videos (Maths and Science)

Join the 100,000+ Students that ❤️ Save My Exams

the (exam) results speak for themselves:

Did this page help you?

Bridgette

Author: Bridgette

After graduating with a degree in Geography, Bridgette completed a PGCE over 25 years ago. She later gained an MA Learning, Technology and Education from the University of Nottingham focussing on online learning. At a time when the study of geography has never been more important, Bridgette is passionate about creating content which supports students in achieving their potential in geography and builds their confidence.