
River Regimes & Storm Hydrographs
River regimes
- The discharge of a river changes over time
- The river regime is a record of these changes over the period of a year
- Many factors can influence the river regime as outlined in the table below
Storm hydrographs
- A storm hydrograph shows the changes in river discharge after a storm event
- The graph shows a short period of time, usually 24 hours
- The storm hydrograph has a number of features:
- Base flow
- Peak rainfall
- Rising limb
- Peak discharge
- Lag time
- Recessional limb
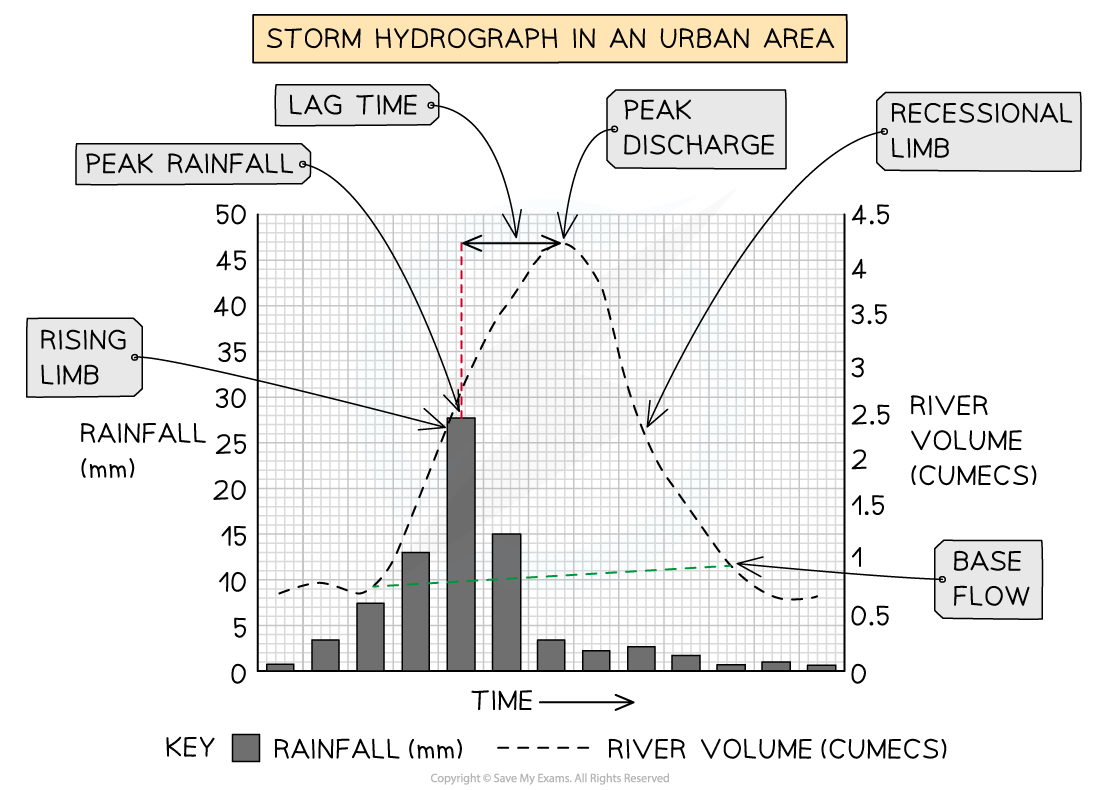
Storm hydrograph in an urban area
Worked example
Study Figure 1 which shows storm hydrographs for rivers A and B

River A River B
Figure 1 Storm Hydrographs
What is the lag time for river A? (1)
- To work out the answer you need to calculate the difference between the peak rainfall and peak discharge:
- The peak rainfall is between 2 and 3 hours from the start of the storm, taken at the mid point this would be 2 hours and 30 minutes.
- The peak discharge is at 8 hours from the start of the storm
- 8 hours - 2 hours and 30 mins = 5 hours and 30 mins
Answer
Lag time = 5 hours and 30 mins (1)
Exam Tip
Remember a hydrograph shows the changes in discharge over a short period after a storm event, whereas the river regime shows changes in discharge over a long period, usually a year.
