Extreme Weather Conditions (OCR GCSE Geography)

Revision Note

Test Yourself
Jacque Cartwright

Expertise

Geography Content Creator

Distribution & Frequency of Tropical Storms

  • The distribution of tropical storms is consistent, however, their frequency varies
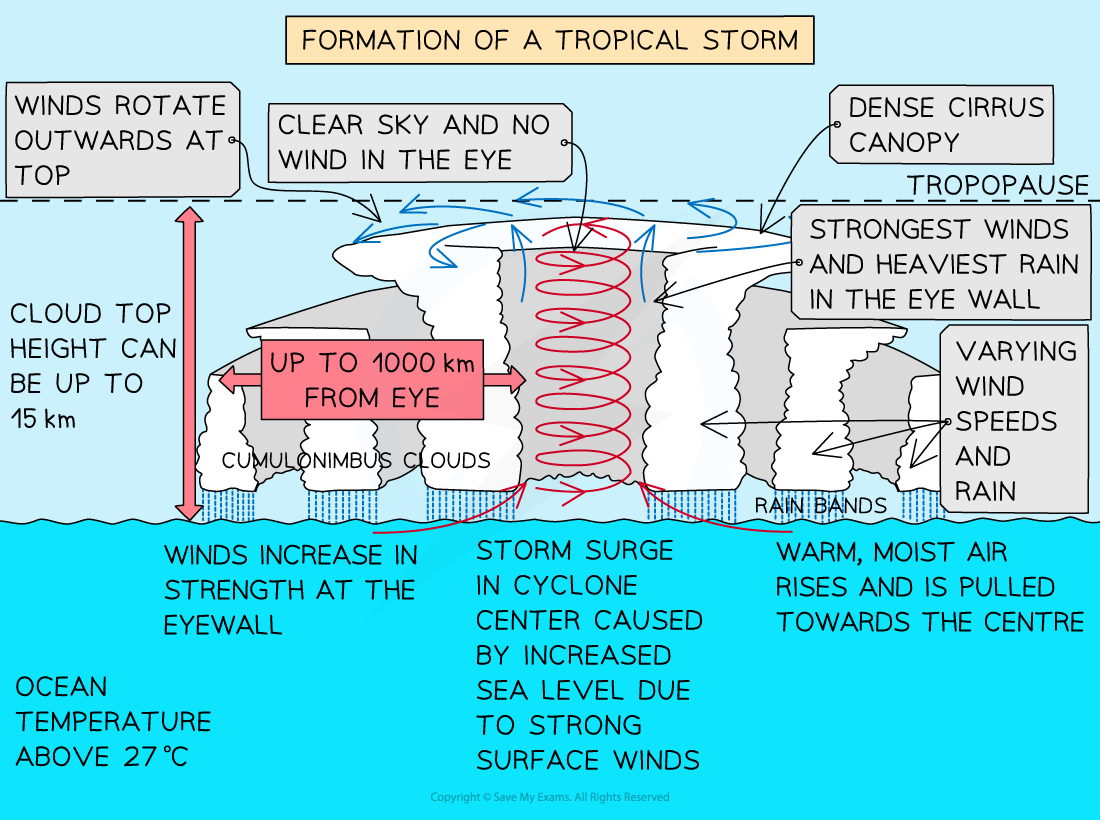
  • Tropical storms are rotating, intense low-pressure systems (below 950mb)
  • They are also known as:
    • Typhoons in the South China Sea and west Pacific Ocean
    • Hurricanes in the Gulf of Mexico, Caribbean Sea and west coast of Mexico
    • Cyclones in the Bay of Bengal, Indian Ocean and northern Australia
  • Depending on their wind speed, they are bas:
    • Tropical depression - wind speeds of less than 62 km/h (38 mph)
    • Tropical storm - wind speeds ranging from 63 - 118 km/h (39 - 73 mph)
    • Tropical cyclone with wind speeds above 119 km/h (74 mph)

Map Showing the Global Distribution of Tropical Storms

Map Showing the Global Distribution of Tropical Storms

Distribution

  • They develop over the warm tropical oceans usually between 5° and 15° north and south of the equator, although they can extend to as high as 30°
  • Ocean temperatures must be in excess of 27°C and to a depth of 50-60 metres
  • At least 500 km from the equator in order for the Coriolis force/effect to spin the tropical storm

Frequency

  • Depends on where and which hemisphere, but on average over 80 tropical storms are generated by tropical oceans every year
  • Tropical storms begin when tropical oceans are at their warmest, which is usually late summer (Nov-April southern hemisphere and June-Nov northern hemisphere)
  • The Pacific Ocean sees the largest number of tropical storms, followed by the Indian Ocean, and lastly the Atlantic
  • Tropical storms in the western Pacific are the strongest 

Average Frequency of Tropical Storms

Place Months Frequency / Average
South Atlantic August - October 9+
North-east Pacific June - October 13+
North-west Pacific June - December 26+
North Indian Ocean June - November 2
Bay of Bengal June - November 6+
South-west Indian Ocean January - March 9+
South Pacific January - March 7+

Changes in frequency

  • Although the number of Atlantic storms has increased, the overall global frequency remains steady
  • However, tropical storm intensity has increased by 70% over the last 30 years
  • El Niño cycles increase wind strength high over the Atlantic, which has the effect of decreasing storm activity overall (winds are too strong and will tear through developing storms above the ocean surface)
  • Global warming has the potential of increasing the frequency, distribution and intensity of tropical storms in the future

Exam Tip

Make sure you know facts and figure on the distribution and frequency of tropical storms. As warming of our oceans continue, it is probable that tropical storms will be seen at higher latitudes than in the past. This is because there will be more energy available for storms to travel further.

Distribution & Frequency of Droughts

  • Droughts are an extended period of time when there is below average rainfall
  • It varies from place to place and has a negative effect on vegetation, animals, and people 
  • Water supplies such as lake, aquifers and rivers become depleted as people continue to abstract water during a drought
  • Droughts are often accompanied by high temperatures, which increases the rate of evaporation, depleting water supplies faster
  • Length of a drought varies from place to place:
    • UK suffered a drought for 16 months between 1975 and 1976
    • In any given year, 14% of the USA is in a drought 
    • Horn of Africa is experiencing its worst drought in 40 years

Causes of drought

  • Changes in atmospheric circulation can reduce the amount of precipitation to an area 
    • An El Niño cycle will bring droughts to Indonesia and Australia
    • Annual monsoon rains can fail - India relies on the monsoon rains for water
  • High pressure weather systems bring high temperatures which increases evaporation rates, but also block weather depressions of rain bearing clouds

Frequency and distribution of droughts

  • Whilst the frequency of droughts hasn't changed much, the distribution has
  • Areas most at risk are Australia, Middle East, central and southern Africa, parts of North America and eastern South America
  • Since the 20th century, more droughts have been seen in Africa, Asia and the Mediterranean
  • Most areas affected by drought, already fringe desert regions and are at risk of longer drought situations
  • Droughts may become more frequent and more severe in the future with global warming

Causes of Tropical Storms

  • The causes of tropical storms are related to the Hadley cell, the Coriolis effect and equatorial trade winds:
    • The equatorial regions receive intense solar heating raising ocean temperatures 
    • This warm, moist air rises, leading to an intense low-pressure zone between the two Hadley cells - also known as the Intertropical Convergence Zone or ITCZ 
    • This generates thunderstorms, strong winds and intense rainfall at the surface
      • These are typical weather conditions at the rising arm of the Hadley cell
      • Dry air descends creating a high-pressure zone at the surface
      • This generates a pressure gradients and air rushes to the low-pressure zone generating the winds of the forming tropical storm

    • The (trade) winds move in a westerly direction from the equator 
    • Where the Coriolis effect starts the air spinning from 5° north and south of the equator
      • The effect is too weak at the equator to move the air
      • The spin is anti-clockwise (anticyclone) in the northern hemisphere but clockwise (cyclone) in the southern hemisphere as they are low-pressure systems
    • The greater the low-pressure, the greater the winds, the greater the spin and the larger the tropical storm becomes

Diagram Detailing the Relationship Between Atmosphere and Tropical Storms

Relationship between air circulation and tropical storms

  • Sea temperatures must be 27°C and above to allow warm air to rise quickly, causing an area of intense low pressure
  • They only form between 5° and 30° north and south of the equator (warmest waters are found here)
  • The rising air draws further moist, warm air up from the ocean's surface, generating stronger winds
  • The air spirals upwards, cools, condenses and forms large cumulonimbus clouds 
  • These clouds form the eye wall of the storm and produce heavy rainfall
  • Cold air sinks at the centre creating a calm, dry area known as the eye of the storm
  • Tropical storms will die out if the heat energy and moisture from the ocean are no longer available to drive the storm
  • Tropical storms can vary in diameter (100-1000km) 
  • Winds spiral rapidly around a calm central area known as the eye, with descending cold air, low pressure, light winds, no clouds or rain
  • The winds of the storm are not constant across its diameter
    • The outer edges of the storm have lighter wind speeds, smaller and more scattered clouds, rain is less intense, and the temperatures begin to increase
    • The strongest and most destructive winds are found within the eyewall, with spiralling storm clouds, torrential rainfall and low temperatures 
  • Tropical storms are rated on the five-point Saffir-Simpson scale based on wind speeds
  • Tropical storms are considered major when they reach category 3 and have wind speeds between 111-129 miles (178-208 kilometres) per hour
  • A category 5 storm can deliver wind speeds of more than 157 miles (252km) an hour

Image Showing the Formation and Movement of a Tropical Storm

Image Showing the Formation and Movement of a Tropical Storm

Causes of El Niño & La Niña

  • El Niño & La Niña are climatic events in the Pacific Ocean and together are called the El Niño Southern Oscillation or ENSO

El Niño Southern Oscillation (ENSO)

  • The ENSO cycle is the change in the movement of warm water mass in the equatorial region of the Pacific Ocean
  • It happens due to a combination of changes between:
    • The trade winds
    • Atmospheric circulation
    • Ocean currents
  • There are three phases:
    • El Niño
    • La Niña
    • Normal/neutral
  • An ENSO cycle changes global atmospheric circulation, which in turn, affects global temperatures and rates of global precipitation
  • El Niño phases occur more frequently than La Niña 
  • As of September 2023, it is officially an El Niño phase

Causes of El Niño 

  • In a neutral/normal year, air descends over the eastern Pacific, with rising, warm, moist air over the western Pacific 
  • An El Niño event occurs when sea temperatures reach 0.5°C above average
  • The low-level 'easterly trade winds' weaken or in some instances, reverse (go west to east)

Effects of El Niño

  • Reduction or reversal of the winds lead to warmer than average weather in central and eastern Pacific (rising warm air over eastern Pacific and cool, descending air over western Pacific)
  • Precipitation reduces over Indonesia, but increases over the tropical Pacific Ocean
  • The peak is usually in December
  • It occurs every 2-7 years
  • The temperature of the ocean off the coast of Peru rises an average of 6-8°C causing thermal expansion and sea level rise of 30cm, with rising air and low pressure producing more precipitation than normal
  • Water off the coast of Australia and Indonesia is cooler and precipitation is reduced leading to high pressure and stable, dry or drought conditions in Australia

Diagram showing normal/neutral and El Niño oceanic conditions

Diagram showing normal and El Niño oceanic conditions

El Niño

Causes of La Niña 

  • La Niña occurs when sea temperatures fall below average
  • This brings cooler and drier than average weather in the eastern Pacific
  • La Niña occurs every 3-5 years to counteract El Niño

Effects of La Niña 

  • Stronger than usual 'easterly trade winds' and ocean currents
  • Increased precipitation over Indonesia and decreasing rainfall over central tropical Pacific Ocean 
  • Cold water is brought to the ocean surface through upwelling

Diagram showing normal and La Niña oceanic conditions

Diagram showing normal and La Niña oceanic conditions

  • Both El Niño and La Niña impact global climate due to the changes they cause in the high atmosphere
  • El Niño has the most significant impacts with:
    • Increased rainfall and flooding in South America, Africa and the south of the US
    • Drought in Australia and Southeast Asia
    • Has been linked to a higher risk of colder winters in the UK
  • La Niña leads to:
    • Increased rainfall in Australia and Southeast Asia 
    • Drought conditions in the south of the US
    • Increased risk of tropical storms in the Atlantic

You've read 0 of your 0 free revision notes

Get unlimited access

to absolutely everything:

  • Downloadable PDFs
  • Unlimited Revision Notes
  • Topic Questions
  • Past Papers
  • Model Answers
  • Videos (Maths and Science)

Join the 100,000+ Students that ❤️ Save My Exams

the (exam) results speak for themselves:

Did this page help you?

Jacque Cartwright

Author: Jacque Cartwright

Jacque graduated from the Open University with a BSc in Environmental Science and Geography before doing her PGCE with the University of St David’s, Swansea. Teaching is her passion and has taught across a wide range of specifications – GCSE/IGCSE and IB but particularly loves teaching the A-level Geography. For the last 5 years Jacque has been teaching online for international schools, and she knows what is needed to pass those pesky geography exams.