Indirect Taxes
- An indirect tax is paid on the consumption of goods/services
- It is only paid if consumers make a purchase
- It is usually levied by the government on demerit goods to reduce the quantity demanded (QD) and/or to raise government revenue
- Government revenue is used to fund government provision of goods/services e.g education
- Indirect taxes can occur as a specific or ad valorem tax
- They are levied by the government on producers. This is why the supply curve shifts
- They are levied by the government on producers. This is why the supply curve shifts
- Producers and consumers each pay a share (incidence) of the tax
The Incidence of a Specific Tax
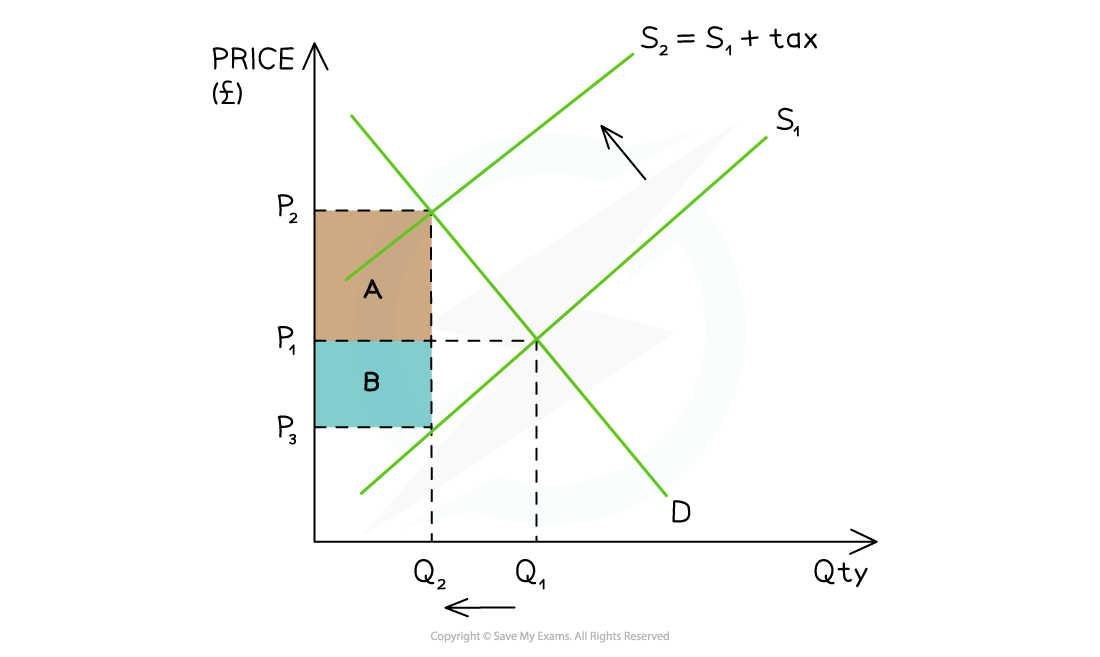
A diagram that demonstrates the share of a specific tax paid by the consumer (A)
and the producer (B)
Diagram Analysis
- The government places a specific tax on a demerit good
- The supply curve shifts left from S1→S2 by the amount of the tax
- The price the consumer pays has increased from P1 before the tax, to P2 after the tax
- The price the producer receives has decreased from P1 before the tax to P3 after the tax
- The government receives tax revenue = (P2-P3) x Q2
- The consumer incidence (share) of the tax is equal to area A - (P2-P1) x Q2
- The producer incidence (share) of the tax is equal to area B - (P1-P3) x Q2
- The QD in this market has decreased from Q1→Q2
- If the decrease in QD is significant enough, it may force producers to lay off some workers
Exam Tip
When drawing this diagram, students often find it hard to identify the three price points.
The tax incidence boxes are formed by drawing the new equilibrium quantity through the original supply curve. The three price points are the old equilibrium point, new equilibrium point - and where the new quantity crosses the original supply curve.
Irrespective if you are dealing with taxes or subsidies, always use the new equilibrium point to determine your incidence boxes.
The consumer incidence is paid from the consumer surplus area and the producer incidence is paid from the producer surplus area.
A Side by Side Comparison of The Impact of PED on Tax Incidence
- Aiming to maximise their profits, producers pass on as much of the indirect tax as they can to consumers and pay the balance themselves
- The amount passed on to consumers depends on the price elasticity of demand (PED) of the product

A diagram that demonstrates the tax incidence for a product whose PED is inelastic (left) and elastic (right). A is the consumer incidence and B is the producer incidence
Diagram Analysis
- In both diagrams, the specific tax shifts the supply curve from S1→S2
- There is a higher market price at P2 and lower QD at Q2
- Tax revenue for the government is the sum of A+B
- Consumer incidence is represented by A and producer incidence by B
- Total revenue for the seller is calculated using P3 X Q2
- The difference in PED results in a different steepness to the demand curve
- For an inelastic product (e.g., cigarettes), producers pass on a much higher proportion of the tax to consumers (A) and pay the rest themselves (B)
- The QD decreases (Q1→Q2) but by a much smaller proportion than the increase in price (P1→P2)
- For an elastic product (e.g., pizza), producers pass on a much smaller proportion of the tax to consumers (A) and pay the rest themselves (B)
- The QD decreases (Q1→Q2) but by a much larger proportion than the increase in price (P1→P2)
- For an inelastic product (e.g., cigarettes), producers pass on a much higher proportion of the tax to consumers (A) and pay the rest themselves (B)
Exam Tip
When asked to evaluate the impact of a tax in a particular market, it is essential to apply knowledge of PED to the impact it will have on producers, consumers and the government.
It should be obvious from the context if the product in the question is elastic or inelastic in demand. If not, work through the factors that determine PED and make a judgement as to whether the product is elastic or inelastic in demand. In your answer, explain your reasoning.


