
Population Pyramids
- The characteristics of a population, the distribution of age, sex, ethnicity, religion etc, is known as the population structure
- It is the result of changes in:
- fertility
- mortality
- migration
- The two main components of age and sex can be shown on a population pyramid
Population pyramids
- Population pyramids (also known as an age structure graph) are used to display the gender and age structure of a given population
- They illustrate the distribution of the population across age groups and between male/female
- They enable governments nationally and regionally to assess the needs of the population for services such as healthcare and education
- This means the governments can estimate and plan for spending
- As countries develop and pass through the stages of demographic transition the shape of the population pyramid changes
- The population pyramid can be used to identify the following groups:
- Young dependents
- Old dependents
- Economically active (working population)
- Dependency ratio
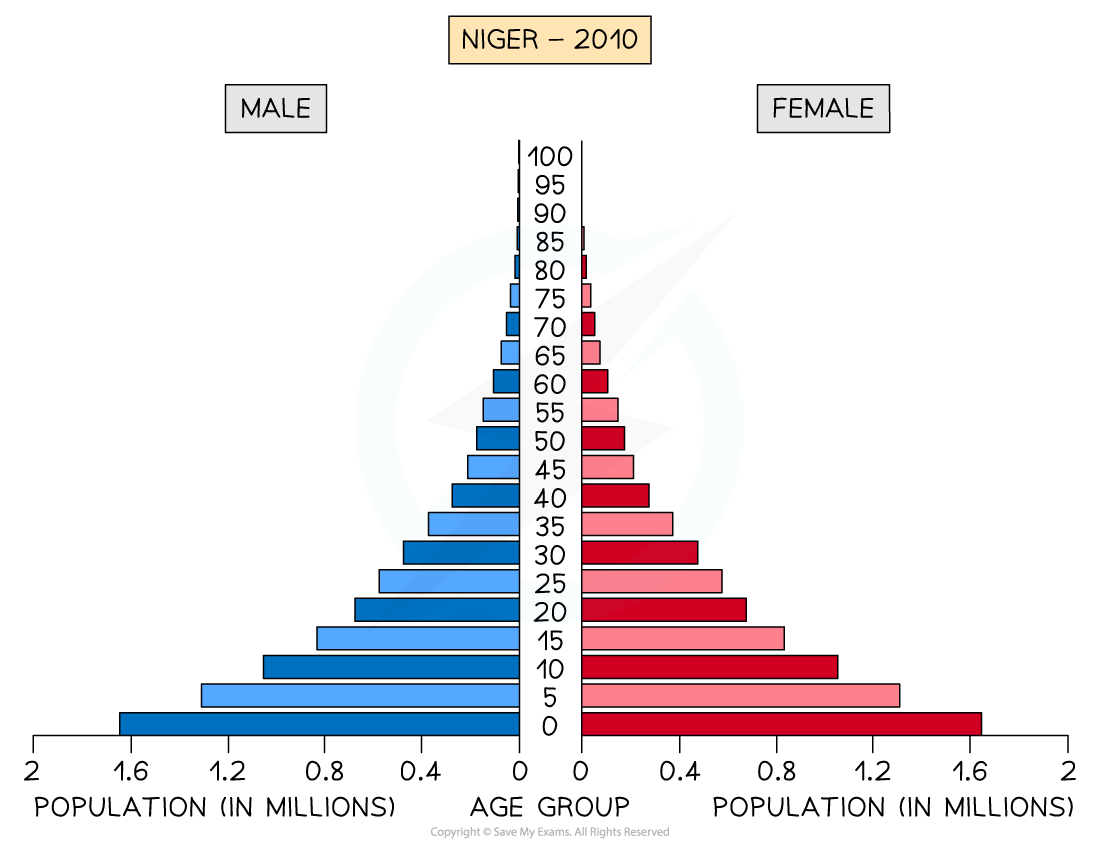
Population Pyramid - Niger
- LEDCs like Niger have a concave pyramid shape
- At the start of stage 2 of the demographic transition model
- This indicates:
- High birth rate
- Low life expectancy
- High death rate but starting to decrease
- High infant mortality rate
- Young dependent population dominates

Population Pyramid - Nepal
- LEDCs/NICs that are a little further along the demographic transition such as Nepal has a convex pyramid shape
- Stage 3 of the demographic transition model
- This indicates:
- Decreasing birth rate
- Increasing life expectancy
- Decreasing death rate
- Decreasing infant mortality
- Larger working age population

Population Pyramid - USA
- HIC countries such as the USA have a column shape
- Stage 4 of the demographic transition model
- This indicates:
- Decreasing birth rate
- Increasing life expectancy
- Decreasing death rate
- Low infant mortality
- Larger working age population

Population Pyramid - Japan
- HIC countries such as Japan have a pentagon shape with a narrowing base
- Stage 5 of the demographic transition model
- This indicates:
- Decreasing birth rate
- Increasing life expectancy
- Death rate is higher than the birth rate due to the ageing population
- Low infant mortality
- Ageing population - older dependent population
Implications of population structure
- Population pyramids mean that population issues can be identified
- There are a range of issues including:
- Ageing populations
- Falling birth rates
- Impacts of migration
Ageing populations
- Many HICs are experiencing ageing populations and an increase in the older dependent population, the implications of this include increased:
- Pension payments
- Need for care homes
- Pressure on the healthcare service and social care
- It also results in fewer workers which means:
- Governments are not able to collect as much tax
- Some areas suffer worker shortages
Falling birth rates
- Countries experiencing falling birth rates include many HICs and MICs, the implications of this include:
- School closures due to fewer children
- Future workforce shortages
Migration
- In some countries, migration can lead to an imbalance in the population structure
- The UAE has significantly more males than females
- 29% of the population are males between the ages of 25 and 39 whereas only 10.5% of the population are women 25-39
- This is the result of the migration of males to the UAE to work in the oil, gas and construction industries
- Rapid population growth in some areas as a result of migration can lead to:
- Increased pressure on services such as healthcare and schools
- A shortage of housing
- Increased traffic congestion
- Increased water and air pollution
- Shortage of food
- Lack of clean water
Exam Tip
When interpreting a population pyramid you need to look at four key areas
- Young dependents - is the birth rate high or low?
- Working population - are there enough people of working age to support the young and old dependents?
- Old dependents - is it large or small? If it is large, then life expectancy is high
- Male/female split - are there any noticeable differences between the numbers of males and females?
To calculate the dependency ratio:
format('truetype')%3Bfont-weight%3Anormal%3Bfont-style%3Anormal%3B%7D%3C%2Fstyle%3E%3C%2Fdefs%3E%3Ctext%20fill%3D%22%23FFFFFF%22%20font-family%3D%22Times%20New%20Roman%22%20font-size%3D%2218%22%20font-style%3D%22italic%22%20text-anchor%3D%22middle%22%20x%3D%224.5%22%20y%3D%2230%22%3Ed%3C%2Ftext%3E%3Ctext%20fill%3D%22%23FFFFFF%22%20font-family%3D%22Times%20New%20Roman%22%20font-size%3D%2218%22%20font-style%3D%22italic%22%20text-anchor%3D%22middle%22%20x%3D%2213.5%22%20y%3D%2230%22%3Ee%3C%2Ftext%3E%3Ctext%20fill%3D%22%23FFFFFF%22%20font-family%3D%22Times%20New%20Roman%22%20font-size%3D%2218%22%20font-style%3D%22italic%22%20text-anchor%3D%22middle%22%20x%3D%2221.5%22%20y%3D%2230%22%3Ep%3C%2Ftext%3E%3Ctext%20fill%3D%22%23FFFFFF%22%20font-family%3D%22Times%20New%20Roman%22%20font-size%3D%2218%22%20font-style%3D%22italic%22%20text-anchor%3D%22middle%22%20x%3D%2230.5%22%20y%3D%2230%22%3Ee%3C%2Ftext%3E%3Ctext%20fill%3D%22%23FFFFFF%22%20font-family%3D%22Times%20New%20Roman%22%20font-size%3D%2218%22%20font-style%3D%22italic%22%20text-anchor%3D%22middle%22%20x%3D%2238.5%22%20y%3D%2230%22%3En%3C%2Ftext%3E%3Ctext%20fill%3D%22%23FFFFFF%22%20font-family%3D%22Times%20New%20Roman%22%20font-size%3D%2218%22%20font-style%3D%22italic%22%20text-anchor%3D%22middle%22%20x%3D%2247.5%22%20y%3D%2230%22%3Ed%3C%2Ftext%3E%3Ctext%20fill%3D%22%23FFFFFF%22%20font-family%3D%22Times%20New%20Roman%22%20font-size%3D%2218%22%20font-style%3D%22italic%22%20text-anchor%3D%22middle%22%20x%3D%2256.5%22%20y%3D%2230%22%3Ee%3C%2Ftext%3E%3Ctext%20fill%3D%22%23FFFFFF%22%20font-family%3D%22Times%20New%20Roman%22%20font-size%3D%2218%22%20font-style%3D%22italic%22%20text-anchor%3D%22middle%22%20x%3D%2264.5%22%20y%3D%2230%22%3En%3C%2Ftext%3E%3Ctext%20fill%3D%22%23FFFFFF%22%20font-family%3D%22Times%20New%20Roman%22%20font-size%3D%2218%22%20font-style%3D%22italic%22%20text-anchor%3D%22middle%22%20x%3D%2273.5%22%20y%3D%2230%22%3Ec%3C%2Ftext%3E%3Ctext%20fill%3D%22%23FFFFFF%22%20font-family%3D%22Times%20New%20Roman%22%20font-size%3D%2218%22%20font-style%3D%22italic%22%20text-anchor%3D%22middle%22%20x%3D%2281.5%22%20y%3D%2230%22%3Ey%3C%2Ftext%3E%3Ctext%20fill%3D%22%23FFFFFF%22%20font-family%3D%22Times%20New%20Roman%22%20font-size%3D%2218%22%20font-style%3D%22italic%22%20text-anchor%3D%22middle%22%20x%3D%2294.5%22%20y%3D%2230%22%3Er%3C%2Ftext%3E%3Ctext%20fill%3D%22%23FFFFFF%22%20font-family%3D%22Times%20New%20Roman%22%20font-size%3D%2218%22%20font-style%3D%22italic%22%20text-anchor%3D%22middle%22%20x%3D%22101.5%22%20y%3D%2230%22%3Ea%3C%2Ftext%3E%3Ctext%20fill%3D%22%23FFFFFF%22%20font-family%3D%22Times%20New%20Roman%22%20font-size%3D%2218%22%20font-style%3D%22italic%22%20text-anchor%3D%22middle%22%20x%3D%22107.5%22%20y%3D%2230%22%3Et%3C%2Ftext%3E%3Ctext%20fill%3D%22%23FFFFFF%22%20font-family%3D%22Times%20New%20Roman%22%20font-size%3D%2218%22%20font-style%3D%22italic%22%20text-anchor%3D%22middle%22%20x%3D%22112.5%22%20y%3D%2230%22%3Ei%3C%2Ftext%3E%3Ctext%20fill%3D%22%23FFFFFF%22%20font-family%3D%22Times%20New%20Roman%22%20font-size%3D%2218%22%20font-style%3D%22italic%22%20text-anchor%3D%22middle%22%20x%3D%22119.5%22%20y%3D%2230%22%3Eo%3C%2Ftext%3E%3Ctext%20fill%3D%22%23FFFFFF%22%20font-family%3D%22math1a7ffe0c1f3a4db1c982172f4ce%22%20font-size%3D%2216%22%20text-anchor%3D%22middle%22%20x%3D%22137.5%22%20y%3D%2230%22%3E%3D%3C%2Ftext%3E%3Cline%20stroke%3D%22%23FFFFFF%22%20stroke-linecap%3D%22square%22%20stroke-width%3D%221%22%20x1%3D%22152.5%22%20x2%3D%22422.5%22%20y1%3D%2223.5%22%20y2%3D%2223.5%22%2F%3E%3Ctext%20fill%3D%22%23FFFFFF%22%20font-family%3D%22Times%20New%20Roman%22%20font-size%3D%2218%22%20font-style%3D%22italic%22%20text-anchor%3D%22middle%22%20x%3D%22158.5%22%20y%3D%2216%22%3Ey%3C%2Ftext%3E%3Ctext%20fill%3D%22%23FFFFFF%22%20font-family%3D%22Times%20New%20Roman%22%20font-size%3D%2218%22%20font-style%3D%22italic%22%20text-anchor%3D%22middle%22%20x%3D%22167.5%22%20y%3D%2216%22%3Eo%3C%2Ftext%3E%3Ctext%20fill%3D%22%23FFFFFF%22%20font-family%3D%22Times%20New%20Roman%22%20font-size%3D%2218%22%20font-style%3D%22italic%22%20text-anchor%3D%22middle%22%20x%3D%22176.5%22%20y%3D%2216%22%3Eu%3C%2Ftext%3E%3Ctext%20fill%3D%22%23FFFFFF%22%20font-family%3D%22Times%20New%20Roman%22%20font-size%3D%2218%22%20font-style%3D%22italic%22%20text-anchor%3D%22middle%22%20x%3D%22185.5%22%20y%3D%2216%22%3En%3C%2Ftext%3E%3Ctext%20fill%3D%22%23FFFFFF%22%20font-family%3D%22Times%20New%20Roman%22%20font-size%3D%2218%22%20font-style%3D%22italic%22%20text-anchor%3D%22middle%22%20x%3D%22194.5%22%20y%3D%2216%22%3Eg%3C%2Ftext%3E%3Ctext%20fill%3D%22%23FFFFFF%22%20font-family%3D%22Times%20New%20Roman%22%20font-size%3D%2218%22%20font-style%3D%22italic%22%20text-anchor%3D%22middle%22%20x%3D%22208.5%22%20y%3D%2216%22%3Ed%3C%2Ftext%3E%3Ctext%20fill%3D%22%23FFFFFF%22%20font-family%3D%22Times%20New%20Roman%22%20font-size%3D%2218%22%20font-style%3D%22italic%22%20text-anchor%3D%22middle%22%20x%3D%22217.5%22%20y%3D%2216%22%3Ee%3C%2Ftext%3E%3Ctext%20fill%3D%22%23FFFFFF%22%20font-family%3D%22Times%20New%20Roman%22%20font-size%3D%2218%22%20font-style%3D%22italic%22%20text-anchor%3D%22middle%22%20x%3D%22225.5%22%20y%3D%2216%22%3Ep%3C%2Ftext%3E%3Ctext%20fill%3D%22%23FFFFFF%22%20font-family%3D%22Times%20New%20Roman%22%20font-size%3D%2218%22%20font-style%3D%22italic%22%20text-anchor%3D%22middle%22%20x%3D%22234.5%22%20y%3D%2216%22%3Ee%3C%2Ftext%3E%3Ctext%20fill%3D%22%23FFFFFF%22%20font-family%3D%22Times%20New%20Roman%22%20font-size%3D%2218%22%20font-style%3D%22italic%22%20text-anchor%3D%22middle%22%20x%3D%22242.5%22%20y%3D%2216%22%3En%3C%2Ftext%3E%3Ctext%20fill%3D%22%23FFFFFF%22%20font-family%3D%22Times%20New%20Roman%22%20font-size%3D%2218%22%20font-style%3D%22italic%22%20text-anchor%3D%22middle%22%20x%3D%22251.5%22%20y%3D%2216%22%3Ed%3C%2Ftext%3E%3Ctext%20fill%3D%22%23FFFFFF%22%20font-family%3D%22Times%20New%20Roman%22%20font-size%3D%2218%22%20font-style%3D%22italic%22%20text-anchor%3D%22middle%22%20x%3D%22260.5%22%20y%3D%2216%22%3Ee%3C%2Ftext%3E%3Ctext%20fill%3D%22%23FFFFFF%22%20font-family%3D%22Times%20New%20Roman%22%20font-size%3D%2218%22%20font-style%3D%22italic%22%20text-anchor%3D%22middle%22%20x%3D%22268.5%22%20y%3D%2216%22%3En%3C%2Ftext%3E%3Ctext%20fill%3D%22%23FFFFFF%22%20font-family%3D%22Times%20New%20Roman%22%20font-size%3D%2218%22%20font-style%3D%22italic%22%20text-anchor%3D%22middle%22%20x%3D%22275.5%22%20y%3D%2216%22%3Et%3C%2Ftext%3E%3Ctext%20fill%3D%22%23FFFFFF%22%20font-family%3D%22Times%20New%20Roman%22%20font-size%3D%2218%22%20font-style%3D%22italic%22%20text-anchor%3D%22middle%22%20x%3D%22281.5%22%20y%3D%2216%22%3Es%3C%2Ftext%3E%3Ctext%20fill%3D%22%23FFFFFF%22%20font-family%3D%22math1a7ffe0c1f3a4db1c982172f4ce%22%20font-size%3D%2216%22%20text-anchor%3D%22middle%22%20x%3D%22298.5%22%20y%3D%2216%22%3E%2B%3C%2Ftext%3E%3Ctext%20fill%3D%22%23FFFFFF%22%20font-family%3D%22Times%20New%20Roman%22%20font-size%3D%2218%22%20font-style%3D%22italic%22%20text-anchor%3D%22middle%22%20x%3D%22315.5%22%20y%3D%2216%22%3Eo%3C%2Ftext%3E%3Ctext%20fill%3D%22%23FFFFFF%22%20font-family%3D%22Times%20New%20Roman%22%20font-size%3D%2218%22%20font-style%3D%22italic%22%20text-anchor%3D%22middle%22%20x%3D%22322.5%22%20y%3D%2216%22%3El%3C%2Ftext%3E%3Ctext%20fill%3D%22%23FFFFFF%22%20font-family%3D%22Times%20New%20Roman%22%20font-size%3D%2218%22%20font-style%3D%22italic%22%20text-anchor%3D%22middle%22%20x%3D%22329.5%22%20y%3D%2216%22%3Ed%3C%2Ftext%3E%3Ctext%20fill%3D%22%23FFFFFF%22%20font-family%3D%22Times%20New%20Roman%22%20font-size%3D%2218%22%20font-style%3D%22italic%22%20text-anchor%3D%22middle%22%20x%3D%22343.5%22%20y%3D%2216%22%3Ed%3C%2Ftext%3E%3Ctext%20fill%3D%22%23FFFFFF%22%20font-family%3D%22Times%20New%20Roman%22%20font-size%3D%2218%22%20font-style%3D%22italic%22%20text-anchor%3D%22middle%22%20x%3D%22352.5%22%20y%3D%2216%22%3Ee%3C%2Ftext%3E%3Ctext%20fill%3D%22%23FFFFFF%22%20font-family%3D%22Times%20New%20Roman%22%20font-size%3D%2218%22%20font-style%3D%22italic%22%20text-anchor%3D%22middle%22%20x%3D%22360.5%22%20y%3D%2216%22%3Ep%3C%2Ftext%3E%3Ctext%20fill%3D%22%23FFFFFF%22%20font-family%3D%22Times%20New%20Roman%22%20font-size%3D%2218%22%20font-style%3D%22italic%22%20text-anchor%3D%22middle%22%20x%3D%22369.5%22%20y%3D%2216%22%3Ee%3C%2Ftext%3E%3Ctext%20fill%3D%22%23FFFFFF%22%20font-family%3D%22Times%20New%20Roman%22%20font-size%3D%2218%22%20font-style%3D%22italic%22%20text-anchor%3D%22middle%22%20x%3D%22377.5%22%20y%3D%2216%22%3En%3C%2Ftext%3E%3Ctext%20fill%3D%22%23FFFFFF%22%20font-family%3D%22Times%20New%20Roman%22%20font-size%3D%2218%22%20font-style%3D%22italic%22%20text-anchor%3D%22middle%22%20x%3D%22386.5%22%20y%3D%2216%22%3Ed%3C%2Ftext%3E%3Ctext%20fill%3D%22%23FFFFFF%22%20font-family%3D%22Times%20New%20Roman%22%20font-size%3D%2218%22%20font-style%3D%22italic%22%20text-anchor%3D%22middle%22%20x%3D%22395.5%22%20y%3D%2216%22%3Ee%3C%2Ftext%3E%3Ctext%20fill%3D%22%23FFFFFF%22%20font-family%3D%22Times%20New%20Roman%22%20font-size%3D%2218%22%20font-style%3D%22italic%22%20text-anchor%3D%22middle%22%20x%3D%22403.5%22%20y%3D%2216%22%3En%3C%2Ftext%3E%3Ctext%20fill%3D%22%23FFFFFF%22%20font-family%3D%22Times%20New%20Roman%22%20font-size%3D%2218%22%20font-style%3D%22italic%22%20text-anchor%3D%22middle%22%20x%3D%22410.5%22%20y%3D%2216%22%3Et%3C%2Ftext%3E%3Ctext%20fill%3D%22%23FFFFFF%22%20font-family%3D%22Times%20New%20Roman%22%20font-size%3D%2218%22%20font-style%3D%22italic%22%20text-anchor%3D%22middle%22%20x%3D%22416.5%22%20y%3D%2216%22%3Es%3C%2Ftext%3E%3Ctext%20fill%3D%22%23FFFFFF%22%20font-family%3D%22Times%20New%20Roman%22%20font-size%3D%2218%22%20font-style%3D%22italic%22%20text-anchor%3D%22middle%22%20x%3D%22222.5%22%20y%3D%2241%22%3Ew%3C%2Ftext%3E%3Ctext%20fill%3D%22%23FFFFFF%22%20font-family%3D%22Times%20New%20Roman%22%20font-size%3D%2218%22%20font-style%3D%22italic%22%20text-anchor%3D%22middle%22%20x%3D%22233.5%22%20y%3D%2241%22%3Eo%3C%2Ftext%3E%3Ctext%20fill%3D%22%23FFFFFF%22%20font-family%3D%22Times%20New%20Roman%22%20font-size%3D%2218%22%20font-style%3D%22italic%22%20text-anchor%3D%22middle%22%20x%3D%22241.5%22%20y%3D%2241%22%3Er%3C%2Ftext%3E%3Ctext%20fill%3D%22%23FFFFFF%22%20font-family%3D%22Times%20New%20Roman%22%20font-size%3D%2218%22%20font-style%3D%22italic%22%20text-anchor%3D%22middle%22%20x%3D%22248.5%22%20y%3D%2241%22%3Ek%3C%2Ftext%3E%3Ctext%20fill%3D%22%23FFFFFF%22%20font-family%3D%22Times%20New%20Roman%22%20font-size%3D%2218%22%20font-style%3D%22italic%22%20text-anchor%3D%22middle%22%20x%3D%22255.5%22%20y%3D%2241%22%3Ei%3C%2Ftext%3E%3Ctext%20fill%3D%22%23FFFFFF%22%20font-family%3D%22Times%20New%20Roman%22%20font-size%3D%2218%22%20font-style%3D%22italic%22%20text-anchor%3D%22middle%22%20x%3D%22262.5%22%20y%3D%2241%22%3En%3C%2Ftext%3E%3Ctext%20fill%3D%22%23FFFFFF%22%20font-family%3D%22Times%20New%20Roman%22%20font-size%3D%2218%22%20font-style%3D%22italic%22%20text-anchor%3D%22middle%22%20x%3D%22271.5%22%20y%3D%2241%22%3Eg%3C%2Ftext%3E%3Ctext%20fill%3D%22%23FFFFFF%22%20font-family%3D%22Times%20New%20Roman%22%20font-size%3D%2218%22%20font-style%3D%22italic%22%20text-anchor%3D%22middle%22%20x%3D%22285.5%22%20y%3D%2241%22%3Ep%3C%2Ftext%3E%3Ctext%20fill%3D%22%23FFFFFF%22%20font-family%3D%22Times%20New%20Roman%22%20font-size%3D%2218%22%20font-style%3D%22italic%22%20text-anchor%3D%22middle%22%20x%3D%22294.5%22%20y%3D%2241%22%3Eo%3C%2Ftext%3E%3Ctext%20fill%3D%22%23FFFFFF%22%20font-family%3D%22Times%20New%20Roman%22%20font-size%3D%2218%22%20font-style%3D%22italic%22%20text-anchor%3D%22middle%22%20x%3D%22303.5%22%20y%3D%2241%22%3Ep%3C%2Ftext%3E%3Ctext%20fill%3D%22%23FFFFFF%22%20font-family%3D%22Times%20New%20Roman%22%20font-size%3D%2218%22%20font-style%3D%22italic%22%20text-anchor%3D%22middle%22%20x%3D%22312.5%22%20y%3D%2241%22%3Eu%3C%2Ftext%3E%3Ctext%20fill%3D%22%23FFFFFF%22%20font-family%3D%22Times%20New%20Roman%22%20font-size%3D%2218%22%20font-style%3D%22italic%22%20text-anchor%3D%22middle%22%20x%3D%22319.5%22%20y%3D%2241%22%3El%3C%2Ftext%3E%3Ctext%20fill%3D%22%23FFFFFF%22%20font-family%3D%22Times%20New%20Roman%22%20font-size%3D%2218%22%20font-style%3D%22italic%22%20text-anchor%3D%22middle%22%20x%3D%22326.5%22%20y%3D%2241%22%3Ea%3C%2Ftext%3E%3Ctext%20fill%3D%22%23FFFFFF%22%20font-family%3D%22Times%20New%20Roman%22%20font-size%3D%2218%22%20font-style%3D%22italic%22%20text-anchor%3D%22middle%22%20x%3D%22332.5%22%20y%3D%2241%22%3Et%3C%2Ftext%3E%3Ctext%20fill%3D%22%23FFFFFF%22%20font-family%3D%22Times%20New%20Roman%22%20font-size%3D%2218%22%20font-style%3D%22italic%22%20text-anchor%3D%22middle%22%20x%3D%22337.5%22%20y%3D%2241%22%3Ei%3C%2Ftext%3E%3Ctext%20fill%3D%22%23FFFFFF%22%20font-family%3D%22Times%20New%20Roman%22%20font-size%3D%2218%22%20font-style%3D%22italic%22%20text-anchor%3D%22middle%22%20x%3D%22344.5%22%20y%3D%2241%22%3Eo%3C%2Ftext%3E%3Ctext%20fill%3D%22%23FFFFFF%22%20font-family%3D%22Times%20New%20Roman%22%20font-size%3D%2218%22%20font-style%3D%22italic%22%20text-anchor%3D%22middle%22%20x%3D%22353.5%22%20y%3D%2241%22%3En%3C%2Ftext%3E%3Ctext%20fill%3D%22%23FFFFFF%22%20font-family%3D%22math1a7ffe0c1f3a4db1c982172f4ce%22%20font-size%3D%2216%22%20text-anchor%3D%22middle%22%20x%3D%22437.5%22%20y%3D%2230%22%3E%26%23xD7%3B%3C%2Ftext%3E%3Ctext%20fill%3D%22%23FFFFFF%22%20font-family%3D%22Times%20New%20Roman%22%20font-size%3D%2218%22%20text-anchor%3D%22middle%22%20x%3D%22463.5%22%20y%3D%2230%22%3E100%3C%2Ftext%3E%3C%2Fsvg%3E)


