
River Fieldwork Methods
Data Collection Methods
- The data collection methods will depend on the aims/hypothesis of the fieldwork
- The starting point with most river fieldwork is to measure the width and depth
- Data collection should include both quantitative and qualitative methods
- The collection of quantitative data can be completed in several ways in a river study
Width
- The measurement of width is taken where the water surface comes into contact with the river banks.
 Measurement of River Width
- To take an accurate measurement:
- Measure from the point where the dry bank meets the water on one side to the point where the dry bank meets the water on the opposite side
- Ensure that the tape is held taut and does not touch the water this could affect the reliability of the data
Depth
- The measurement of depth should be completed at regular intervals across the width
- This ensures a full picture of the changes in depth across the whole channel width is recorded
- It also allows a mean depth to be calculated to use in the calculation of river discharge
 Depth Measurements
- To take an accurate depth measurement:
- Work out the distance apart each depth measurement needs to be
- Place a meter rule into the water at the correct point
- Ensure the meter rule is placed sideways with the flat side facing the banks: this reduces any impact on the water height ensuring more accurate measurements
- Record the distance from the bed to the surface of the water
- Repeat this across the width of the river
Velocity
- The velocity is the speed at which the river flows
- This can vary across the channel width as well as along the course of the river so velocity should be recorded in three positions: towards the left bank, centre and towards the right bank
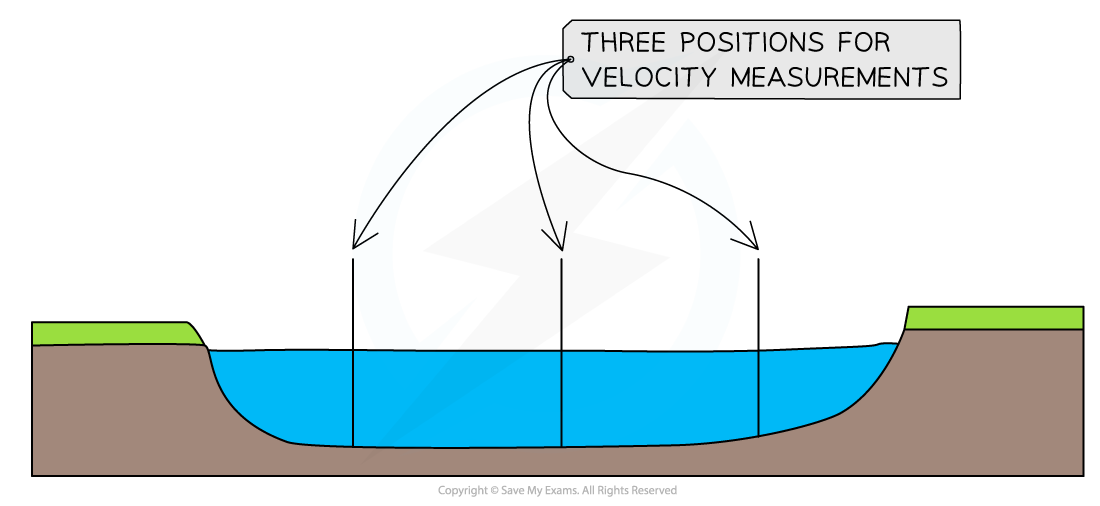
Positions in River Channel for Velocity Measurements
- Using a flow meter velocity can be easily measured by:
- Taking readings at three equal distances across the river width
- Placing the flow meter into the water at least 3cm below the surface
- Three readings should be taken at each of the three places across the channel to allow the calculation of a mean
- To take an accurate measurement using a float:
- Measure a set distance upstream - for example, 10 meters
- Drop a float at the start of the 10 meters
- Time how long it takes for the float to travel the distance using a stopwatch
- Repeat at each position three times to allow the calculation of a mean
Discharge
- The discharge of the river is calculated rather than measured
- The first step is to calculate the cross-sectional area:
- Cross-sectional area (m2) = width (m) x mean depth (m)
- The second step is to calculate the velocity:
- If a flow meter the mean velocity should be calculated by adding the velocity measurements and dividing by the number of measurements
- If a float has been used and a distance of 10m then the meantime should be divided by 10 to calculate the time taken to travel 1m
- Discharge (m3/s) = cross-sectional area (m2) x velocity (m/s)
Gradient
- As it moves downstream rivers decrease in height
- This is the gradient of the river
- The gradient is measured over a 10 meter stretch of river with a ranging pole placed at 0m and another clinometer at 10 meters
- A clinometer is then used to measure the difference in height between the two poles

Measuring gradient using a clinometer
Photographs and Field Sketches
- Photographs and field sketches are qualitative data
- Just as with any data collection and presentation they have strengths and weaknesses
- In a river enquiry photographs and field sketches can be used to show landforms and particular features such as bed load
- Photographs are also ideal for illustrating the data collection methods used
Worked example
You have carried out your own fieldwork investigating the influence of drainage basin and channel characteristics on flood risk.
Explain one method that you used to collect your primary data
(2 marks)
Answer:
- We measured depth using a tape and metre rule (1) taking measurements at x sites upstream/downstream from our access point (1)
- We measured width using a tape (1) taking measurements at x sites upstream/downstream form our access point (1)
- We measured gradient using a clinometer, a tape and ranging poles (1) both upstream and downstream from our point of access (1)
Exam Tip
Annotations and labels are not the same. A label is a simple descriptive point. For example, 'meander'. Whereas an annotation is a label with a more detailed description or an explanatory point. For example, 'slip off slope where the material has been deposited due to slower flow'
River Enquiry Data Presentation
- Data presentation can take many forms
Primary Data
- Much of the primary data collected in a river enquiry will be presented in the form of a graphs
- Each type of graph is suitable for particular data sets
- The graphs also may have strengths and limitations
- Suitable graphs include:
- Line graphs for river channel cross-sections
- Bar graphs to compare different sites
- Scattergraphs to show the relationship between two sets of data. For example, the river width and discharge
Exam Tip
In the exam, you will not be asked to draw an entire graph. However, it is common to be asked to complete an unfinished graph using the data provided. You may also be asked to identify anomalous results or to draw the best fit line on a scattergraph.
- Take your time to ensure that you have marked the data on the graph accurately
- Use the same style as the data which has already been put on the graph
- Bars on a bar graph should be the same width
- If the dots on a graph are connected by a line you should do the same
Secondary Data
- Any fieldwork should include secondary data as well as primary data
- In a river enquiry suitable secondary data may include:
- River discharge data from the Environment Agency
- Weather data from the Meteorological Office (Met Office)
- Old photographs of the river sample site
- Newspaper articles/websites about the river
- Ordnance Survey maps to identify the sample sites
- Geology maps
- Aerial photographs
Analysis
- Once data has been collected and presented it needs to be analysed
- The data which is collected from the river such as width, depth, velocity is quantitative data and will need to be analysed using statistical methods
- One of the main statistical methods used in a river enquiry will be the mean where mean depth or velocity needs to be calculated
- Geographical theories and case studies can also be used in the analysis to explain whether the data collected was as would be expected based on knowledge from those theories/case studies
Analysing Photographs and Field Sketches
- Use of photographs and field sketches is a qualitative analysis
- Photographs can be used in a river enquiry to analyse a number of features:
- Landforms and their formation
- Data collection techniques

Annotation of a photograph
Worked example
Analyse Figure 1 which is the data collected by a group of students studying changes in river characteristics

Describe the relationship between river gradient and velocity
(4 marks)
Answer:
- In general the steeper the gradient the lower the velocity (1) so at site 1 4.5o and 14.5 cm/sec (1)
- Site 3 looks to be an anomaly (1) the gradient at this site is 3o but the velocity is much lower at 8 cm/sec compared to other sites with similar gradients(1)
- Sites 6,7 and 8 also pose some problems (1) but gradient differences are very small indeed (1)
Conclusion
- Once the data collected has been analysed, conclusions can be reached
- This should state whether the hypothesis has been proved or disproved
- Identify and explain anomalies such as:
- Decreasing average depth or width with distance downstream at one site
- Decreased velocity at a particular site
- Anomalies may just occur or may be the result of incorrect recording or human error reading equipment
Evaluation
- The final stage of the river enquiry is the evaluation where you note how successful, or not, the river investigation was and what you would do differently next time
- Next time I would take measurements over a longer period of time to ensure the reliability of data...
- My equipment failed and I would make sure to bring a spare next time...
- I think my investigation went well and I would like to repeat this after a storm event to see how much erosion has taken place...
