Introduction to Signal Transduction (College Board AP Biology)

Topic Questions

1a2 marks

qp2-2018-frq-ap-biology

Figure 1. Cellular response to infection by pathogenic bacteria

Some pathogenic bacteria enter cælls, replicate, and spread to other cells, causing illness in the host organism. Host cells respond to these infections in a number of ways, one of which involves activating particular enzymatic pathways (Figure 1). Cells normally produce a steady supply of inactive caspase-1 protein. In response to intracellular pathogens, the inactive caspase-1 is cleaved and forms an active caspase-1 (step 1). Active caspase-1 can cleave two other proteins. When caspase-1 cleaves an inactive interleukin (step 2), the active portion of the interleukin is released from the cell. An interleukin is a signaling molecule that can activate the immune response. When caspase-1 cleaves gasdermin (step 3), the N-terminal portions of several gasdermin proteins associate in the cell membrane to form large, nonspecific pores.

Researchers created the model in Figure 1 using data from cell fractionation studies. In the experiments, various parts of the cell were separated into fractions by mechanical and chemical methods. Specific proteins known to be located in different parts of the cell were used as markers to determine the location of other proteins. The table below shows the presence of known proteins in specific cellular fractions.

CELL FRACTIONS CONTAINING DIFFERENT CELLULAR PROTEINS

  Aconitase
(Krebs cycle
protein)
DNA
polymerase
GAPDH
(glycolytic
protein
Sodium-
potassium
pump
NF-KB
(Immune
response
protein)
Whole cell sample + + + + +
Fraction 1 +        
Fraction 2   +     +
Fraction 3     +   +
Fraction 4       +  
+ = presence of protein

Describe the effect of inhibiting step 3 on the formation of pores AND on the release of interleukin from the cell.

1b2 marks

Make a claim about how cleaving inactive caspase-1 results in activation of caspase-1. A student claims that preinfection production of inactive precursors shortens the response time of a cell to a bacterial infection. Provide ONE reason to support the student's claim.

1c3 marks

A student claims that the NF-KB protein is located in the cytoplasm until the protein is needed for transcription. Justify the student's claim with evidence. Identify TWO fractions where N-terminal gasdermin would be found in cells infected with pathogenic bacteria.

1d1 mark

Describe the most likely effect of gasdermin pore formation on water balance in the cell in a hypotonic environment.

Did this page help you?

2a2 marks

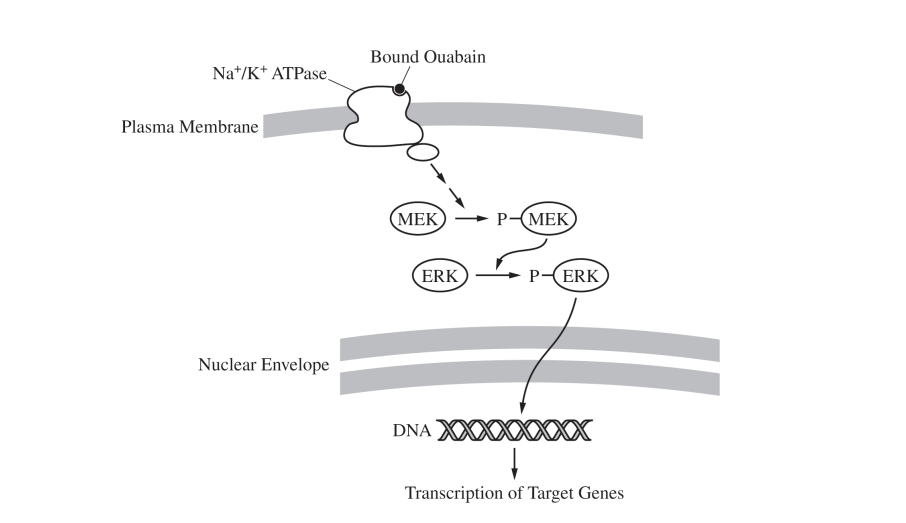
Polycystic kidney disease (PKD) is an inherited disease that causes water loss from the body and affects cell division in the kidneys. Because water movement across cell membranes is related to ion movement, scientists investigated the role of the Na+/K+ ATPase (also known as the sodium/potassium pump) in this disease. Ouabain, a steroid hormone, binds to the Na+/K+ ATPase in plasma membranes. Individuals with PKD have a genetic mutation that results in an increased binding of ouabain to the Na+/K+ ATPase. The scientists treated normal human kidney (NHK) cells and PKD cells with increasing concentrations of ouabain and measured the number of cells (Figure 1) and the activity of the Na+/K+ ATPase (Figure 2) after a period of time. The scientists hypothesized that a signal transduction pathway that includes the protein kinases MEK and ERK (Figure 3) may play a role in PKD symptoms.

qp1-2021-frq-ap-biology

qp1a-2021-frq-ap-biology

Figure 3. Signal transduction pathway hypothesized to play a role in the increased number of PKD cells

Describe the characteristics of the plasma membrane that prevent simple diffusion of Na+ and K+ across the membrane. Explain why ATP is required for the activity of the Na+/K + ATPase.

2b3 marks

Identify a dependent variable in the experiment represented in Figure 1. Justify the use of normal human kidney (NHK) cells as a control in the experiments. Justify the use of a range of ouabain concentrations in the experiment represented in Figure 1.

2c2 marks

Based on the data shown in Figure 2, describe the relationship between the concentration of ouabain and the Na+/K+ ATPase activity both in normal human kidney (NHK) cells AND in PKD cells. The scientists determined that Na+/K+ ATPase activity in PKD cells treated with 1 pM ouabain is 150 units of ATP hydrolyzed/sec. Calculate the expected Na+/K+ ATPase activity (units/sec) in PKD cells treated with 106 pM ouabain.

2d3 marks

In a third experiment, the scientists added an inhibitor of phosphorylated MEK (pMEK) to the PKD cells exposed to 104 pM ouabain. Based on Figure 3, predict the change in the relative ratio of ERK to pERK in ouabain-treated PKD cells with the inhibitor compared with ouabain-treated PKD cells without the inhibitor. Provide reasoning to justify your prediction. Using the data in Figure 1 AND the signal transduction pathway represented in Figure 3, explain how the concentration of cyclin proteins may increase in PKD cells treated with 104 pM ouabain.

Did this page help you?

3a2 marks

The binding of an extracellular ligand to a G protein-coupled receptor in the plasma membrane of a cell triggers intracellular signaling (Figure 1, A). After ligand binding, GTP replaces the GDP that is bound to Gsα, a subunit of the G protein (Figure 1, B). This causes Gsα to activate other cellular proteins, including adenylyl cyclase that converts ATP to cyclic AMP (cAMP). The cAMP activates protein kinases (Figure 1, C). In cells that line the small intestine, a cAMP-activated protein kinase causes further signaling that ultimately results in the secretion of chloride ions (Cl¯) from the cells. Under normal conditions, Gsα hydrolyzes GTP to GDP, thus inactivating adenylyl cyclase and stopping the signal (Figure 1, A).qp1-2022-frq-ap-biology

Figure 1. Under normal conditions, ligand binding to a G protein-coupled receptor results in chloride ion transport from an intestinal cell

Individuals infected with the bacterium Vibrio cholerae experience severe loss of water from the body (dehydration). This is due to the effects of the bacterial cholera toxin that enters intestinal cells. Scientists studied the effects of cholera toxin on four samples of isolated intestinal cell membranes containing the G protein-related signal transduction components shown in Figure 1. GTP was added to samples II and IV only; cholera toxin was added to samples Ill and IV only. The scientists then measured the amount of cAMP produced by the adenylyl cyclase in each sample (Table 1).

TABLE 1. AMOUNT OF cAMP PRODUCED FROM INTESTINAL CELL MEMBRANES IN THE ABSENCE OR PRESENCE OF CHOLERA TOXIN

Sample GTP Cholera Toxin Rate of cAMP Production (pmol per mg adenylyl cyclase per min)
I 0.5
II + 10.0
III + 0.5
IV + + 127.0

                        present, +; absent, −

Describe one characteristic of a membrane that requires a channel be present for chloride ions to passively cross the membrane. Explain why the movement of chloride ions out of intestinal cells leads to water loss.

3b3 marks

Identify an independent variable in the experiment. Identify a negative control in the experiment. Justify why the scientists included Sample Ill as a control treatment in the experiment.

3c2 marks

Based on the data, describe the effect of cholera toxin on the synthesis of cAMP. Calculate the percent change in the rate of cAMP production due to the presence of cholera toxin in sample IV compared with sample II.

3d2 marks

A drug is designed to bind to cholera toxin before it crosses the intestinal cell membrane. Scientists mix the drug with cholera toxin and then add this mixture and GTP to a sample of intestinal cell membranes. Predict the rate of cAMP production in pmol per mg adenylyl cyclase per min if the drug binds to all of the toxin. In a separate experiment, scientists engineer a mutant adenylyl cyclase that cannot be activated by Gsα. The scientists claim that cholera toxin will not cause excessive water loss from whole intestinal cells that contain the mutant adenylyl cyclase. Justify this claim.

Did this page help you?

4a2 marks

ln eukaryotic microorganisms, the PHO signaling pathway regulates the expression of certain genes. These genes, Pho target genes, encode proteins involved in regulating phosphate homeostasis. When the level of extracellular inorganic phosphate (Pi) is high, a transcriptional activator Pho4 is phosphorylated by a complex of two proteins, Pho80—Pho85. As a result, the Pho target genes are not expressed. When the level of extracellular Pi is low, the activity of the Pho80—Pho85 complex is inhibited by another protein, Pho81, enabling Pho4 to induce the expression of these target genes. A simplified model of this pathway is shown in Figure 1.qp1-2023-frq-ap-biology

Figure 1. A simplified model of the regulation of expression of Pho target genes in (A) a high-phosphate (high-Pi) environment and (B) a low-phosphate (low-Pi) environment

To study the role of the different proteins in the PHO pathway, researchers used a wild-type strain of yeast to create a strain with a mutant form of Pho81 (pho81mt) and a strain with a mutant form of Pho4 (pho4mt). In each of these mutant strains, researchers measured the activity of a particular enzyme, APase, which removes phosphates from its substrates and is encoded by PHO1, a Pho target gene (Table 1). They then determined the level of PHO1 mRNA relative to that of the wild-type yeast strain, which was set to 10.

TABLE 1. APase ACTIVITY AND RELATIVE AMOUNTS OF PHO1 mRNA IN WILD-TYPE AND MUTANT STRAINS OF YEAST IN HIGH- AND LOW-PHOSPHATE ENVIRONMENTS

Yeast Strain Mutation APase Activity in
High-Pi Environment (mU/mL/OD600)plus-or-minus 2 SE subscript x with bar on top end subscript
APase Activity in
Low-Pi Environment (mU/mL/OD600)plus-or-minus 2 SE subscript x with bar on top end subscript
Relative Amounts of
PHO1 mRNA in
High-Pi Environment
plus-or-minus 2 SE subscript x with bar on top end subscript

Relative Amounts of
PHO1 mRNA in
Low-Pi Environmentplus-or-minus 2 SE subscript x with bar on top end subscript

Wild-type None 0.5 plus-or-minus 0.1 17.3 plus-or-minus 0.9 0.1 plus-or-minus 0.0 10 plus-or-minus 2.0
pho81mt Nonfunctional
Pho81
0.4 plus-or-minus 0.1 0.6 plus-or-minus 0.1 0.7 plus-or-minus 0.2 0.9 plus-or-minus 0.8
pho4mt Nonfunctional
Pho4
0.5 plus-or-minus 0.0 0.8 plus-or-minus 0.2 0.6 plus-or-minus 0.4 0.3 plus-or-minus 0.1

Describe the effect that the addition of a charged phosphate group can have on a protein that would cause the protein to become inactive. Explain how a signal can be amplified during signal transduction in a pathway such as the PHO signaling pathway.

4b3 marks

Based on Table 1', identify a dependent variable in the researchers' experiment: Justify the researchers" using the wild-type strain for the creation of the mutant strains. Justify the researchers' using mutant strains in which only a single component of the pathway was mutated in each strain.

4c2 marks

Based on the data in Table 1 , identify the yeast strain and growth conditions that lead to the highest relative amount of PHO1 mRNA. Calculate the percent change in APase activity in wild-type yeast cells in a high-Pi environment compared with that of wild-type cells in a low-Pi environment.

4d2 marks

In a follow-up experiment, researchers created a strain of yeast with a mutation that resulted in a nonfunctional Pho85 protein. Based on Figure 1, predict the effects of this mutation on PHO1 expression in the mutant strain in a high-Pi environment. Provide reasoning to justify your prediction.

Did this page help you?