1 20 marks
Evaluate the view that increased globalisation inevitably results in international migration.
(20)
Did this page help you?
Evaluate the view that increased globalisation inevitably results in international migration.
(20)
Did this page help you?
Study Figure 6 in the Resource Booklet.

Figure 6
Foreign-born population (international migrants) by destination country, 2018
Suggest reasons for the differences in the numbers of foreign-born population (international migrants) in the countries shown.
(6)
Did this page help you?
Study Figure 6 below.
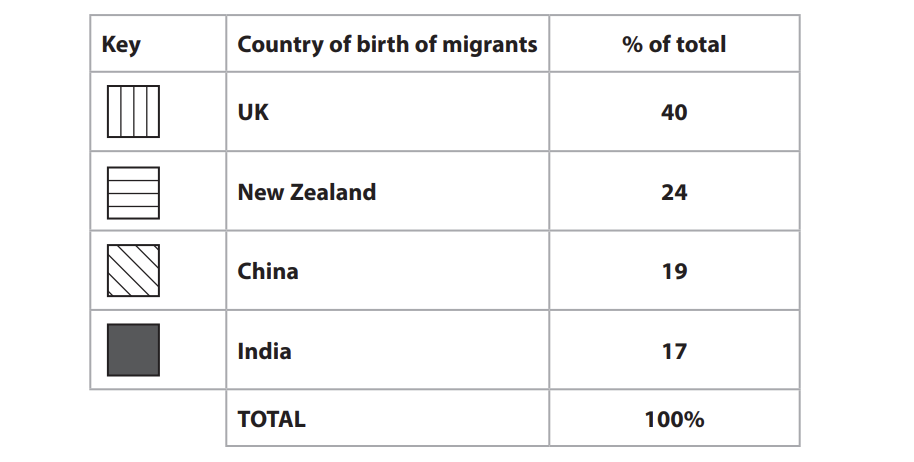
Figure 6
Top four countries of birth for migrants living in Australia, 2016
(2)

(2)
(6)
Did this page help you?
Explain why the movement of labour is unrestricted within many countries.
(8)
Did this page help you?
Study Figure C below.
| Country | Malawi | Nigeria | India | Egypt | Iran | Czech Republic |
France | United States |
Norway |
| Human Development Index |
0.43 | 0.50 | 0.58 | 0.68 | 0.75 | 0.85 | 0.88 | 0.91 | 0.94 |
| % of foreign born residents |
1.3% | 0.7% | 0.4% | 0.4% | 3.5% | 4.0% | 11.5% | 14.3% | 11.8% |
Figure C: Table showing the Human Development Index and the percentage
of foreign-born residents in selected countries.
(3)
(1)

Figure D: Graph showing the Human Development Index and the percentage
of foreign born residents in selected countries
(6)
Did this page help you?