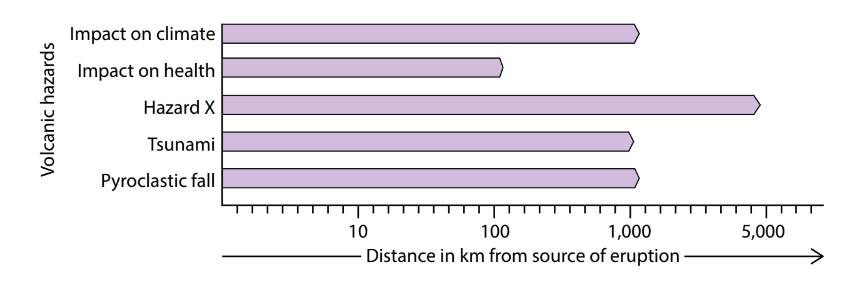
Study Figure 1 below.
This data in Figure 1 was collected to investigate whether there was a significant relationship between the percentage of silica and the percentage of volatile gases in lava samples, found at 12 contrasting volcanic locations.
Lava samples from
12 contrasting
volcanic locations
(n=12) |
% of
silica in
the lava |
Rank |
% of
volatile
gases* |
Rank |
d |
d2 |
| 1 |
50 |
9 |
1.9 |
11 |
−2 |
4 |
| 2 |
70 |
3 |
5.2 |
3 |
0 |
0 |
| 3 |
58 |
8 |
3.7 |
7 |
1 |
1 |
| 4 |
73 |
1 |
6.6 |
1 |
0 |
0 |
| 5 |
63 |
6 |
4.0 |
6 |
0 |
0 |
| 6 |
62 |
7 |
3.3 |
8 |
−1 |
1 |
| 7 |
45 |
12 |
3.0 |
9 |
3 |
9 |
| 8 |
71 |
2 |
4.1 |
5 |
−3 |
9 |
| 9 |
49 |
10 |
2.5 |
10 |
0 |
0 |
| 10 |
69 |
4 |
5.3 |
2 |
2 |
4 |
| 11 |
48 |
11 |
1.2 |
12 |
−1 |
1 |
| 12 |
68 |
5 |
4.5 |
4 |
1 |
1 |
| |
|
|
|
|
∑d2 = |
|
Volatile gases – gases emitted by volcanoes at high temperature such as water vapour, carbon dioxide and sulphur dioxide.
a)
i)
Complete Figure 1 by calculating ∑d2
.
(1)
ii)
The formula for Spearman’s rank correlation coefficient value rs is given below; in this data set n is equal to 12.
rs = 1 − format('truetype')%3Bfont-weight%3Anormal%3Bfont-style%3Anormal%3B%7D%3C%2Fstyle%3E%3C%2Fdefs%3E%3Cline%20stroke%3D%22%23000000%22%20stroke-linecap%3D%22square%22%20stroke-width%3D%221%22%20x1%3D%222.5%22%20x2%3D%2252.5%22%20y1%3D%2229.5%22%20y2%3D%2229.5%22%2F%3E%3Ctext%20font-family%3D%22Times%20New%20Roman%22%20font-size%3D%2218%22%20text-anchor%3D%22middle%22%20x%3D%228.5%22%20y%3D%2220%22%3E6%3C%2Ftext%3E%3Ctext%20font-family%3D%22math1170fb7cccdb038d7a2b41a387f%22%20font-size%3D%2224%22%20text-anchor%3D%22middle%22%20x%3D%2224.5%22%20y%3D%2223%22%3E%26%23x2211%3B%3C%2Ftext%3E%3Ctext%20font-family%3D%22Times%20New%20Roman%22%20font-size%3D%2218%22%20text-anchor%3D%22middle%22%20x%3D%2239.5%22%20y%3D%2220%22%3Ed%3C%2Ftext%3E%3Ctext%20font-family%3D%22Times%20New%20Roman%22%20font-size%3D%2213%22%20text-anchor%3D%22middle%22%20x%3D%2247.5%22%20y%3D%2215%22%3E2%3C%2Ftext%3E%3Ctext%20font-family%3D%22Times%20New%20Roman%22%20font-size%3D%2218%22%20text-anchor%3D%22middle%22%20x%3D%2211.5%22%20y%3D%2248%22%3En%3C%2Ftext%3E%3Ctext%20font-family%3D%22Times%20New%20Roman%22%20font-size%3D%2213%22%20text-anchor%3D%22middle%22%20x%3D%2219.5%22%20y%3D%2243%22%3E3%3C%2Ftext%3E%3Ctext%20font-family%3D%22math1170fb7cccdb038d7a2b41a387f%22%20font-size%3D%2216%22%20text-anchor%3D%22middle%22%20x%3D%2231.5%22%20y%3D%2248%22%3E%26%23x2212%3B%3C%2Ftext%3E%3Ctext%20font-family%3D%22Times%20New%20Roman%22%20font-size%3D%2218%22%20text-anchor%3D%22middle%22%20x%3D%2244.5%22%20y%3D%2248%22%3En%3C%2Ftext%3E%3C%2Fsvg%3E)
Calculate the value of rs to two decimal places for the data given.
You must show your working.
(2)
iii)
The tables below show the two hypotheses that are being tested and the critical values of Spearman’s rank rs value when n = 12.
| Null hypothesis: There is no significant relationship between the % of silica and the % of volatile gases in these lava samples. |
| Alternative hypothesis: There is a significant relationship between the % of silica and the % of volatile gases in these lava samples. |
| Confidence level |
0.10
(90% significance)
|
0.05
(95% significance) |
0.01
(99% significance) |
| Critical value |
0.50 |
0.59 |
0.78 |
Using the Spearman’s rank correlation rs value calculated in (a)(ii), state which hypothesis can be accepted.
(1)
 4 marks
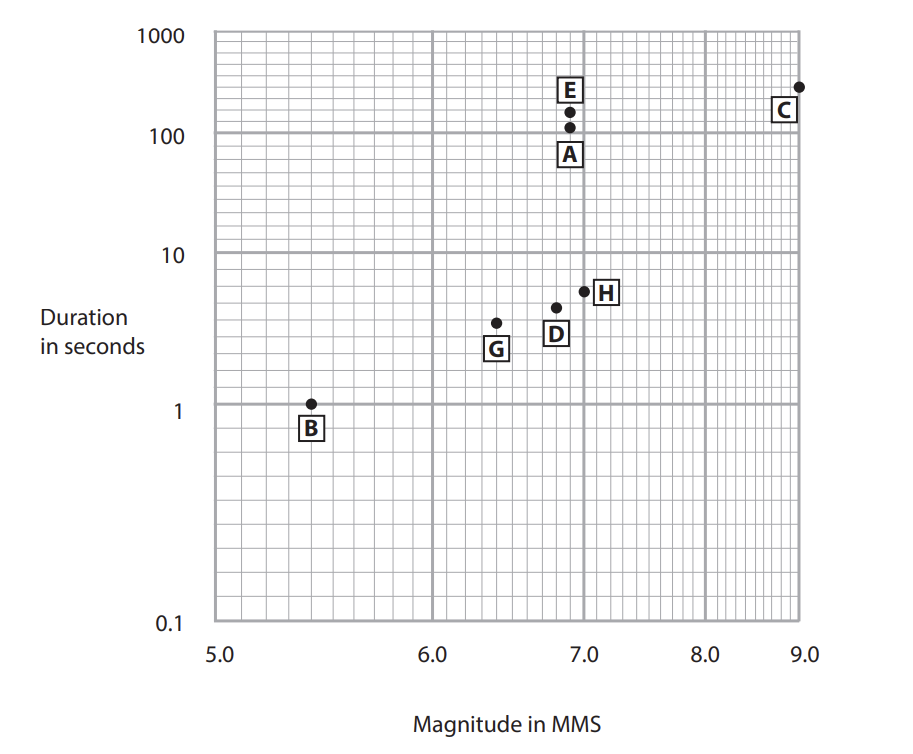
format('truetype')%3Bfont-weight%3Anormal%3Bfont-style%3Anormal%3B%7D%40font-face%7Bfont-family%3A'math190bc3972c7934354efb2af01e7'%3Bsrc%3Aurl(data%3Afont%2Ftruetype%3Bcharset%3Dutf-8%3Bbase64%2CAAEAAAAMAIAAAwBAT1MvMi7iBBMAAADMAAAATmNtYXDEvmKUAAABHAAAAERjdnQgDVUNBwAAAWAAAAA6Z2x5ZoPi2VsAAAGcAAABdWhlYWQQC2qxAAADFAAAADZoaGVhCGsXSAAAA0wAAAAkaG10eE2rRkcAAANwAAAAEGxvY2EAHTwYAAADgAAAABRtYXhwBT0FPgAAA5QAAAAgbmFtZaBxlY4AAAO0AAABn3Bvc3QB9wD6AAAFVAAAACBwcmVwa1uragAABXQAAAAUAAADSwGQAAUAAAQABAAAAAAABAAEAAAAAAAAAQEAAAAAAAAAAAAAAAAAAAAAAAAAAAAAAAAAAAAAACAgICAAAAAg1UADev96AAAD6ACWAAAAAAACAAEAAQAAABQAAwABAAAAFAAEADAAAAAIAAgAAgAAACsAPSIS%2F%2F8AAAArAD0iEv%2F%2F%2F9b%2Fxd3xAAEAAAAAAAAAAAAAAVQDLACAAQAAVgAqAlgCHgEOASwCLABaAYACgACgANQAgAAAAAAAAAArAFUAgACrANUBAAErAAcAAAACAFUAAAMAA6sAAwAHAAAzESERJSERIVUCq%2F2rAgD%2BAAOr%2FFVVAwAAAQCAAFUC1QKrAAsASQEYsgwBARQTELEAA%2FaxAQT1sAo8sQMF9bAIPLEFBPWwBjyxDQPmALEAABMQsQEG5LEBARMQsAU8sQME5bELBfWwBzyxCQTlMTATIREzESEVIREjESGAAQBVAQD%2FAFX%2FAAGrAQD%2FAFb%2FAAEAAAIAgADrAtUCFQADAAcAZRgBsAgQsAbUsAYQsAXUsAgQsAHUsAEQsADUsAYQsAc8sAUQsAQ8sAEQsAI8sAAQsAM8ALAIELAG1LAGELAH1LAHELAB1LABELAC1LAGELAFPLAHELAEPLABELAAPLACELADPDEwEyE1IR0BITWAAlX9qwJVAcBV1VVVAAEAgAFVAtUBqwADADAYAbAEELEAA%2FawAzyxAgf1sAE8sQUD5gCxAAATELEABuWxAAETELABPLEDBfWwAjwTIRUhgAJV%2FasBq1YAAAAAAQAAAAEAANV4zkFfDzz1AAMEAP%2F%2F%2F%2F%2FWOhNz%2F%2F%2F%2F%2F9Y6E3MAAP8gBIADqwAAAAoAAgABAAAAAAABAAAD6P9qAAAXcAAA%2F7YEgAABAAAAAAAAAAAAAAAAAAAABANSAFUDVgCAA1YAgANWAIAAAAAAAAAAKAAAAKEAAAErAAABdQABAAAABABeAAUAAAAAAAIAgAQAAAAAAAQAAN4AAAAAAAAAFQECAAAAAAAAAAEAEgAAAAAAAAAAAAIADgASAAAAAAAAAAMAMAAgAAAAAAAAAAQAEgBQAAAAAAAAAAUAFgBiAAAAAAAAAAYACQB4AAAAAAAAAAgAHACBAAEAAAAAAAEAEgAAAAEAAAAAAAIADgASAAEAAAAAAAMAMAAgAAEAAAAAAAQAEgBQAAEAAAAAAAUAFgBiAAEAAAAAAAYACQB4AAEAAAAAAAgAHACBAAMAAQQJAAEAEgAAAAMAAQQJAAIADgASAAMAAQQJAAMAMAAgAAMAAQQJAAQAEgBQAAMAAQQJAAUAFgBiAAMAAQQJAAYACQB4AAMAAQQJAAgAHACBAE0AYQB0AGgAIABGAG8AbgB0AFIAZQBnAHUAbABhAHIATQBhAHQAaABzACAARgBvAHIAIABNAG8AcgBlACAATQBhAHQAaAAgAEYAbwBuAHQATQBhAHQAaAAgAEYAbwBuAHQAVgBlAHIAcwBpAG8AbgAgADEALgAwTWF0aF9Gb250AE0AYQB0AGgAcwAgAEYAbwByACAATQBvAHIAZQAAAwAAAAAAAAH0APoAAAAAAAAAAAAAAAAAAAAAAAAAALkHEQAAjYUYALIAAAAVFBOxAAE%2F)format('truetype')%3Bfont-weight%3Anormal%3Bfont-style%3Anormal%3B%7D%3C%2Fstyle%3E%3C%2Fdefs%3E%3Ctext%20font-family%3D%22Times%20New%20Roman%22%20font-size%3D%2218%22%20font-style%3D%22italic%22%20text-anchor%3D%22middle%22%20x%3D%222.5%22%20y%3D%2242%22%3Et%3C%2Ftext%3E%3Ctext%20font-family%3D%22math190bc3972c7934354efb2af01e7%22%20font-size%3D%2216%22%20text-anchor%3D%22middle%22%20x%3D%2214.5%22%20y%3D%2242%22%3E%3D%3C%2Ftext%3E%3Cline%20stroke%3D%22%23000000%22%20stroke-linecap%3D%22square%22%20stroke-width%3D%221%22%20x1%3D%2225.5%22%20x2%3D%22129.5%22%20y1%3D%2235.5%22%20y2%3D%2235.5%22%2F%3E%3Ctext%20font-family%3D%22horizontalbf65417dcecc7f2b0006e%22%20font-size%3D%2213%22%20text-anchor%3D%22middle%22%20x%3D%2250.5%22%20y%3D%228%22%3E%26%23x23AF%3B%3C%2Ftext%3E%3Ctext%20font-family%3D%22horizontalbf65417dcecc7f2b0006e%22%20font-size%3D%2213%22%20text-anchor%3D%22middle%22%20x%3D%2254.5%22%20y%3D%228%22%3E%26%23x23AF%3B%3C%2Ftext%3E%3Ctext%20font-family%3D%22horizontalbf65417dcecc7f2b0006e%22%20font-size%3D%2213%22%20text-anchor%3D%22middle%22%20x%3D%2258.5%22%20y%3D%228%22%3E%26%23x23AF%3B%3C%2Ftext%3E%3Ctext%20font-family%3D%22horizontalbf65417dcecc7f2b0006e%22%20font-size%3D%2213%22%20text-anchor%3D%22middle%22%20x%3D%2262.5%22%20y%3D%228%22%3E%26%23x23AF%3B%3C%2Ftext%3E%3Ctext%20font-family%3D%22Times%20New%20Roman%22%20font-size%3D%2218%22%20font-style%3D%22italic%22%20text-anchor%3D%22middle%22%20x%3D%2252.5%22%20y%3D%2222%22%3Ex%3C%2Ftext%3E%3Ctext%20font-family%3D%22Times%20New%20Roman%22%20font-size%3D%2213%22%20text-anchor%3D%22middle%22%20x%3D%2261.5%22%20y%3D%2230%22%3E1%3C%2Ftext%3E%3Ctext%20font-family%3D%22math190bc3972c7934354efb2af01e7%22%20font-size%3D%2216%22%20text-anchor%3D%22middle%22%20x%3D%2277.5%22%20y%3D%2222%22%3E%26%23x2212%3B%3C%2Ftext%3E%3Ctext%20font-family%3D%22horizontalbf65417dcecc7f2b0006e%22%20font-size%3D%2213%22%20text-anchor%3D%22middle%22%20x%3D%2292.5%22%20y%3D%228%22%3E%26%23x23AF%3B%3C%2Ftext%3E%3Ctext%20font-family%3D%22horizontalbf65417dcecc7f2b0006e%22%20font-size%3D%2213%22%20text-anchor%3D%22middle%22%20x%3D%2296.5%22%20y%3D%228%22%3E%26%23x23AF%3B%3C%2Ftext%3E%3Ctext%20font-family%3D%22horizontalbf65417dcecc7f2b0006e%22%20font-size%3D%2213%22%20text-anchor%3D%22middle%22%20x%3D%22100.5%22%20y%3D%228%22%3E%26%23x23AF%3B%3C%2Ftext%3E%3Ctext%20font-family%3D%22horizontalbf65417dcecc7f2b0006e%22%20font-size%3D%2213%22%20text-anchor%3D%22middle%22%20x%3D%22104.5%22%20y%3D%228%22%3E%26%23x23AF%3B%3C%2Ftext%3E%3Ctext%20font-family%3D%22Times%20New%20Roman%22%20font-size%3D%2218%22%20font-style%3D%22italic%22%20text-anchor%3D%22middle%22%20x%3D%2294.5%22%20y%3D%2222%22%3Ex%3C%2Ftext%3E%3Ctext%20font-family%3D%22Times%20New%20Roman%22%20font-size%3D%2213%22%20text-anchor%3D%22middle%22%20x%3D%22103.5%22%20y%3D%2230%22%3E2%3C%2Ftext%3E%3Cpolyline%20fill%3D%22none%22%20points%3D%2214%2C-57%2013%2C-57%206%2C0%202%2C-23%22%20stroke%3D%22%23000000%22%20stroke-linecap%3D%22square%22%20stroke-width%3D%221%22%20transform%3D%22translate(27.5%2C98.5)%22%2F%3E%3Cpolyline%20fill%3D%22none%22%20points%3D%226%2C0%202%2C-23%201%2C-20%22%20stroke%3D%22%23000000%22%20stroke-linecap%3D%22square%22%20stroke-width%3D%221%22%20transform%3D%22translate(27.5%2C98.5)%22%2F%3E%3Cline%20stroke%3D%22%23000000%22%20stroke-linecap%3D%22square%22%20stroke-width%3D%221%22%20x1%3D%2241.5%22%20x2%3D%22127.5%22%20y1%3D%2241.5%22%20y2%3D%2241.5%22%2F%3E%3Cline%20stroke%3D%22%23000000%22%20stroke-linecap%3D%22square%22%20stroke-width%3D%221%22%20x1%3D%2245.5%22%20x2%3D%2273.5%22%20y1%3D%2271.5%22%20y2%3D%2271.5%22%2F%3E%3Ctext%20font-family%3D%22Times%20New%20Roman%22%20font-size%3D%2218%22%20font-style%3D%22italic%22%20text-anchor%3D%22middle%22%20x%3D%2252.5%22%20y%3D%2258%22%3ES%3C%2Ftext%3E%3Ctext%20font-family%3D%22Times%20New%20Roman%22%20font-size%3D%2213%22%20text-anchor%3D%22middle%22%20x%3D%2261.5%22%20y%3D%2266%22%3E1%3C%2Ftext%3E%3Ctext%20font-family%3D%22Times%20New%20Roman%22%20font-size%3D%2213%22%20text-anchor%3D%22middle%22%20x%3D%2268.5%22%20y%3D%2253%22%3E2%3C%2Ftext%3E%3Ctext%20font-family%3D%22Times%20New%20Roman%22%20font-size%3D%2218%22%20font-style%3D%22italic%22%20text-anchor%3D%22middle%22%20x%3D%2255.5%22%20y%3D%2289%22%3EN%3C%2Ftext%3E%3Ctext%20font-family%3D%22Times%20New%20Roman%22%20font-size%3D%2213%22%20text-anchor%3D%22middle%22%20x%3D%2266.5%22%20y%3D%2297%22%3E1%3C%2Ftext%3E%3Ctext%20font-family%3D%22math190bc3972c7934354efb2af01e7%22%20font-size%3D%2216%22%20text-anchor%3D%22middle%22%20x%3D%2284.5%22%20y%3D%2278%22%3E%2B%3C%2Ftext%3E%3Cline%20stroke%3D%22%23000000%22%20stroke-linecap%3D%22square%22%20stroke-width%3D%221%22%20x1%3D%2295.5%22%20x2%3D%22123.5%22%20y1%3D%2271.5%22%20y2%3D%2271.5%22%2F%3E%3Ctext%20font-family%3D%22Times%20New%20Roman%22%20font-size%3D%2218%22%20font-style%3D%22italic%22%20text-anchor%3D%22middle%22%20x%3D%22102.5%22%20y%3D%2258%22%3ES%3C%2Ftext%3E%3Ctext%20font-family%3D%22Times%20New%20Roman%22%20font-size%3D%2213%22%20text-anchor%3D%22middle%22%20x%3D%22111.5%22%20y%3D%2266%22%3E2%3C%2Ftext%3E%3Ctext%20font-family%3D%22Times%20New%20Roman%22%20font-size%3D%2213%22%20text-anchor%3D%22middle%22%20x%3D%22118.5%22%20y%3D%2253%22%3E2%3C%2Ftext%3E%3Ctext%20font-family%3D%22Times%20New%20Roman%22%20font-size%3D%2218%22%20font-style%3D%22italic%22%20text-anchor%3D%22middle%22%20x%3D%22105.5%22%20y%3D%2289%22%3EN%3C%2Ftext%3E%3Ctext%20font-family%3D%22Times%20New%20Roman%22%20font-size%3D%2213%22%20text-anchor%3D%22middle%22%20x%3D%22116.5%22%20y%3D%2297%22%3E2%3C%2Ftext%3E%3C%2Fsvg%3E)
format('truetype')%3Bfont-weight%3Anormal%3Bfont-style%3Anormal%3B%7D%3C%2Fstyle%3E%3C%2Fdefs%3E%3Ctext%20font-family%3D%22Times%20New%20Roman%22%20font-size%3D%2218%22%20font-style%3D%22italic%22%20font-weight%3D%22bold%22%20text-anchor%3D%22middle%22%20x%3D%223.5%22%20y%3D%2230%22%3Et%3C%2Ftext%3E%3Ctext%20font-family%3D%22math11824c643d1feb4da18b28ed527%22%20font-size%3D%2216%22%20font-weight%3D%22bold%22%20text-anchor%3D%22middle%22%20x%3D%2216.5%22%20y%3D%2230%22%3E%3D%3C%2Ftext%3E%3Cline%20stroke%3D%22%23000000%22%20stroke-linecap%3D%22square%22%20stroke-width%3D%221%22%20x1%3D%2227.5%22%20x2%3D%2266.5%22%20y1%3D%2223.5%22%20y2%3D%2223.5%22%2F%3E%3Ctext%20font-family%3D%22Times%20New%20Roman%22%20font-size%3D%2218%22%20font-weight%3D%22bold%22%20text-anchor%3D%22middle%22%20x%3D%2239.5%22%20y%3D%2216%22%3E22%3C%2Ftext%3E%3Ctext%20font-family%3D%22math11824c643d1feb4da18b28ed527%22%20font-size%3D%2216%22%20font-weight%3D%22bold%22%20text-anchor%3D%22middle%22%20x%3D%2252.5%22%20y%3D%2216%22%3E.%3C%2Ftext%3E%3Ctext%20font-family%3D%22Times%20New%20Roman%22%20font-size%3D%2218%22%20font-weight%3D%22bold%22%20text-anchor%3D%22middle%22%20x%3D%2260.5%22%20y%3D%2216%22%3E1%3C%2Ftext%3E%3Ctext%20font-family%3D%22Times%20New%20Roman%22%20font-size%3D%2218%22%20font-weight%3D%22bold%22%20text-anchor%3D%22middle%22%20x%3D%2234.5%22%20y%3D%2241%22%3E4%3C%2Ftext%3E%3Ctext%20font-family%3D%22math11824c643d1feb4da18b28ed527%22%20font-size%3D%2216%22%20font-weight%3D%22bold%22%20text-anchor%3D%22middle%22%20x%3D%2242.5%22%20y%3D%2241%22%3E.%3C%2Ftext%3E%3Ctext%20font-family%3D%22Times%20New%20Roman%22%20font-size%3D%2218%22%20font-weight%3D%22bold%22%20text-anchor%3D%22middle%22%20x%3D%2255.5%22%20y%3D%2241%22%3E43%3C%2Ftext%3E%3C%2Fsvg%3E)