River Enquiry Skills (Edexcel IGCSE Geography)

Topic Questions

1
Sme Calculator
6 marks

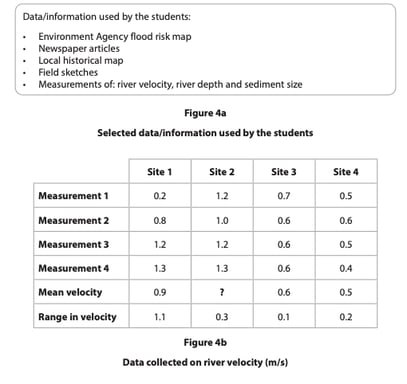
Study Figure 4a . It shows some sample data from one site on a river. A cork float was used to measure the time taken to travel between two points. 

Sample    Time taken (seconds) 
1 13.1
2 15.4
3 16.8 
4  20.0 
5  37.0

Figure 4a 

River data collected by a group of students 

(i)
Calculate the mean time taken for the cork float to travel from site A to site B

Give your answer to one decimal place.

(2)
(ii)
Complete Figure 4b below for samples 1 and 4 using data in Figure 4a.
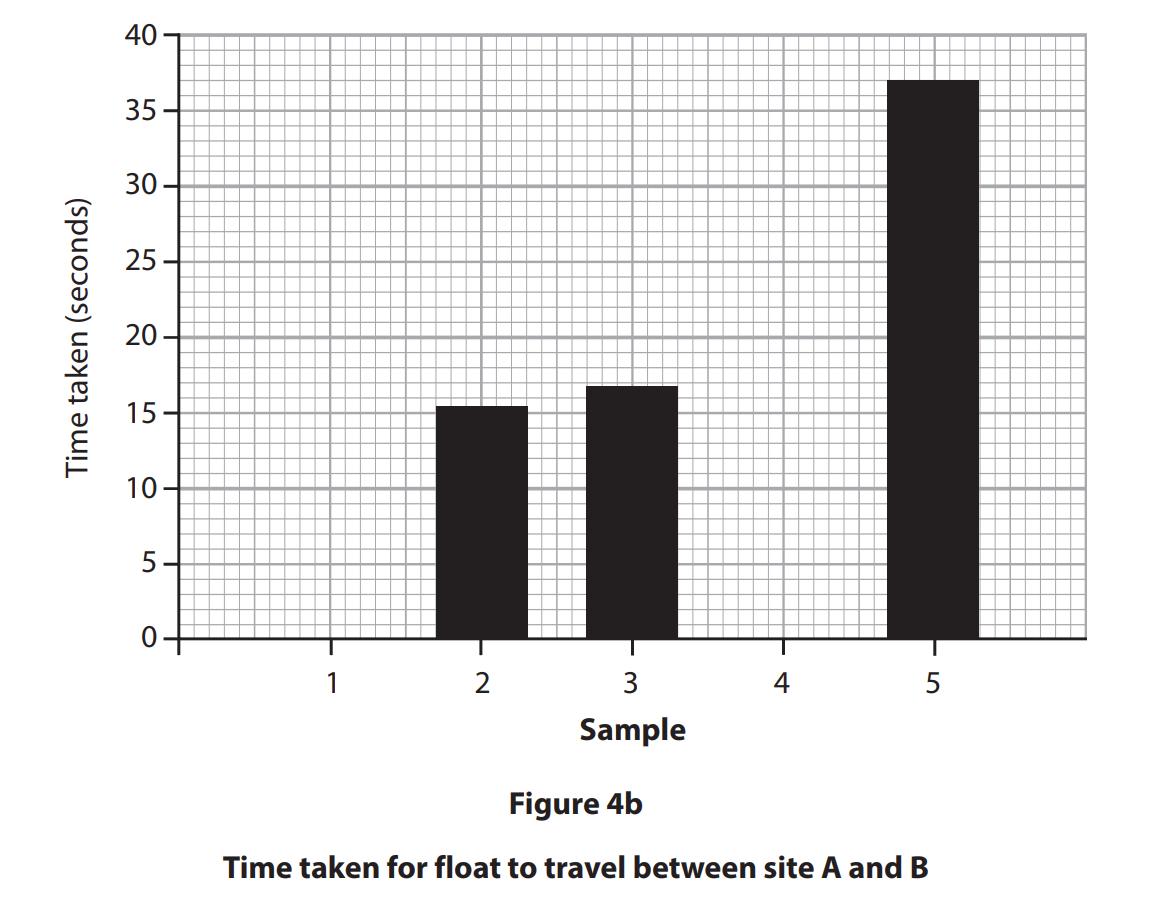
fig-4b-4ge1-01r-june-2019-edexcel-igcse-geography

(2)

(iii)
Sample 5 shows an anomalous result.

Suggest one possible explanation for this
(2)

Did this page help you?

2
Sme Calculator
7 marks
(i)

Study Figure 4a. It shows sample data on velocity from one site on a river. A cork float was used to measure the time taken to travel between two points, A and B. 

Calculate the meantime taken for the cork float to travel between points A and B.

Give your answer to one decimal place.

You must show all your workings in the space below.

(2)

Sample    Time taken (seconds) 
1

21.1 

2

16.0 

3

14.1 

4

15.0 

5

35.0 

Figure 4a 

River data collected by a group of students 

(ii)

Using the data in Figure 4a (in the Resource Booklet), complete Figure 4b below for measurements 1 and 4.

(1)

(iii)
Mark an x in the box on Figure 4b which represents the float with the anomalous result.

(1)
(iv)
Suggest one explanation for this anomaly. 

(3)

q4a-iv-4ge1-01-june-2019-edexcel-igcse-geography

Did this page help you?

31 mark

Study Figure 4a below

Identify one type of primary data used by the students

screenshot-2023-08-15-at-14-20-29

  • Environment Agency flood risk map

  • Field sketches

  • Local historical map

  • Newspaper articles

Did this page help you?

4
Sme Calculator
2 marks

Study Figure 4b which shows some data about river velocity at four sites

Calculate the mean river velocity at Site 2

Give your answer to one decimal place

You must show all your workings

screenshot-2023-08-15-at-14-20-29

Did this page help you?

5a2 marks

Suggest one reason why the data for Site 1 may not be reliable

5b2 marks

Complete Figure 4d below using the data highlighted in Figure 4c

zdhc98AJ_screenshot-2023-08-15-at-14-20-43

screenshot-2023-08-16-at-08-45-29

Did this page help you?

6
Sme Calculator
2 marks

Study Figure 4b which shows some data collected about river velocity

Calculate the mean velocity

Give your answer to one decimal place

You must show all your workings 

screenshot-2023-08-16-at-09-04-13

Did this page help you?

7a2 marks

Complete Figure 4d, using the data highlighted in figure 4c

screenshot-2023-08-16-at-09-04-19

screenshot-2023-08-16-at-09-21-57

7b2 marks

Identify two ways the students could have improved the reliability of the data collected

Did this page help you?

1
Sme Calculator
8 marks

You have studied river environments for your geographical enquiry. 

Evaluate how successful your chosen data analysis methods were in answering your geographical enquiry question.

Enquiry question.

Did this page help you?

2
Sme Calculator
8 marks

You have studied river processes as part of your own geographical enquiry.  

Evaluate the effectiveness of the data collection methods in relation to the purpose of the study. 

Enquiry question .    

Did this page help you?

38 marks

Study Figure 4 below. It shows some information about methods used, data collected and a conclusion.


The aim of the student’s enquiry was to examine change in river channel shape along the course of a river.


Evaluate how far the student’s data presentation methods and analysis helped the student to make their conclusions.

screenshot-2023-08-14-at-13-27-04

Did this page help you?

1a
Sme Calculator
4 marks

Describe two sources of secondary information that might be useful in planning a river channel investigation. 

1b
Sme Calculator
3 marks

Suggest why one of the sampling methods named in (b)(i) would be appropriate to use in a river channel investigation. Sampling method

Did this page help you?

2
Sme Calculator
4 marks

To extend the river study, students were asked to use one additional quantitative and one qualitative technique.
Describe two additional fieldwork techniques the students may have selected. 

Quantitative     

Qualitative     

Did this page help you?

3
Sme Calculator
5 marks
(i)
Suggest one possible aim of a river channel investigation
(2)
(ii)
Identify three reasons why a river channel investigation might not achieve the aim given in (c)(i). 
(3)

Did this page help you?

43 marks

Explain one advantage of using a line graph to present results

Did this page help you?