CIE IGCSE Biology

Topic Questions

18.1 Variation & Natural Selection

1
Sme Calculator
4 marks

Fig. 1 shows a group of male students. They are all the same age.

P8Lp6ctB_image

Fig. 1

(i)

The students in Fig. 1 show continuous variation in some of their characteristics.

State three characteristics in which these students show continuous variation.

[3]

(ii)

State one example of discontinuous variation.

[1]

Did this page help you?

2a
Sme Calculator
2 marks

Selective breeding of animals is very important to farmers.

Many different breeds of sheep have been produced by selective breeding.

Fig. 1 shows a flock of Merino sheep. This breed of sheep was produced by selective breeding.

0610p31q10a

Fig. 1

Sheep are important animals in many parts of the world as they produce meat, wool and milk.

Table 1 describes some characteristics of five different breeds of sheep.

Table 1

breed of sheep wool yield wool quality meat yield milk yield
Arapawa average good poor average
Awassi average poor average very good
Blackbelly poor poor very good average
Merino good very good good poor
Tsurcana average good average average

A farmer wants to sell both meat and wool.

Suggest which breed of sheep in Table 1 is the most suitable for this farmer. 

Give a reason for your choice. 

2b
Sme Calculator
4 marks

Another farmer wants to produce a new breed of sheep with both a very good milk yield and a very good quality of wool.

The farmer is able to buy any of the breeds of sheep shown in Table 1.

Describe the process this farmer would use to produce the new breed of sheep on her farm. 

Did this page help you?

3a
Sme Calculator
1 mark

Extended only

An ecologist studied variation in a species of xerophyte.

Xerophytes are adapted to a particular type of environment.

State this type of environment.

3b
Sme Calculator
3 marks

The ecologist studied the features of the leaves in the species of xerophyte.

Fig. 1 shows the variation in the type of leaf spike.

_TD9byGI_image

Fig. 1

(i)
State the type of variation shown in Fig. 1.

[1]

(ii)
Explain why the type of leaf spike is an example of the variation shown in Fig. 1.
[2]
3c
Sme Calculator
2 marks

The ecologist also measured other features of the leaves.

Fig. 2 shows the variation in leaf feature B.

OI0XG6v7_image

Fig. 2

State two named features of leaves that show the type of variation shown in Fig. 2.

3d
Sme Calculator
1 mark

After one year, the ecologist recorded the variation in leaf feature B again.

The results are shown in Fig. 3.

u2wOTig3_image

Fig. 3

Suggest one reason for the difference in variation of leaf feature B after one year.

Did this page help you?

1a
Sme Calculator
3 marks

Extended only

Compare natural selection with artificial selection.

1b
Sme Calculator
4 marks

Selective breeding is an example of artificial selection. 

The Wild Mustard plant has undergone extensive selective breeding for hundreds of years.

Fig. 1 shows the outcome of this selective breeding and the traits that have been selected for. 

mustard-plant

Fig. 1 

Outline how selective breeding of the Wild Mustard plant has led to the development of the Kale plant. 

1c
Sme Calculator
4 marks

Extended only

Streptomycin is an antibiotic. 

Table 1 shows results scientists collected from a study examining the effect of streptomycin on a bacterial population over fifteen generations.

The bacterial population consisted of organisms of two variants (X and Y).

Table 1

generation frequency of variant X in the population frequency of variant Y in the population
1 52 51
2 55 49
3 64 44
4 66 41
5 73 38
6 76 32
7 81 26
8 85 21
9 89 16
10 94 12
11 98 8
12 99 5
13 99 2
14 99 1
15 99 1

Describe and explain the data shown in Table 1. 

1d
Sme Calculator
4 marks

Explain the process that has led to the results shown by variant X in Table 1. 

Did this page help you?

2a
Sme Calculator
2 marks

Extended only

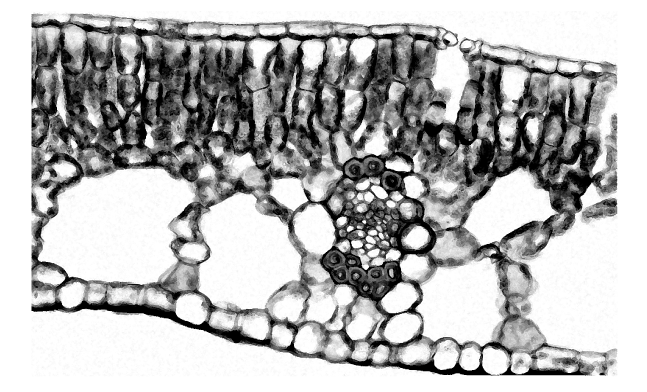
Fig. 1 shows a micrograph of a leaf from a desert plant. 


micro-1

Fig. 1

Identify and label two adaptive features visible in Fig. 1.

2b
Sme Calculator
2 marks

Extended only

For one of the features identified in part (a), explain how this is an adaption for the plant.

2c
Sme Calculator
2 marks

Extended only

Fig. 2 shows a micrograph of a leaf from a different type of plant. 


micro-2

Fig. 2

Suggest and explain what type of plant this leaf may be from.

2d
Sme Calculator
6 marks

A student investigated the submergence of leaves from plants in a pond and the depth of the roots within sediment. 

Table 1 shows their results. 

Table 1

submergence of leaf within  pond depth of roots within sediment / cm
floating 58

partially submerged

35

fully submerged 23

(i)

Explain which type of data is shown by the depth of roots within the sediment.

[2]

(ii)

Explain which type of graph would best display this data.

[2]

(iii)

Suggest a conclusion for the data.

[2]

Did this page help you?

3a
Sme Calculator
5 marks

Extended only

Scientists investigated mutations in ants by exposing them to UV rays. Their results are shown in Fig. 1.

uv-radiation

Fig. 1

(i)

Explain why is meant by a mutation. 

[1]

(ii)

Describe and explain the results in Fig. 1.

[2]

(iii)

Calculate the percentage change in mutations from the first dose of UV radiation to the last. 

[2]

3b
Sme Calculator
2 marks

Extended only

Explain whether all mutations are harmful or not.

3c
Sme Calculator
3 marks

Fig. 2 shows an ant. 


ant

Fig. 2

Use the information in Fig. 2 to determine the kingdom, phylum and class of ants. 

3d
Sme Calculator
4 marks

There are more than 12 000 known species of ants.  Fig. 3 shows a fossilised ant that was embedded in amber about 20 million years ago.

The physical form of ants has barely changed throughout their history. 


ant-micro

Fig. 3

Image courtesy of Wikimedia Commons: https://commons.wikimedia.org/wiki/File:Extinct_fungus-growing_ant_(23411374650).jpg

Insects Unlocked, CC0, via Wikimedia Commons 

Suggest an explanation for what this tells you about the adaptive features of ants.  

Did this page help you?

1a
Sme Calculator
2 marks

All commercial breeds of sheep belong to the species Ovis aries.

Define the term species.

1b
Sme Calculator
2 marks

The Merino is a breed of sheep that is farmed mainly for its wool. The wool is very thick and is made of lots of very thin hairs.

Fig. 1 shows a female Merino sheep with her newborn lamb.

cie-igcse-2019-paper4-1b

Fig. 1

The presence of hair is a feature that is only found in mammals.

State two other features that distinguish mammals from all other vertebrates.

1c
Sme Calculator
5 marks

Merino sheep in South Africa have high quality wool with very thin hairs.

Breeders in New Zealand have used selective breeding programmes to improve the wool of their sheep to match the quality of South African wool.

Describe the steps that breeders would take to breed sheep that have wool with very thin hairs.

1d
Sme Calculator
3 marks

Extended Only)

Explain how natural selection differs from selective breeding.

Did this page help you?

2a
Sme Calculator
1 mark

Blood group is an example of discontinuous variation.

The blood groups of patients in a hospital were recorded.

Fig. 1 shows the results.

cie-igcse-2018-s2-may-p3-q8a-blood-group-variation

Fig. 1

Explain how Fig. 1 shows that blood group is an example of discontinuous variation.

2b
Sme Calculator
2 marks

Table 1 shows different examples of variation.

Tick all the boxes that show examples of discontinuous variation.

Table 1

Attached or unattached earlobes  
Foot length  
Height  
Tongue rolling  
Weight  
2c
Sme Calculator
3 marks

Variation can be caused by mutation.

The word mutation can be connected to the words in the boxes on the right to make a complete sentence.

Draw three lines to join the word ‘mutation’ to the words in the boxes to make three correct sentences.

cie-igcse-2018-s2-may-p3-q8c-mutation-question

Did this page help you?

3a
Sme Calculator
2 marks

Coat colour in horses is controlled by genes.

The allele for black coat (E) is dominant.

The allele for red coat (e) is recessive.

Place ticks in the table to show the coat colours of horses with each of the following genotypes.

genotype black coat red coat
EE    
Ee    
ee    
3b
Sme Calculator
1 mark

Modern horse breeds look very different to each other, but still belong to the same species.

Fig. 1 shows three different horse breeds.

screenshot-2022-10-05-17-14-12

Fig. 1

State the term used to describe the difference between individuals of the same species.

3c
Sme Calculator
3 marks

Shire horses have been produced by selective breeding. They are strong and can pull heavy loads.

Describe the process of selective breeding.

3d
Sme Calculator
2 marks

Describe how natural selection differs from selective breeding.

Did this page help you?