Scatter Graphs (Edexcel GCSE Maths: Foundation)

Revision Note

Test Yourself
Mark

Author

Mark

Expertise

Maths

Correlation

What is correlation?

  • Correlation describes how two quantities are related to each other
  • Positive correlation is when one quantity increases and the other quantity increases
    • For example, as temperature increases, sales of cold drinks increase
  • Negative correlation is when one quantity decreases while the other quantity increases
    • For example, the value of a car decreases as its age increases
  •  No (zero) correlation is where there is no apparent relationship
    • For example, the masses of snails and scores in an exam

What does the phrase "correlation does not imply causation" mean?

  • If two quantities correlate, it does not mean that the first causes the second
  • For example, each day you record the height of a sunflower and the weight of a puppy
    • As the height of the sunflower increases, the weight of the puppy increases
      • This is a positive correlation
    • But you cannot claim that:
      • If you want your puppy to weigh more, make your sunflower taller!
      • Sunflowers grow better when puppies are heavier!
    • Both quantities may be increasing due to another reason
      • In this case, time

Scatter Graphs

What are scatter graphs?

  • Scatter graphs (or scatter diagrams) are used to plot pairs of data
    • For example, students' Maths grades against their Physics grades
  • The vertical and horizontal axes represent the two quantities being measured
  • Points are plotted as crosses, ×
    • They are not joined up
  • The general shape formed by the points shows the type of correlation
    • Positive correlation goes from bottom left to top right
      • A positive gradient
    • Negative correlation goes from top left to bottom right
      • A negative gradient
    • No (zero) correlation looks like a cloud of points

Positive correlationnegative correlationNo correlation

Line of Best Fit

What is a line of best fit?

  • If a scatter graph suggests that there is a positive or negative correlation
    • a line of best fit can be drawn on the scatter graph
      • This can then be used to make predictions

How do I draw a line of best fit?

  • line of best fit is drawn on by eye
    • It is a single-ruled straight line
    • It must extend across the full data set
    • It does not need to pass through any particular point(s)
    • There should roughly be as many points on either side of the line (along its whole length)
  • If there is one extreme value (outlier) that does not fit the general pattern
    • Ignore this point when drawing a line of best fit

Exam Tip

  • Sliding a ruler around a scatter graph can help to find the right position for the line of best fit!

Worked example

Sophie wants to know if the price of a computer is related to the speed of the computer.
She tests 8 computers by running the same program on each, measuring how many seconds it takes to finish.
Sophie's results are shown in the table below.

Price (£) 320 300 400 650 250 380 900 700
Time (secs) 3.2 5.4 4.1 2.8 5.1 4.3 2.6 3.7

(a)

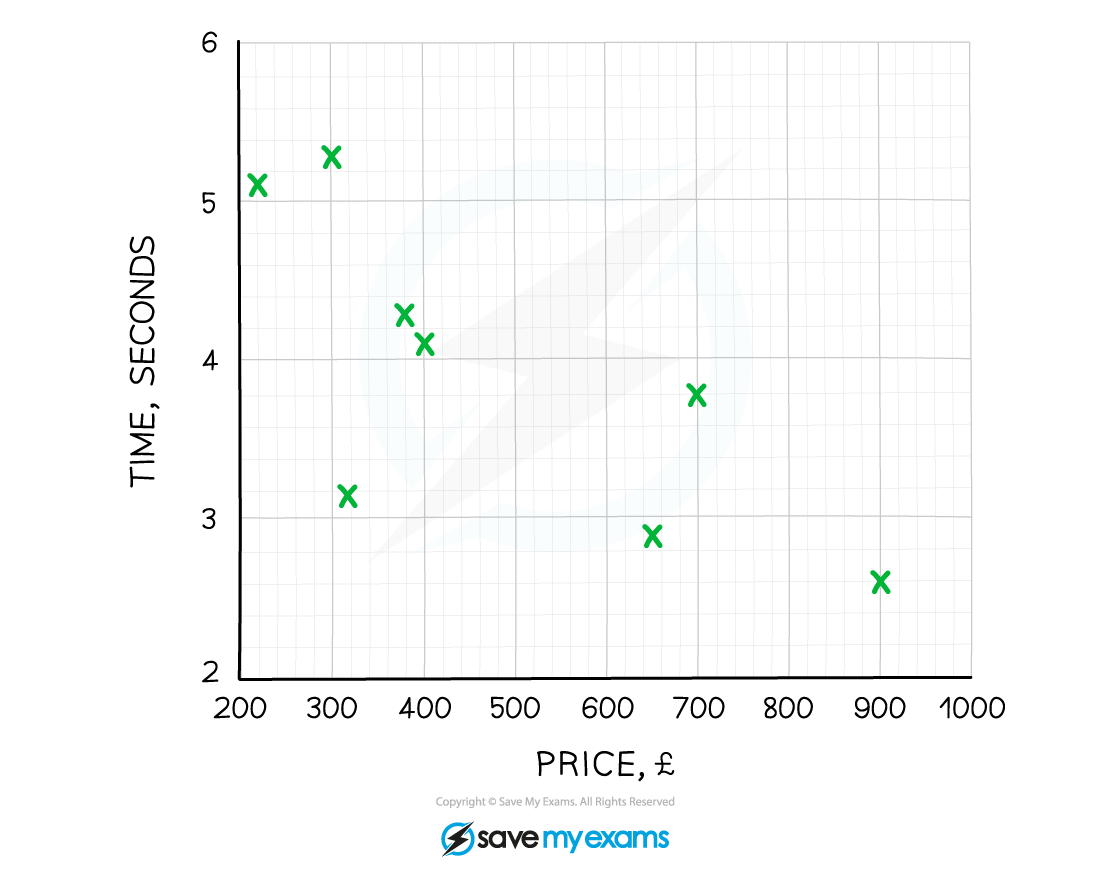
Draw a scatter diagram, showing the results on the axes below.
 

Plot each point carefully using crosses 

A scatter diagram for time against price


(b)

Write down the type of correlation shown and use it to form a suitable conclusion. 
 

The shape formed by the points goes from top left to bottom right (a negative gradient)
This is a negative correlation
As one quantity increases (price), the other decreases (time)

The graph shows a negative correlation
This means that the more a computer costs, the quicker it is at running the program


(c)

Use a line of best fit to estimate the price of a computer that completes the task in 3.4 seconds.
  

First draw a line of best fit, by eye
Then draw a horizontal line from 3.4 seconds to the line of best fit
Draw a vertical line down to read off the price
 
A line of best fit drawn on a scatter diagram

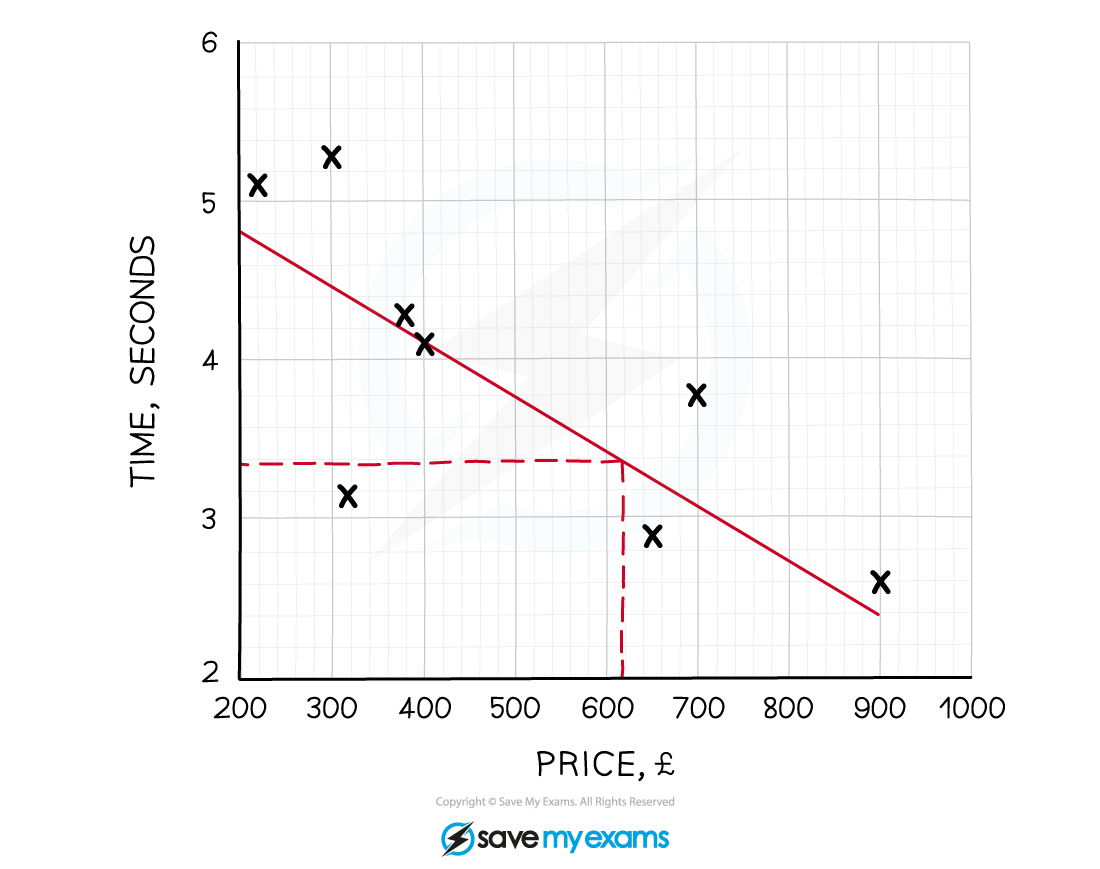
A computer that takes 3.4 seconds to run the program should cost around £620

A range of different answers will be accepted, depending on the line of best fit

You've read 0 of your 0 free revision notes

Get unlimited access

to absolutely everything:

  • Downloadable PDFs
  • Unlimited Revision Notes
  • Topic Questions
  • Past Papers
  • Model Answers
  • Videos (Maths and Science)

Join the 100,000+ Students that ❤️ Save My Exams

the (exam) results speak for themselves:

Did this page help you?

Mark

Author: Mark

Mark graduated twice from the University of Oxford: once in 2009 with a First in Mathematics, then again in 2013 with a PhD (DPhil) in Mathematics. He has had nine successful years as a secondary school teacher, specialising in A-Level Further Maths and running extension classes for Oxbridge Maths applicants. Alongside his teaching, he has written five internal textbooks, introduced new spiralling school curriculums and trained other Maths teachers through outreach programmes.