Fieldwork (AQA GCSE Geography)

Topic Questions

1a1 mark

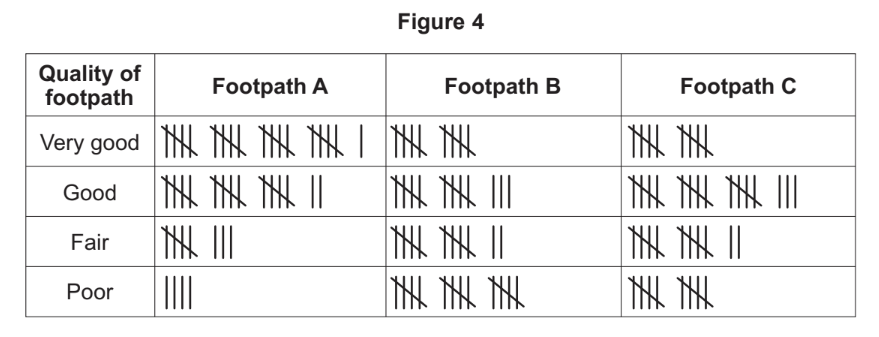
Study Figure 4, information collected by students about visitors to Bournemouth, a coastal town in Dorset.

fig-4-june-2018-paper3-qp-gcse-aqa-geo

(a)
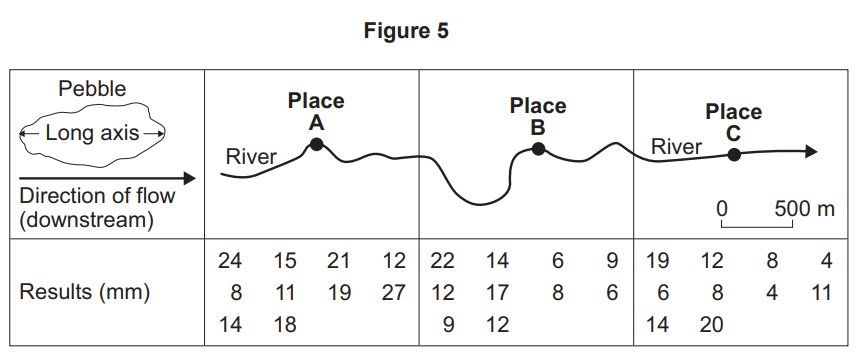
Complete the map below (Figure 5) to show the origin of visitors to Bournemouth using the following data.

Yorkshire and the Humber 6%
fig-5-june-2018-paper3-qp-gcse-aqa-geo
1b2 marks
(b)
Describe the pattern shown by Figure 5. 
1c2 marks
(c)
(a)
Suggest one additional question which could be included on the visitor survey.

(b)
Give one reason why your chosen question might provide useful information for the visitor survey.
1d2 marks
(d)
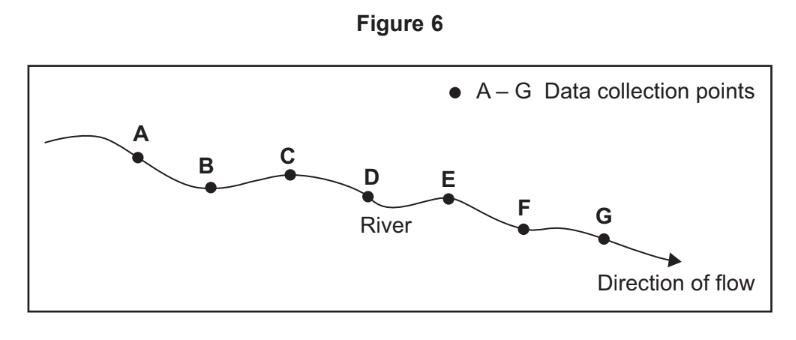
Study Figure 6, information about visitor numbers to the main tourist attractions in a city.

Figure 6

Visitor numbers to main tourist
attractions (thousands)
January 80
February 110
March 120
April 180
May 220
June 230
July 270
August 310
September 200
October 190
November 100
December 120

A student used the following presentation method (Figure 7) to show the information in Figure 6

fig-7-june-2018-paper3-qp-gcse-aqa-geo

(a)
Suggest a more appropriate method for presenting the data shown in Figure 6.

(b)
Give a reason for your choice.

Did this page help you?

2a1 mark

As part of a geographical enquiry box , students carried out an environmental quality survey in one part of a town centre. The results are shown in Figure 8.

Figure 8

  -2 -1 0 +1 +2  
Lots of traffic pollution       ✓   No traffic pollution
Lots of litter ✓         No litter
Unattractive buildings         ✓ Attractive buildings
Lots of vandalism   ✓       No vandalism
No landscaping         ✓ Good landscaping

(a)
What is the total environmental quality score for the area shown in Figure 8?
2b2 marks
(b)
Suggest one advantage and one disadvantage of using the technique shown in Figure 8 to measure environmental quality.

Advantage

Disadvantage
2c1 mark

Students studied two different rivers over a distance of 1000 metres. For each river box they measured the depth at a number of sites. The results are shown on Figure 9.

fig-9-june-2018-paper3-qp-gcse-aqa-geo

(c)
Complete the scattergraph for River B by plotting the following data.
Distance from source – 450 m
Depth of river – 22 cm
2d1 mark
(d)
Draw a line of best fit on the scattergraph for River B.

Did this page help you?

3a2 marks

Write the title of your physical geography fieldwork enquiry

(a)
Explain why the chosen location was suitable for the collection of data.
3b3 marks
(b)
Justify one primary data collection method used in your physical geography enquiry.

Did this page help you?

4a2 marks

Study Figure 4, a table showing information collected by students about housing development in four areas on the edge of a town.

Figure 4

Area Original area
of countryside
(hectares)
Area lost
to housing
developments
(hectares)
Remaining
countryside
(hectares)
% loss of
countryside
A 240 24 216 10
B 320 160 160  
C 260 39 221 15
D 420 84   20

(a)
Complete the table (Figure 4) by filling in the data for Area B and Area D.
4b1 mark

Study Figure 5, showing information from a survey of 100 people in a coastal area.

Figure 5

What is your main reason for visiting this
coastal area?
Responses
Visiting friends/relatives 6
Swimming/sporting activities 46
Quality/safety of the beach 34
Nearest beach to where we live 8
Other reasons 6

(b)
Complete the pie chart below to show the information for Figure 5.

04-2-june-2019-paper3-qp-gcse-aqa-geo
4c1 mark

Study Figure 6, part of a student’s planning sheet in a fieldwork enquiry.

fig-6-june-2019-paper3-qp-gcse-aqa-geo

(c)
Name the type of sampling method used in Figure 6.
Shade one circle only.
  • Opportunity sampling, selecting points which are easiest to access

  • Random sampling, based on chance

  • Stratified sampling, where more points are chosen from one area

  • Systematic sampling where points are chosen at regular intervals

4d2 marks
(d)
Suggest why the type of sampling shown in Figure 6 is not always possible in a fieldwork enquiry.
4e1 mark

Study Figures 7a and 7b, part of a contour map and a cross section used in a river enquiry.

fig-7a-and-7b-june-2019-paper3-qp-gcse-aqa-geo

(e)
Complete the cross-section from X–Y on Figure 7b.
4f1 mark
(f)
Describe the slope of the land from point X to the river.
4g2 marks

Study Figure 8, information about a questionnaire survey.

fig-8-june-2019-paper3-qp-gcse-aqa-geo

(g)
Suggest two ways that students might adapt their method in order to obtain more appropriate data.
4h2 marks
(h)
Suggest two additional data collection techniques that the students could use to find out if local facilities are good enough for the older population.

Did this page help you?

5a2 marks

Write the title of your physical geography fieldwork enquiry.

Title of physical fieldwork enquiry ________.

(a)
Suggest why one set of data you collected in your physical fieldwork enquiry may not have been accurate.

5b3 marks
(b)
Identify one potential risk in your physical geography fieldwork and explain how the risk was reduced.


Risk ________.

How the risk was reduced ______.

Did this page help you?

6a1 mark

A student wanted to carry out a human geography enquiry in their local town by investigating the question ‘Does the town centre have a parking problem?’

In order to do this the student carried out primary research, including a questionnaire and a car park survey.

Study Figure 4, which shows the results of the questionnaire and car park survey.

fig-4-june-2020-paper3-qp-gcse-aqa-geo

(a)
Complete the pie chart below to show the results of Question 2 in the questionnaire (Figure 4).
o4-1-june-2020-paper3-qp-gcse-aqa-geo
6b2 marks
(b)
Using Figure 4, describe the pattern shown by the results of the car park survey.
6c1 mark

A group of students wanted to investigate the hypothesis that ‘The size of pebbles in a river is smaller as the river flows downstream’.

In order to do this the students measured the long axis of ten pebbles from three different places (A, B and C) along the river.

Study Figure 5, a table showing the results of the survey.

fig-5-june-2020-paper3-qp-gcse-aqa-geo

(c)
Complete the diagram below by filling in the median pebble size for place C.

04-4-june-2020-paper3-qp-gcse-aqa-geo
6d2 marks
(d)
Outline the conclusions that the students could draw from the data.
6e2 marks
(e)
Suggest two ways that the data collection method could be adapted in order to make it more useful.

Did this page help you?

7a1 mark

A student wanted to investigate deprivation in an area of a city. As part of their enquiry they used the following secondary data (Figure 6).

Figure 6

Life expectancy (years) 1981 1991 2001 2011
Study area 67 68 68 70
City average 72 73 77 78

(a)
Complete the graph below to show life expectancy in the study area.

04-7-june-2020-paper3-qp-gcse-aqa-geo
7b1 mark
(b)
In 2001, how many years lower was life expectancy in the study area than the city average?
7c2 marks
(c)
Suggest two types of primary data that the student could use in their urban deprivation enquiry.

Did this page help you?

8a2 marks
(a)
For one of your fieldwork enquiries, suggest how anomalies in your data could affect your fieldwork enquiry.
Title of fieldwork enquiry _______________
8b3 marks

Write the title of your human geography fieldwork enquiry.

Title of human fieldwork enquiry ___________________

(b)
Justify the use of one of the following in your human geography enquiry:
  • maps
  • photographs
  • field sketches.

Did this page help you?

9a1 mark

A group of students wanted to investigate if the quality of footpaths varied in a National Park. Students asked 50 people their opinions on the quality of three footpaths (A, B and C).

Study Figure 4, a table showing the results of their survey.

fig-4-nov-2021-paper3-qp-gcse-aqa-geo

(a)
Complete the graph below (Figure 5) to show the quality of footpath data for Footpath C.

fig-5-nov-2021-paper3-qp-gcse-aqa-geo

9b1 mark
(b)
What percentage of visitors thought the quality of Footpath C was very good?
9c2 marks
(c)
Outline the conclusions that the students could make from the data (Figure 4).

9d
Sme Calculator
1 mark
(d)
Suggest another appropriate method the students could use to present the footpath quality data.
9e2 marks
(e)
A student wanted to investigate how far people travelled to an out-of-town shopping centre and how long they stayed there. The student visited the shopping centre and used a questionnaire to collect data from 20 people.
Figure 6 shows the questionnaire used by the student.

Figure 6

Visitor questionnaire
1 How old are you?
2 Where do you live?
3 When did you last visit?
4 What method of transport did you use?

Suggest two ways the questionnaire shown in Figure 6 could be improved to make it more useful.

9f
Sme Calculator
1 mark

Figure 7 is a pictogram showing the results for Question 4 in the questionnaire (Figure 6).

fig-7-nov-2021-paper3-qp-gcse-aqa-geo

(f)
Complete Figure 7 by adding the following information.

Type of transport Percentage of shoppers
Bus 20%
Car 40%
9g1 mark

The student used the data they collected to draw a desire line map (Figure 8) to show where people came from when visiting the out-of-town shopping centre.

fig-8-nov-2021-paper3-qp-gcse-aqa-geo

(g)
Complete the desire line map (Figure 8) by adding the following information about a shopper.

Direction travelled from South east
Distance travelled 15 km
9h2 marks
(h)
Suggest reasons for the pattern shown on Figure 8.
9i1 mark

A group of students wanted to carry out an investigation into the decline of the high street. They counted the number of charity shops in three town centres (A, B and C).

Figure 9 shows the results of the survey in Town centre A.

fig-9-nov-2021-paper3-qp-gcse-aqa-geo

(i)
Complete the table below (Figure 10) for town centre A.

Figure 10

fig-10-nov-2021-paper3-qp-gcse-aqa-geo

Did this page help you?

19 marks

To what extent did the data collected for one of your enquiries allow you to reach valid conclusions?

Title of fieldwork enquiry _________.

Did this page help you?

29 marks

For one of your fieldwork enquiries, to what extent did your results and conclusions meet the original aim of your enquiry?

Title of fieldwork enquiry _________________

Did this page help you?

39 marks

For one of your fieldwork enquiries, assess the extent to which the accuracy of the box results and the reliability of the conclusions could be improved.

Did this page help you?

14 marks

Compare the relationship between distance from source and depth of river for the two rivers.screenshot-2023-11-23-at-13-25-30

Did this page help you?

2a6 marks

Write the title of your human geography fieldwork enquiry.

Title of fieldwork enquiry

(a)
Explain how one data presentation technique used in your human geography enquiry helped you to interpret the data.
2b9 marks
(b)
For one of your fieldwork enquiries, assess the extent to which the accuracy of the box results and the reliability of the conclusions could be improved.

Did this page help you?

34 marks

Study Figure 9, a housing quality survey from twelve different areas of a town.

fig-9-june-2019-paper3-qp-gcse-aqa-geo

Assess the usefulness of measures of central tendency, such as median, mean and mode, in analysing the housing quality data collected by the students.

Did this page help you?

46 marks

Write the title of your human geography fieldwork enquiry.

Title of human fieldwork enquiry _______.

Assess the suitability of the location chosen for your human geography enquiry.

Did this page help you?

54 marks

To what extent can the student draw reliable conclusions from the data?

screenshot-2023-06-21-at-13-26-00
screenshot-2023-06-21-at-13-26-06

Did this page help you?

66 marks

Write the title of your physical geography fieldwork enquiry.

Title of physical fieldwork enquiry ________________

Assess the effectiveness of your data collection method(s).

Did this page help you?

74 marks

Using Figure 10, compare the proportion of charity shops between the three town centres.

screenshot-2023-06-21-at-13-34-58

Did this page help you?