Glacial Landscapes in the UK (AQA GCSE Geography)

Topic Questions

1a1 mark

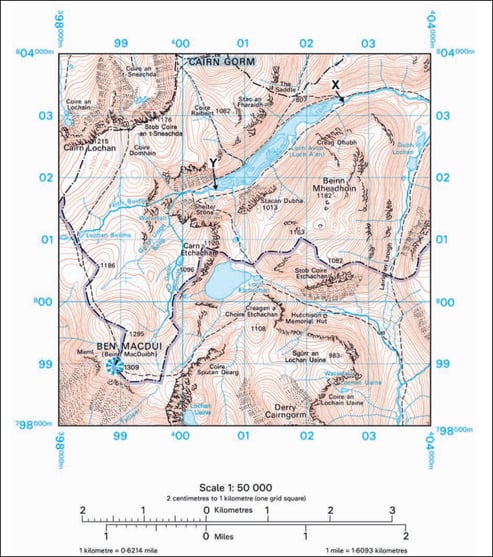
Study Figure 15, a 1:50 000 Ordnance Survey map of part of the Cairngorm Mountains in Scotland.

Bw-nsvF__fig-15-june-2018-paper1-insert-gcse-aqa-geo

(a)
Using Figure 15, which grid square matches the following description?
‘There is a valley with a stream in the north. The land rises steeply southwards. It becomes more gentle towards the summit in the south, reaching a height of almost 1000 metres.’
Shade one circle only.
  • 0201

  • 0299

  • 9900

  • 9902

1b1 mark
(b)
Locate Loch Avon centred in grid square 0102. What is the length (between points X and Y) and maximum depth of Loch Avon?
Shade one circle only.
  • Length 2.5 km, maximum depth over 30 metres

  • Length 4.6 km, maximum depth 30 metres

  • Length 2.1 km, maximum depth 40 metres

  • Length 4.8 km, maximum depth over 40 metres

1c1 mark
(c)
Suggest one reason for the shape of Loch Avon.

Did this page help you?

22 marks

Study Figure 19, a map showing the extent of ice cover across the British Isles during the last ice age.

fig-19-june-2019-paper1-qp-gcse-aqa-geo

Using Figure 19, describe the extent of ice cover across the British Isles during the last ice age.

Did this page help you?

32 marks

Glacial landscapes in the UK

Study Figure 20, below, a physical map of the British Isles.

Match the following descriptions of glaciated uplands in the UK with the correct letter shown on Figure 20.

Description of glaciated upland area Letter
A mountainous area that includes the highest point in Wales  
A large mountainous area in Scotland where the highest point is over 1300 m  

fig-20-june-2020-paper1-qp-gcse-aqa-geo

Did this page help you?

4a1 mark

Glacial landscapes in the UK

Study Figure 15, a 1:50 000 Ordnance Survey map showing part of Snowdonia in Wales.

fig-15-nov-2021-paper-1-aqa-gcse-geography

(a)
Using Figure 15, what is the difference in height between the spot height at 556577 and the spot height at 532577?
4b2 marks
(b)
Using Figure 15, describe the land use shown in the highlighted grid square 5456.
4c1 mark
(c)
Using Figure 15 (above) and Figure 16 (below), identify the grid square where point X is located. Shade one circle only.
  • 5555

  • 5354

  • 5654

  • 5554

4d1 mark

Study Figure 16 (below), a photograph looking northwest across Llyn Cwellyn shown on Figure 15 (above).

fig-16-nov-2021-paper-1-aqa-gcse-geography

(d)
Using Figure 16, suggest one piece of evidence that shows this area was glaciated.

Did this page help you?

5a1 mark

Study Figure 16, a photograph of Loch Etchachan, with Ben Macdui (989989) in the background.

fig-16-june-2018-paper1-qp-gcse-aqa-geo

Figure 15, a 1:50 000 Ordnance Survey map showing part of Carin Gorms in Scotland.

image-15

(a)
Using Figures 15 and 16, in which direction was the photographer facing when the picture was taken?
Shade one circle only.
  • South east

  • South west

  • North west

  • North east

5b1 mark
(b)
Describe one feature of the corrie at Z on Figure 16.

Did this page help you?

6a1 mark

Study Figure 20, showing the size of glacial sediment at two locations.

fig-20-june-2019-paper1-qp-gcse-aqa-geo

(a)
Complete the table in Figure 20 by calculating the range of sediment size, in cm, at location B.
6b1 mark
(b)
Suggest one reason for the difference in the range of sediment size between location A and location B.

Did this page help you?

71 mark

Which of these is a process of glacial erosion?

Shade one circle only.

  • Freeze-thaw

  • Plucking

  • Rotational slip

  • Transportation

Did this page help you?

8a1 mark

Study Figure 21, a contour map and cross section showing 6 drumlins labelled A–F.

fig-21-june-2020-paper1-qp-gcse-aqa-geo

(a)
Describe the shape of the drumlins shown in Figure 21.
8b1 mark
(b)
Using Figure 21, calculate the mean maximum height of the 6 drumlins.
8c1 mark
(c)
Using evidence from Figure 21, suggest the general direction of movement of ice when the drumlins were formed.

Did this page help you?

9a1 mark

Glacial landscapes in the UK

Study Figure 17, a map showing the depth and extent of ice during the last ice age in Europe.

Figure 17

figure-17-june-2022-paper-1-aqa-gcse-geography

Figure 18 is a partly completed cross section of ice depth between X and Y shown on Figure 17.

Figure 18

figure-18-june-2022-paper-1-aqa-gcse-geography

Using Figure 17, complete Figure 18, a cross section showing the depth of ice between X and Y.

9b1 mark

Using Figure 17, compare the maximum depth of ice over the British Isles with the maximum depth of ice over Scandinavia

9c1 mark

Using Figure 17, which one of the following statements is true?

Shade one circle only

  • Ice covered the whole of the British Isles during the last ice age.

  • The main ice sheet was centred in southern Europe

  • The ice sheet extended westwards from Scandinavia to the British Isles.

  • The shape of the coastline during the ice age was the same as the present day

Did this page help you?

10a1 mark

Study Figure 19, a photograph showing a retreating glacier.

Figure 19

figure-19-june-2022-paper-1-aqa-gcse-geography

Identify the feature shown at X. 

Shade one circle only

    • Answer: Moraine [1]
  • Drumlin

  • Truncated spur

  • Arête

10b1 mark

Suggest one reason why the material deposited by a glacier is mixed in size and shape

Did this page help you?

14 marks

Explain how a corrie forms and changes over time.

Did this page help you?

26 marks

‘The growing number of visitors to glaciated upland areas in the UK can only bring advantages.’
Do you agree?
Use an example to explain your answer.

Did this page help you?

34 marks

Study Figure 21, showing some land uses in a glaciated area.

fig-21-june-2019-paper1-qp-gcse-aqa-geo

Explain why there may be land use conflicts in glaciated upland areas.

Use Figure 21 and your own understanding.

Did this page help you?

46 marks

Study Figure 22, a diagram showing landforms of glacial deposition.

fig-22-june-2019-paper1-qp-gcse-aqa-geo

Explain the formation of different landforms of glacial deposition.

Use Figure 22 and your own understanding.

Did this page help you?

54 marks

Explain how glaciated areas in the UK provide economic opportunities.

Did this page help you?

64 marks

Explain the formation of a hanging valley.

Did this page help you?

76 marks

Study Figure 17, information about the Snowdon Sherpa bus service.

fig-17-nov-2021-paper-1-aqa-gcse-geography

Discuss the success of strategies used to manage the impacts of tourism in glaciated upland areas.

Use Figure 17 and an example you have studied.

Did this page help you?

84 marks

Explain the formation of a glacial trough (U-shaped valley).

Use one or more diagrams to support your answer.

Did this page help you?

96 marks

Study Figure 20, information about tourism in Snowdonia National Park, a glaciated area in the UK.

Figure 20

figure-20-june-2022-paper-1-aqa-gcse-geography

Assess the economic and environmental impacts of tourism in a glaciated upland area of the UK.

Use Figure 20 and your own understanding.

Did this page help you?