
Measuring Changes in Ecosystems
Sampling
- Sampling is a method of investigating the abundance and distribution of species and populations
- There are two different types of sampling
- Random
- Systematic
- In random sampling, the positions of the sampling points are selected at random
- This method avoids bias by the person that is carrying out the sampling
- Bias can affect the results - for example, a student might choose to carry out samples in a particular location because it looks interesting, and this might give the impression that the habitat contains more species than it really does
- In systematic sampling, the positions of the sampling points are located at fixed intervals throughout the sampling site
- This avoids accidentally missing out sections of habitat due to chance
- Systematic sampling allows researchers to investigate the effect of the presence of certain environmental features on species distribution e.g. by taking samples along a line that extends away from an environmental feature such as a river
- A line of this type is known as a transect
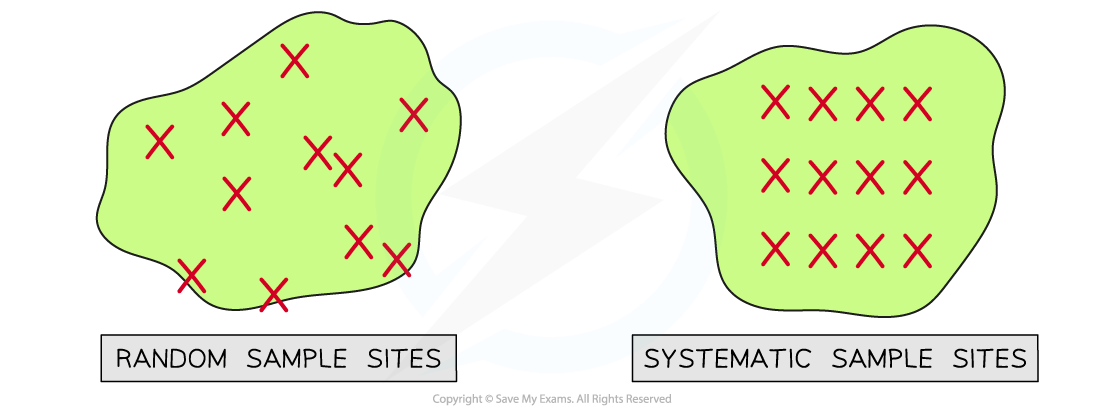
Random sampling involves selecting sample sites at random while systematic sampling involves placing sample sites at regular intervals.
Transects
- Systematic sampling is used when there is a clear change in the physical conditions across the area being studied
- For example, there may be changes in altitude, soil pH or light intensity
- Methods using transects can help show how species distribution changes with the different physical conditions in the area
- A transect is a line represented by a measuring tape, along which sample are taken
- For a line transect:
- Lay out a measuring tape in a straight line across the sample area
- At equal distances along the tape, record the identity of the organisms that touch the line (e.g. every 2 m)
- For a belt transect:
- Place quadrats at regular intervals along the tape and record the abundance or percentage cover of each species within each quadrat

A line transect and belt transect is carried out in a habitat

An example of a belt transect on a hillside. A quadrat is placed at regular intervals (every 10m of altitude gained) and the number of individuals (of the species being investigated e.g. buttercups) in each quadrat is recorded
Worked example
Investigate changes in the distribution of a species along an environmental gradient.

How to investigate the effect of an ecological factor on the number of plants across a survey area
Representing Results
- The results of an investigation into the distribution and abundance of organisms can be represented visually using a type of graph known as a kite diagram
- Kite diagrams can show both distribution and abundance
- The distribution of a species along a transect can be shown by its position along a central horizontal line in each section of a kite diagram
- Each section represents a different species
- The distance along the transect is given on the x-axis, to which the horizontal line is parallel
- The abundance of a species can be shown by the width of the 'kite' around the central horizontal line
- The shape is referred to as a kite because it extends an equal distance on each side of the central horizontal line
- Additional sections can be added to a kite diagram to show the changes in abiotic factors at different points along a transect e.g. the height above sea level or the pH of soil

Kite diagrams can be used to provide a visual representation of both abundance and distribution of species, as well as changes to abiotic factors such as elevation
Exam Tip
You could be asked to describe or design an investigation that could be used to measure the effect of a specific abiotic factor on species abundance or distribution, so make sure that you know the circumstances in which each sampling technique would be used, and how to use it.
Remember that when describing a practical you should always consider:
- How you will change the independent variable
- In this context you might be measuring a change in the independent variable, or abiotic factor, rather than causing the change yourself
- Note that this might not be relevant if you have just been asked to measure the abundance of a species in one habitat
- How you will measure the dependent variable
- How you will ensure that your results are valid
