Chi-squared Test and Dihybrid Crosses
Use of a chi-squared test on data from dihybrid crosses
- The difference between expected and observed results in experiments can be statistically significant or insignificant (happened by chance)
- If the difference between results is statistically significant it can suggest that something else is happening in the experiment that isn’t being accounted for
- For example, linkage between genes
- A statistical test called the chi-squared test determines whether there is a significant difference between the observed and expected results in an experiment
- The chi-squared test is completed when the data is categorical (data that can be grouped)
Calculating chi-squared values
- Obtain the expected and observed results for the experiment
- Calculate the difference between each set of results
- Square each difference (as it is irrelevant whether the difference is positive or negative)
- Divide each squared difference by the expected value and get a sum of these answers to obtain the chi-squared value

Analysing chi-squared values
- To work out what the chi-squared value means, a table that relates chi-squared values to probabilities is used
- If the chi-squared value represents a larger probability than the critical probability then it can be stated that the differences between the expected and observed results are due to chance
- If it represents a smaller probability than the critical probability then the differences in results are significant and something else may be causing the differences
- To determine the critical probability biologists generally use a probability of 0.05 (they allow that chance will cause five out of every 100 experiments to be different)
- The number of comparisons made must also be taken into account when determining the critical probability. This is known as the degrees of freedom
Worked example
An experiment was carried out investigating the inheritance of two genes in rabbits
- One for coat colour and one for ear length
- A dihybrid cross revealed the expected ratio of phenotypes to be 9 : 3 : 3 : 1
- Several rabbits with the double-heterozygous genotype were bred together and the phenotypes of all the offspring were recorded
- The ratio of the offspring was not exactly what was predicted, but was reasonably close
- In order to determine whether this was due to chance or for some other reason, the chi-squared test was used
Chi-squared Worked Example Table 1

- The expected number of each phenotype is the fraction of the total number of rabbits governed by the 9:3:3:1 ratio
- These are 9/16, 3/16, 3/16 and 1/16 of 160, respectively
- In order to understand what this chi-squared value of 2.93 says about the data, a table relating chi-squared values to probability is needed
Relating Chi-Squared Values to Probability Table

- The chi-squared table displays the probabilities that the differences between expected and observed are due to chance
- The degrees of freedom can be worked out from the results. It is calculated by subtracting one from the number of classes
- In this example, there are four phenotypes which means four classes, 4 – 1 = 3
- This means that the values in the third row are important for comparison
- For this experiment, there is a critical probability of 0.05
- This means that 7.82 is the value used for comparison
- The chi-squared value from the results (2.93) is much smaller than 7.82
- 2.93 would be located somewhere to the left-hand side of the table, representing a probability much greater than 0.1
- This means that there is no significant difference between the expected and observed results, any differences that do occur are due to chance
Worked example
An experiment was carried out on Drosophila genes
- One gene for body colour B = brown, b = black
- One gene for wing shape W = straight, w = curved
- A dihybrid cross revealed the expected ratio of phenotypes to be 9 : 3 : 3 : 1
- Several Drosophila with the double-heterozygous genotype were bred together and the phenotypes of all the F2 offspring were recorded
- The ratio of the offspring was far from what was predicted
- In order to determine whether this was due to chance or for some other reason, the chi-squared test was used
Chi-squared Worked Example 2 Table
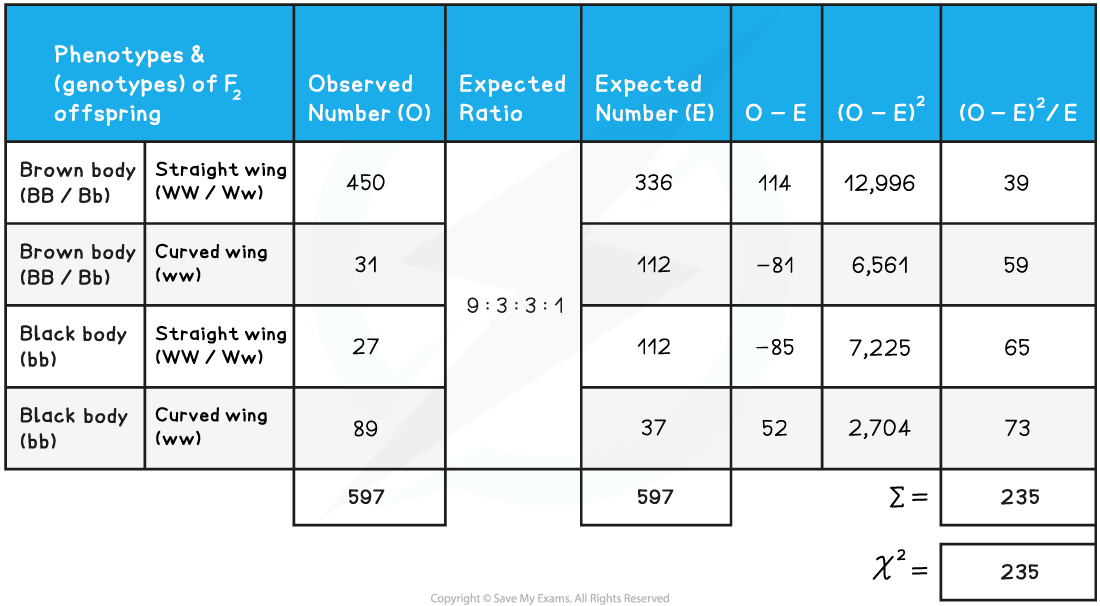
- The expected number of each phenotype is the fraction of the total number of flies governed by the 9:3:3:1 ratio
- These are 9/16, 3/16, 3/16 and 1/16 of 597, respectively
- In order to understand what this chi-squared value of 235 says about the data, a table relating chi-squared values to probability is needed
Relating Chi-Squared Values to Probability Table
- The chi-squared table displays the probabilities that the differences between expected and observed are due to chance
- The degrees of freedom can be worked out from the results. It is calculated by subtracting one from the number of classes
- In this example, there are also four phenotypes which means four classes, 4 – 1 = 3
- This means that the values in the third row are important for comparison
- For this experiment, there is a critical probability of 0.05
- This means that 7.82 is the value used for comparison
- The chi-squared value from the results (235) is much greater than 7.82
- 235 would be located somewhere off the far right of the table, representing a very small probability, much less than 0.001
- This means that there is a significant difference between the expected and observed results, any differences that do occur are due to a factor other than chance
- In this case, that factor is (autosomal) gene linkage
Conclusion
- The alleles for black/brown body colour and straight/curved wings are linked, ie. carried on the same chromosome (autosome)
Exam Tip
When calculating a chi-squared value it is very helpful to create a table like the ones seen in the worked examples. This will help you with your calculations and make sure you don’t get muddled up! You should also be prepared to suggest reasons why results might be significantly different. For example, there could be linkage between the genes being analysed.