
Patterns of Production, Consumption & Movement
Global patterns
- The global supply of energy and ore minerals is not evenly distributed
- Production of energy and minerals depends on various factors
- Physical factors such as geology
- The technology opening up new opportunities for resource exploitation
- Economic factors such as the price of the resource and the cost of extraction
- Political factors such as environmental agendas and wars
- Some places have a surplus of energy and minerals
- Others have a deficit and rely on trade to make up the shortfall
- Coal is the most evenly distributed fossil fuel:
- Production has declined in HICs over recent decades
- But production has increased in some LICs and NICs, e.g.... China and India
- The ‘dirtiest’ fossil fuel; there is heavy geopolitical pressure to reduce production and usage
- The USA, Russia and China have the largest coal reserves
- Closely followed by Australia and India
- Around 70 countries have coal reserves, meaning there is enough coal left to last for more than 100 years

Global production of coal, 2019 (figures in terawatt hours)
- Oil is found in fewer countries than coal
- E.g. in South America, the Arctic, Canadian Tar Sands and deep-water drilling in the Gulf of Mexico
- Saudi Arabia, Russia, USA, China and Canada produce the most oil
- Around 66% of global oil supplies are found in the Middle East
- With improved technology, new supplies of ‘unconventional’ oil are being discovered and accessed more easily
- OPEC can also control the supply and global price of oil
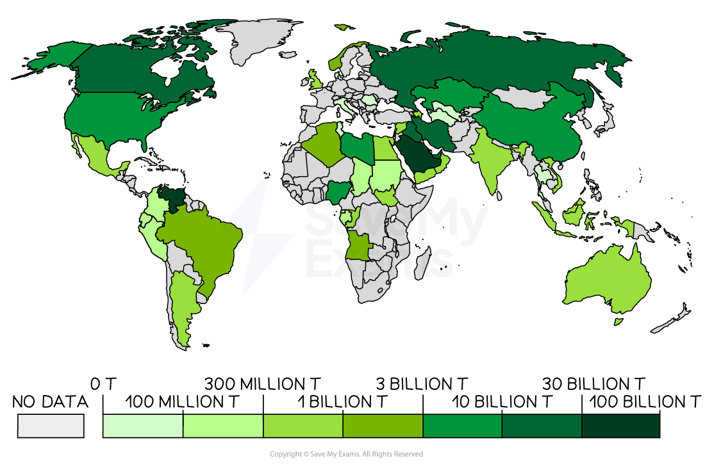
Global reserves of oil, 2020 (figures in tonnes)
- Natural gas is produced in similar locations to oil due to similar geological conditions for the formation
- A more recent fossil fuel as previously it was difficult to extract and transport
- Russia, Iran and Qatar have the largest natural gas reserves
- 40% of the UK's natural gas comes from the North Sea, although production has decreased as profits have fallen
- Globally, there is enough natural gas to last for approximately 50 years

Global reserves of natural gas, 2020 (cubic metres)
- Other energy sources include Uranium, a Non-renewable resource used to create nuclear energy
- Australia, Kazakhstan and Russia have the largest uranium reserves
- Uranium reserves are expected to last for another 90 years
- 32 countries have nuclear power plants, producing 10% of global electricity
- Production of renewable energy sources is strongly determined by a country's location
- Windy places can generate wind power, e.g. UK
- Sunny regions can generate solar power, e.g. Middle East and California
- Places with steep relief and abundant precipitation can generate hydroelectric power (HEP), e.g. Norway
- Countries close to plate boundaries can generate geothermal power, e.g. Iceland
- Heavily forested areas can produce abundant biomass, e.g. Nigeria
- The leading countries for installed renewable energy in 2022 were China, the U.S., and Brazil
- An ore is a metallic element found in high concentrations within certain rocks
- They are extracted from the earth by open-pit or underground mining
- They need to be refined, often via smelting at high temperatures, to extract the valuable metal
- There are many types of mineral ore, such as iron ore and copper
- Countries that contain huge reserves of iron ore include Australia, Brazil, India and Russia
- Other countries with large ore deposits, in general, include China, Chile and Peru
- Many African countries export more minerals than they consume, largely due to overseas TNCs operating mining in the region
- Many HICs have seen mineral reserves reach depletion
- But the discovery of mineral deposits has been a key factor in the economic growth of LICs and NICs
- Various critical minerals are vitally needed to fuel growing economies and these are concentrated in a few places around the world
- The global reliance on critical minerals sourced from only a few countries can lead to geopolitical tensions
- E.g. China has restricted the export of certain Rare Earth Elements (REEs)


Global production of critical minerals and their application, 2020
Consumption and trade
- Global consumption and trade of energy and minerals are increasing due to
- Population growth - global population is set to increase from 8 billion in 2022 to 9.7 billion by 2050
- The rise in the standard of living across the globe, fuelled by economic growth in developing countries and NEEs, such as China and India, leading to more demand for consumer goods
- Advances in technology and power-hungry electronic devices
- Globalisation leading to increased mobility and transport
Global Patterns of Consumption and Trade of Energy and Minerals
| Resource | Patterns of Consumption | Patterns of Trade |
|
Coal |
India, US, China and Russia account for 75% of global coal consumption Consumption in some regions is falling due to concern over climate change EU consumption reduced from 390 million tonnes in 1990 to 160 million tonnes in 202 But increasing in fast industrialising regions such as China, India and Brazil China’s coal consumption increased by 4.6% in 2021 |
Hard to trade as a bulky and low value so transport costs high Biggest producers consume their coal (China consumes 57% of its own coal, US consumes 92%) Only 20% of consumed coal was traded in 2019 The biggest exporters of coal are Indonesia, Australia, USA and Russia Many HICs, e.g. UK and Germany, rely heavily on imports for electricity generation |
|
Natural Gas |
Consumption of natural gas has tripled over the last 40 years Contributes to 20% of global energy consumption Consumption has decreased in Europe due to Russia/Ukraine war Consumption has increased in USA, Iran and China Biggest consumers: USA, Russia, China, Iran, Canada, Saudi Arabia |
Movement of natural gas is hindered by the need for pipelines (expensive and leaks can cause environmental damage) and difficulty in storing Still accounts for 30% of global energy trades, although this is decreasing Russia (to Europe) and Canada (to US) are the biggest exporters Japan, China, Germany, Italy, and Mexico biggest importers Liquified Natural Gas (LNG) is traded and stored more easily due to its ability to be shipped, although deepwater port terminals are required Qatar is the largest exporter of LNG |
|
Oil |
Consumption is greatest in HICs and NICs Demand in LICs is much lower as 2.5 billion rely on firewood for fuel The US is the biggest consumer, using approximately 12 million barrels per day The next biggest consumers are China, Japan, India and Russia Oil’s share of global primary energy consumption falling as nuclear and natural gas increases |
The biggest exporters are the Middle East, India and Nigeria The biggest importers are China, Japan and Western Europe Middle East exports 4.6 million barrels a day to China 61% of oil consumption is traded between countries Trading of oil accounts for approximately 3% of global GDP |
|
Nuclear Renewables |
The USA is the biggest consumer of uranium 51% of France’s energy mix is from nuclear reactors, the largest proportion in the world Renewable energy is a growing proportion of all countries' energy mix 11% of global primary energy came from renewable technologies in 2019 Iceland has the highest proportion of energy sourced from renewables at 85% (65% from geothermal and 20% from HEP) |
Uranium is traded between countries with large reserves and those without 56% of global uranium exports come from Kazakhstan, 33% from Canada The USA is the biggest importer of uranium by mass Trade restrictions apply to uranium due to its potential for nuclear weapon development Renewable energy is difficult to store and tends to be consumed in situ so very little traded |
|
Mineral Ores |
High consumption of minerals in developed countries, e.g. iron ore for alloy and steel production in construction Biggest increases in consumption in NICs to feed rapid industrialisation programmes Copper, iron ore, nickel, and REEs all important for the manufacturing of electronic and hi-tech products China consumes 50% of global copper, a tenfold increase in the last 30 years |
The largest importers of mineral ores are countries with limited domestic production but huge demand due to large manufacturing base After the 2008 global recession, China increased imports of iron ore by 33% to fill the gap in resource shortages Trade is largely controlled by TNCs operating mines in LICs, exporting to NICs |
Exam Tip
Make sure you can describe the general pattern of how the different fossil fuels and mineral ores are distributed, consumed and traded. For e.g. which types of country import and consume the most and which the least, and for each one, explain why using human or physical factors
