Half-Life (CIE IGCSE Physics)
Revision Note

Author
AshikaExpertise
Physics Project Lead
Half-Life Basics
- It is impossible to know when a particular unstable nucleus will decay
- But the rate at which the activity of a sample decreases can be known
- This is known as the half-life
- Half-life is defined as:
The time taken for half the nuclei of that isotope in any sample to decay
- In other words, the time it takes for the activity of a sample to fall to half its original level
- Different isotopes have different half-lives and half-lives can vary from a fraction of a second to billions of years in length
- Half-life can be determined from an activity–time graph
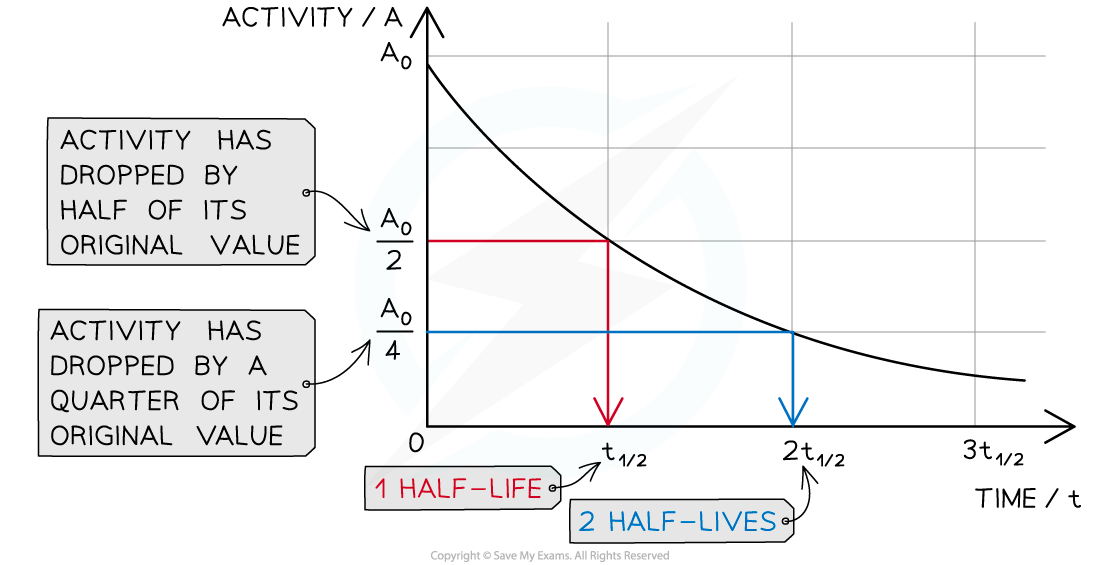
The graph shows how the activity of a radioactive sample changes over time. Each time the original activity halves, another half-life has passed
- The time it takes for the activity of the sample to decrease from 100 % to 50 % is the half-life
- It is the same length of time as it would take to decrease from 50 % activity to 25 % activity
- The half-life is constant for a particular isotope
- Half-life can also be represented on a table
- As the number of half life increases, the proportion of the isotope remaining halves
Table For Number of Half Lives to Proportion of Isotope

Half-Life Graphs
- To calculate the half-life of a sample from a graph:
- Check the original activity (where the line crosses the y-axies), A0
- Halve this value and look for this activity
- Go across from the halved value (on the y-axis) to the best fit curve, and then straight down to the x-axis
- The point where you reach the x-axis should be the half-life
- The time taken for the activity to decrease to half its original value is the half-life
Background Radiation
- Background radiation is radiation that is always present in the environment around us
- As a consequence, whenever an experiment involving radiation is carried out, some of the radiation that is detected will be background radiation
- When carrying out experiments to measure half-life, the presence of background radiation must be taken into account

When measuring radioactive emissions, some of the detected radiation will be background
- To do this you must:
- Start by measuring background radiation (with no sources present) – this is called your background count
- Then carry out your experiment
- Subtract the background count from each of your readings, in order to give a corrected count
- The corrected count is your best estimate of the radiation emitted from the source, and should be used to measure its half-life
Worked example
The radioisotope technetium is used extensively in medicine. The graph below shows how the activity of a sample varies with time. Determine the half-life of this material.
Step 1: Draw lines on the graph to determine the time it takes for technetium to drop to half of its original activity

Step 2: Read the half-life from the graph
-
- In the diagram above the initial activity, A0, is 8 × 10⁷ Bq
- The time taken to decrease to 4 × 10⁷ Bq, or ½ A0, is 6 hours
- The time taken to decrease to 2 × 10⁷ Bq is 6 more hours
- The time taken to decrease to 1 × 10⁷ Bq is 6 more hours
- Therefore, the half-life of this isotope is 6 hours
Worked example
A particular radioactive sample contains 2 million un-decayed atoms. After a year, there is only 500 000 atoms left un-decayed. What is the half-life of this material?
Step 1: Calculate how many times the number of un-decayed atoms has halved
-
- There were 2 000 000 atoms to start with
- 1 000 000 atoms would remain after 1 half-life
- 500 000 atoms would remain after 2 half-lives
- Therefore, the sample has undergone 2 half-lives
Step 2: Divide the time period by the number of half-lives
-
- The time period is a year
- The number of half-lives is 2
- 1 year divided by 2 is half a year or 6 months
- Therefore, the half-life is 6 months
Exam Tip
When looking for the corresponding time for the activity, it is good practice to draw a line on the graph with your ruler like is done in the mark scheme of the worked example. This ensures you're reading the most accurate value possible.

You've read 0 of your 0 free revision notes
Get unlimited access
to absolutely everything:
- Downloadable PDFs
- Unlimited Revision Notes
- Topic Questions
- Past Papers
- Model Answers
- Videos (Maths and Science)
Did this page help you?