Graphs of Trigonometric Functions
What are the graphs of trigonometric functions?
- The trigonometric functions sin, cos and tan all have special periodic graphs
- periodic means the graphs repeat over certain intervals
- You need to know their properties and how to sketch them for a given domain
- You must be able to do this for either degrees or radians
- Sketching the trigonometric graphs can help to
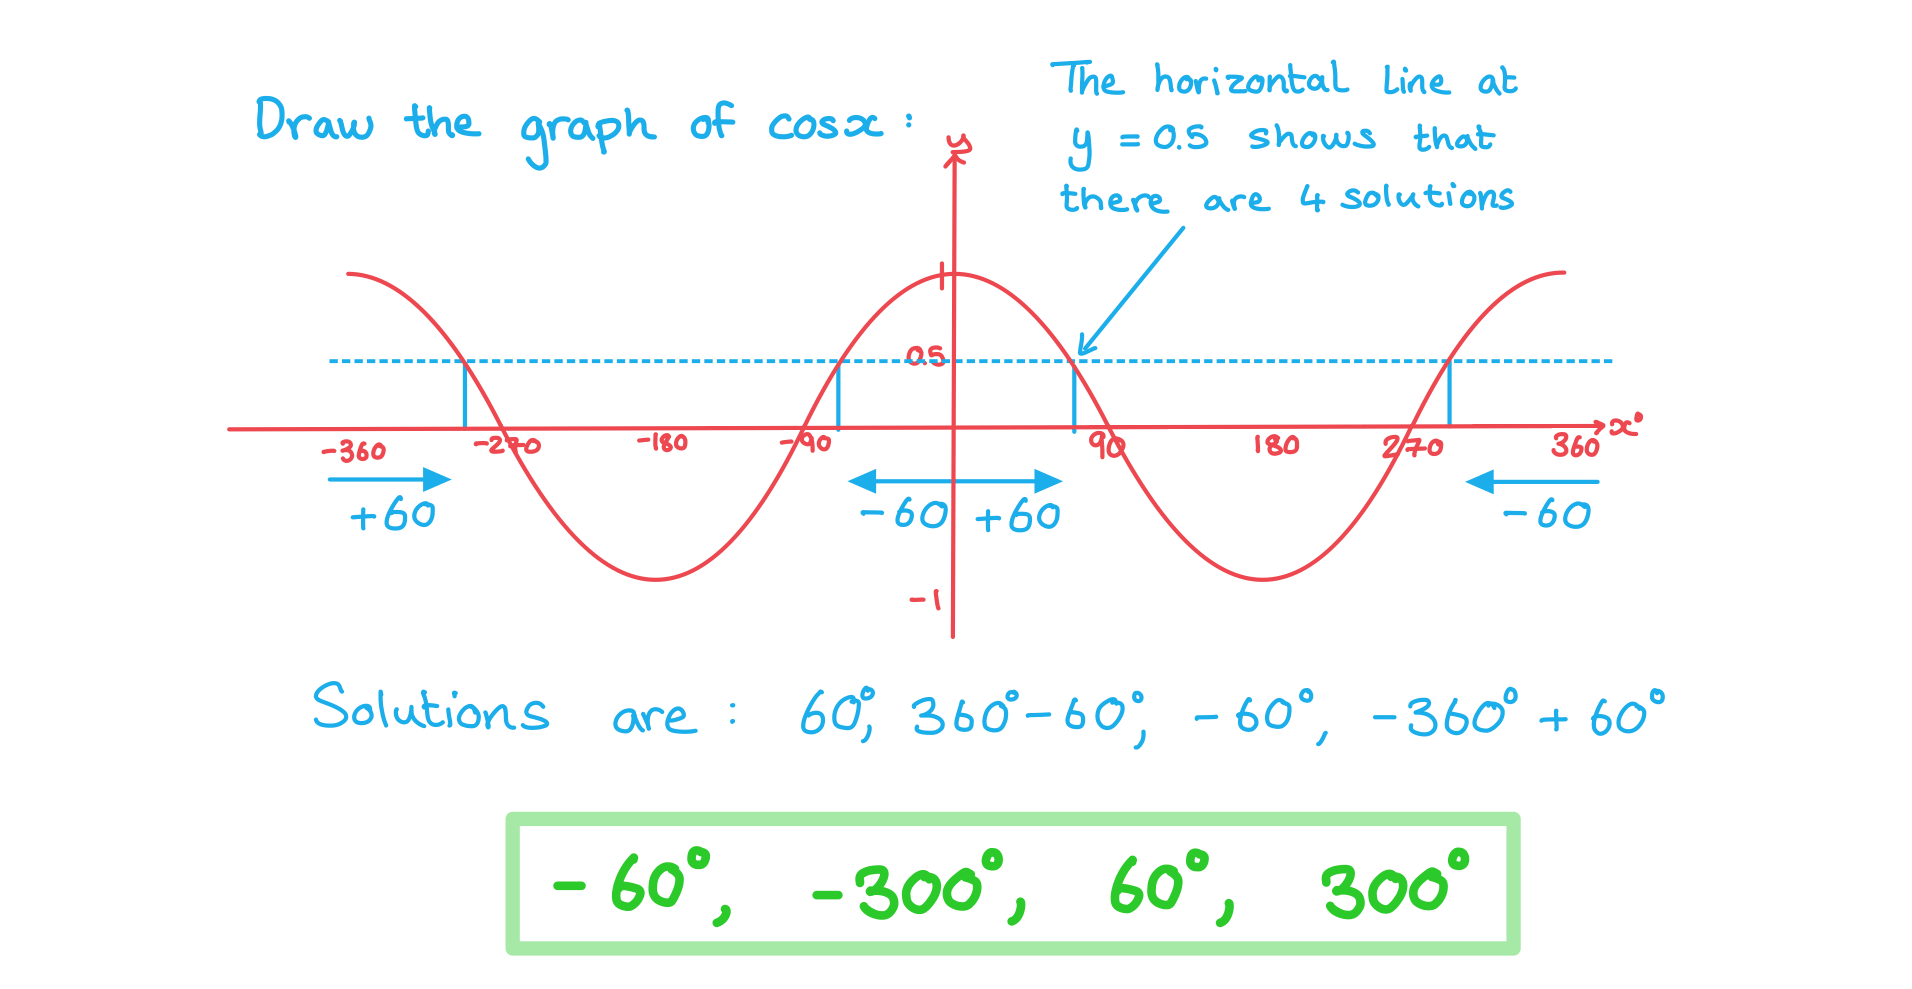
- Solve trigonometric equations and find all solutions
- Understand transformations of trigonometric functions
What are the properties of the graphs of sin x and cos x?
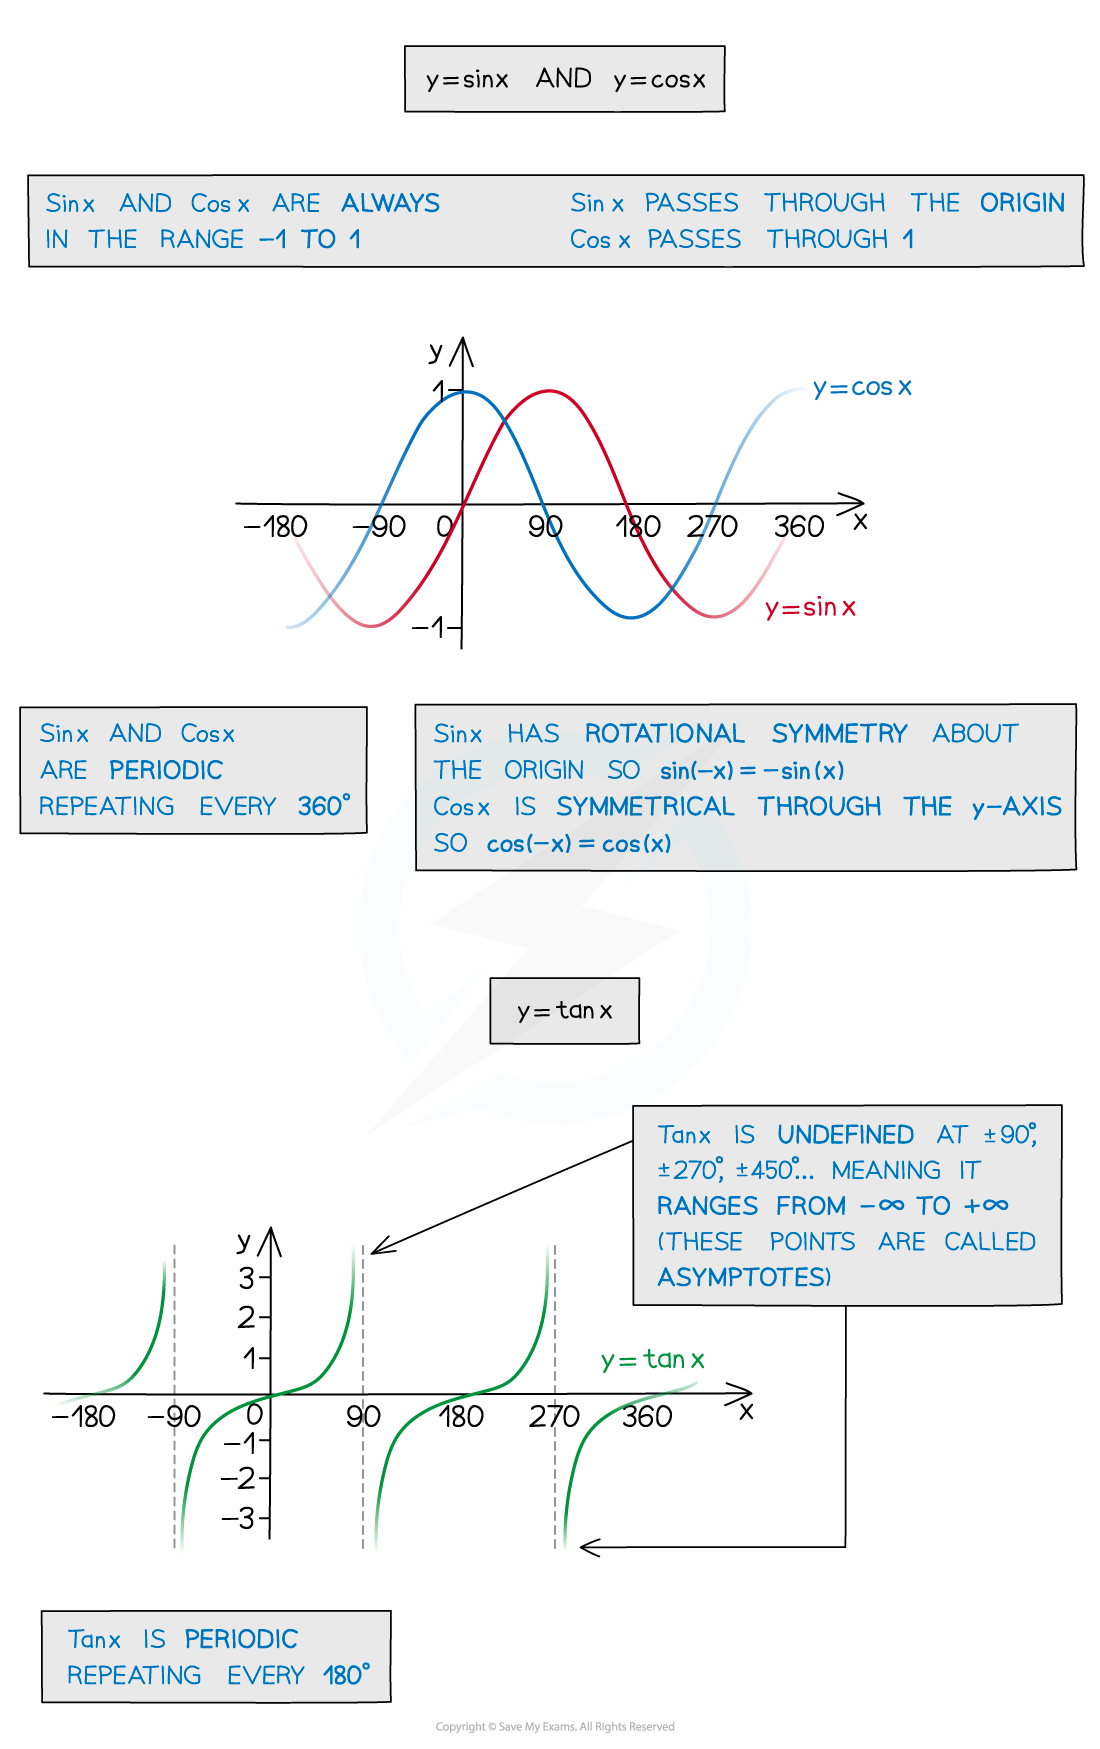
- The graphs of sin x and cos x are both periodic
- They repeat every 360° (2π radians)
- The angle measurement will always be on the x-axis
- Either in degrees or radians
- The corresponding value of the function will always be on the y-axis
- You need to know the domain and range of sin and cos
- Domain:
format('truetype')%3Bfont-weight%3Anormal%3Bfont-style%3Anormal%3B%7D%3C%2Fstyle%3E%3C%2Fdefs%3E%3Ctext%20font-family%3D%22Times%20New%20Roman%22%20font-size%3D%2218%22%20text-anchor%3D%22middle%22%20x%3D%224.5%22%20y%3D%2216%22%3E%7B%3C%2Ftext%3E%3Ctext%20font-family%3D%22Times%20New%20Roman%22%20font-size%3D%2218%22%20text-anchor%3D%22middle%22%20x%3D%2289.5%22%20y%3D%2216%22%3E%7D%3C%2Ftext%3E%3Ctext%20font-family%3D%22Times%20New%20Roman%22%20font-size%3D%2218%22%20font-style%3D%22italic%22%20font-weight%3D%22bold%22%20text-anchor%3D%22middle%22%20x%3D%2214.5%22%20y%3D%2216%22%3Ex%3C%2Ftext%3E%3Ctext%20font-family%3D%22math110fad8c4e8597264278582a569%22%20font-size%3D%2216%22%20text-anchor%3D%22middle%22%20x%3D%2228.5%22%20y%3D%2216%22%3E%7C%3C%2Ftext%3E%3Ctext%20font-family%3D%22Times%20New%20Roman%22%20font-size%3D%2218%22%20font-style%3D%22italic%22%20font-weight%3D%22bold%22%20text-anchor%3D%22middle%22%20x%3D%2242.5%22%20y%3D%2216%22%3Ex%3C%2Ftext%3E%3Ctext%20font-family%3D%22math110fad8c4e8597264278582a569%22%20font-size%3D%2216%22%20text-anchor%3D%22middle%22%20x%3D%2260.5%22%20y%3D%2216%22%3E%26%23x2208%3B%3C%2Ftext%3E%3Ctext%20font-family%3D%22math110fad8c4e8597264278582a569%22%20font-size%3D%2216%22%20text-anchor%3D%22middle%22%20x%3D%2278.5%22%20y%3D%2216%22%3E%26%23x211D%3B%3C%2Ftext%3E%3C%2Fsvg%3E)
- I.e. all real number values of x
- Including 'angles' less than 0° and greater than less than 360°
- Range:
format('truetype')%3Bfont-weight%3Anormal%3Bfont-style%3Anormal%3B%7D%3C%2Fstyle%3E%3C%2Fdefs%3E%3Ctext%20font-family%3D%22Times%20New%20Roman%22%20font-size%3D%2218%22%20text-anchor%3D%22middle%22%20x%3D%224.5%22%20y%3D%2216%22%3E%7B%3C%2Ftext%3E%3Ctext%20font-family%3D%22Times%20New%20Roman%22%20font-size%3D%2218%22%20text-anchor%3D%22middle%22%20x%3D%22133.5%22%20y%3D%2216%22%3E%7D%3C%2Ftext%3E%3Ctext%20font-family%3D%22Times%20New%20Roman%22%20font-size%3D%2218%22%20font-style%3D%22italic%22%20font-weight%3D%22bold%22%20text-anchor%3D%22middle%22%20x%3D%2214.5%22%20y%3D%2216%22%3Ey%3C%2Ftext%3E%3Ctext%20font-family%3D%22math105870d177921851ce329aaa3b2%22%20font-size%3D%2216%22%20text-anchor%3D%22middle%22%20x%3D%2228.5%22%20y%3D%2216%22%3E%7C%3C%2Ftext%3E%3Ctext%20font-family%3D%22math105870d177921851ce329aaa3b2%22%20font-size%3D%2216%22%20text-anchor%3D%22middle%22%20x%3D%2240.5%22%20y%3D%2216%22%3E%26%23x2212%3B%3C%2Ftext%3E%3Ctext%20font-family%3D%22Times%20New%20Roman%22%20font-size%3D%2218%22%20text-anchor%3D%22middle%22%20x%3D%2253.5%22%20y%3D%2216%22%3E1%3C%2Ftext%3E%3Ctext%20font-family%3D%22math105870d177921851ce329aaa3b2%22%20font-size%3D%2216%22%20text-anchor%3D%22middle%22%20x%3D%2272.5%22%20y%3D%2216%22%3E%26%23x2264%3B%3C%2Ftext%3E%3Ctext%20font-family%3D%22Times%20New%20Roman%22%20font-size%3D%2218%22%20font-style%3D%22italic%22%20font-weight%3D%22bold%22%20text-anchor%3D%22middle%22%20x%3D%2289.5%22%20y%3D%2216%22%3Ey%3C%2Ftext%3E%3Ctext%20font-family%3D%22math105870d177921851ce329aaa3b2%22%20font-size%3D%2216%22%20text-anchor%3D%22middle%22%20x%3D%22108.5%22%20y%3D%2216%22%3E%26%23x2264%3B%3C%2Ftext%3E%3Ctext%20font-family%3D%22Times%20New%20Roman%22%20font-size%3D%2218%22%20text-anchor%3D%22middle%22%20x%3D%22124.5%22%20y%3D%2216%22%3E1%3C%2Ftext%3E%3C%2Fsvg%3E)
- sin and cos can never take values greater than 1 or less than -1
- The amplitude of the graphs of sin x and cos x is 1
- Domain:
- The graphs of sin x and cos x are translations of one other
- sin x passes through the origin (0, 0)
- translate sin x 90° (
format('truetype')%3Bfont-weight%3Anormal%3Bfont-style%3Anormal%3B%7D%3C%2Fstyle%3E%3C%2Fdefs%3E%3Cline%20stroke%3D%22%23000000%22%20stroke-linecap%3D%22square%22%20stroke-width%3D%221%22%20x1%3D%222.5%22%20x2%3D%2218.5%22%20y1%3D%2220.5%22%20y2%3D%2220.5%22%2F%3E%3Ctext%20font-family%3D%22math1437d7d1d97917cd627a34a6a0f%22%20font-size%3D%2216%22%20font-style%3D%22italic%22%20text-anchor%3D%22middle%22%20x%3D%2210.5%22%20y%3D%2216%22%3E%26%23x3C0%3B%3C%2Ftext%3E%3Ctext%20font-family%3D%22Times%20New%20Roman%22%20font-size%3D%2218%22%20text-anchor%3D%22middle%22%20x%3D%2210.5%22%20y%3D%2238%22%3E2%3C%2Ftext%3E%3C%2Fsvg%3E) radians) to the left to get cos x
radians) to the left to get cos x
- translate sin x 90° (
- cos x passes through (0, 1)
- translate cos x 90° ( radians) to the right to get sin x
- translate cos x 90° (
- sin x passes through the origin (0, 0)
What are the properties of the graph of tan x?
- The graph of tan x is periodic
- It repeats every 180° (π radians)
- The angle measurement will always be on the x-axis
- Either in degrees or radians
- The graph of tan x is undefined at ± 90°, ± 270° etc
- There are vertical asymptotes at these points on the graph
- In radians this is
format('truetype')%3Bfont-weight%3Anormal%3Bfont-style%3Anormal%3B%7D%3C%2Fstyle%3E%3C%2Fdefs%3E%3Ctext%20font-family%3D%22math19d40f251850df255886267fea8%22%20font-size%3D%2214%22%20text-anchor%3D%22middle%22%20x%3D%225.5%22%20y%3D%2224%22%3E%26%23xB1%3B%3C%2Ftext%3E%3Cline%20stroke%3D%22%23000000%22%20stroke-linecap%3D%22square%22%20stroke-width%3D%221%22%20x1%3D%2213.5%22%20x2%3D%2228.5%22%20y1%3D%2218.5%22%20y2%3D%2218.5%22%2F%3E%3Ctext%20font-family%3D%22math19d40f251850df255886267fea8%22%20font-size%3D%2214%22%20font-style%3D%22italic%22%20text-anchor%3D%22middle%22%20x%3D%2220.5%22%20y%3D%2214%22%3E%26%23x3C0%3B%3C%2Ftext%3E%3Ctext%20font-family%3D%22Times%20New%20Roman%22%20font-size%3D%2216%22%20text-anchor%3D%22middle%22%20x%3D%2221.5%22%20y%3D%2235%22%3E2%3C%2Ftext%3E%3C%2Fsvg%3E) radians,
radians, format('truetype')%3Bfont-weight%3Anormal%3Bfont-style%3Anormal%3B%7D%3C%2Fstyle%3E%3C%2Fdefs%3E%3Ctext%20font-family%3D%22math19d40f251850df255886267fea8%22%20font-size%3D%2214%22%20text-anchor%3D%22middle%22%20x%3D%225.5%22%20y%3D%2226%22%3E%26%23xB1%3B%3C%2Ftext%3E%3Cline%20stroke%3D%22%23000000%22%20stroke-linecap%3D%22square%22%20stroke-width%3D%221%22%20x1%3D%2213.5%22%20x2%3D%2236.5%22%20y1%3D%2220.5%22%20y2%3D%2220.5%22%2F%3E%3Ctext%20font-family%3D%22Times%20New%20Roman%22%20font-size%3D%2216%22%20text-anchor%3D%22middle%22%20x%3D%2219.5%22%20y%3D%2215%22%3E3%3C%2Ftext%3E%3Ctext%20font-family%3D%22math19d40f251850df255886267fea8%22%20font-size%3D%2214%22%20font-style%3D%22italic%22%20text-anchor%3D%22middle%22%20x%3D%2228.5%22%20y%3D%2215%22%3E%26%23x3C0%3B%3C%2Ftext%3E%3Ctext%20font-family%3D%22Times%20New%20Roman%22%20font-size%3D%2216%22%20text-anchor%3D%22middle%22%20x%3D%2225.5%22%20y%3D%2237%22%3E2%3C%2Ftext%3E%3C%2Fsvg%3E) radians, etc
radians, etc
- You need to know the domain and range of tan
- Domain:
format('truetype')%3Bfont-weight%3Anormal%3Bfont-style%3Anormal%3B%7D%3C%2Fstyle%3E%3C%2Fdefs%3E%3Ctext%20font-family%3D%22Times%20New%20Roman%22%20font-size%3D%2218%22%20font-weight%3D%22bold%22%20text-anchor%3D%22middle%22%20x%3D%225.5%22%20y%3D%2216%22%3E%7B%3C%2Ftext%3E%3Ctext%20font-family%3D%22Times%20New%20Roman%22%20font-size%3D%2218%22%20font-weight%3D%22bold%22%20text-anchor%3D%22middle%22%20x%3D%2215.5%22%20y%3D%2216%22%3Ex%3C%2Ftext%3E%3Ctext%20font-family%3D%22math1a825afe076f21331ee5ffd31d3%22%20font-size%3D%2216%22%20font-weight%3D%22bold%22%20text-anchor%3D%22middle%22%20x%3D%2229.5%22%20y%3D%2216%22%3E%7C%3C%2Ftext%3E%3Ctext%20font-family%3D%22Times%20New%20Roman%22%20font-size%3D%2218%22%20font-weight%3D%22bold%22%20text-anchor%3D%22middle%22%20x%3D%2243.5%22%20y%3D%2216%22%3Ex%3C%2Ftext%3E%3Ctext%20font-family%3D%22math1a825afe076f21331ee5ffd31d3%22%20font-size%3D%2216%22%20font-weight%3D%22bold%22%20text-anchor%3D%22middle%22%20x%3D%2262.5%22%20y%3D%2216%22%3E%26%23x2260%3B%3C%2Ftext%3E%3Ctext%20font-family%3D%22Times%20New%20Roman%22%20font-size%3D%2218%22%20font-weight%3D%22bold%22%20text-anchor%3D%22middle%22%20x%3D%2281.5%22%20y%3D%2216%22%3E90%3C%2Ftext%3E%3Ctext%20font-family%3D%22math1a825afe076f21331ee5ffd31d3%22%20font-size%3D%2216%22%20font-weight%3D%22bold%22%20text-anchor%3D%22middle%22%20x%3D%2295.5%22%20y%3D%2216%22%3E%26%23xB0%3B%3C%2Ftext%3E%3Ctext%20font-family%3D%22math1a825afe076f21331ee5ffd31d3%22%20font-size%3D%2216%22%20font-weight%3D%22bold%22%20text-anchor%3D%22middle%22%20x%3D%22109.5%22%20y%3D%2216%22%3E%2B%3C%2Ftext%3E%3Ctext%20font-family%3D%22Times%20New%20Roman%22%20font-size%3D%2218%22%20font-weight%3D%22bold%22%20text-anchor%3D%22middle%22%20x%3D%22133.5%22%20y%3D%2216%22%3E180%3C%2Ftext%3E%3Ctext%20font-family%3D%22Times%20New%20Roman%22%20font-size%3D%2218%22%20font-weight%3D%22bold%22%20text-anchor%3D%22middle%22%20x%3D%22153.5%22%20y%3D%2216%22%3Ek%3C%2Ftext%3E%3Ctext%20font-family%3D%22math1a825afe076f21331ee5ffd31d3%22%20font-size%3D%2216%22%20font-weight%3D%22bold%22%20text-anchor%3D%22middle%22%20x%3D%22162.5%22%20y%3D%2216%22%3E%26%23xB0%3B%3C%2Ftext%3E%3Ctext%20font-family%3D%22math1a825afe076f21331ee5ffd31d3%22%20font-size%3D%2216%22%20font-weight%3D%22bold%22%20text-anchor%3D%22middle%22%20x%3D%22170.5%22%20y%3D%2216%22%3E%2C%3C%2Ftext%3E%3Ctext%20font-family%3D%22Times%20New%20Roman%22%20font-size%3D%2218%22%20font-weight%3D%22bold%22%20text-anchor%3D%22middle%22%20x%3D%22188.5%22%20y%3D%2216%22%3Ek%3C%2Ftext%3E%3Ctext%20font-family%3D%22math1a825afe076f21331ee5ffd31d3%22%20font-size%3D%2216%22%20font-weight%3D%22bold%22%20text-anchor%3D%22middle%22%20x%3D%22206.5%22%20y%3D%2216%22%3E%26%23x2208%3B%3C%2Ftext%3E%3Ctext%20font-family%3D%22math1a825afe076f21331ee5ffd31d3%22%20font-size%3D%2216%22%20font-weight%3D%22bold%22%20text-anchor%3D%22middle%22%20x%3D%22225.5%22%20y%3D%2216%22%3E%26%23x2124%3B%3C%2Ftext%3E%3Ctext%20font-family%3D%22Times%20New%20Roman%22%20font-size%3D%2218%22%20font-weight%3D%22bold%22%20text-anchor%3D%22middle%22%20x%3D%22236.5%22%20y%3D%2216%22%3E%7D%3C%2Ftext%3E%3C%2Fsvg%3E) (degrees) or
(degrees) or format('truetype')%3Bfont-weight%3Anormal%3Bfont-style%3Anormal%3B%7D%40font-face%7Bfont-family%3A'brack_sm1837c52e4f2c6bfec104885'%3Bsrc%3Aurl(data%3Afont%2Ftruetype%3Bcharset%3Dutf-8%3Bbase64%2CAAEAAAAMAIAAAwBAT1MvMi7PH4UAAADMAAAATmNtYXA3kjw6AAABHAAAAGxjdnQgAQYDiAAAAYgAAAASZ2x5ZkyYQ7YAAAGcAAACQmhlYWQLyR8fAAAD4AAAADZoaGVhAq0XCAAABBgAAAAkaG10eDEjA%2FUAAAQ8AAAAJGxvY2EAAEKZAAAEYAAAAChtYXhwBJsEcQAABIgAAAAgbmFtZW7QvZAAAASoAAAB5XBvc3QArQBVAAAGkAAAACBwcmVwu5WEAAAABrAAAAAHAAACDAGQAAUAAAQABAAAAAAABAAEAAAAAAAAAQEAAAAAAAAAAAAAAAAAAAAAAAAAAAAAAAAAAAAAACAgICAAAAAg9AMD%2FP%2F8AAABVAABAAAAAAACAAEAAQAAABQAAwABAAAAFAAEAFgAAAASABAAAwACI6cjqCOpI6ojqyOsI60jrv%2F%2FAAAjpyOoI6kjqiOrI6wjrSOu%2F%2F%2FcWtxa3FrcWtxa3FrcWtxaAAEAAAAAAAAAAAAAAAAAAAAAAAAAAAFUAFQBAAArAIwAgACoAAcAAAACAAAAAADVAQEAAwAHAAAxMxEjFyM1M9XVq4CAAQHWqwABAAAAAAEAAVUABwAjGAGxAAA%2FsQcC%2FbEDB%2FywBDwAsQAAP7AHPLEDAfaxBAT9MTAxNDY3FQ4BFWuVa0BrwCoqK8BAAAH%2FgAAAAFUBVAAJACEYAbEFAD%2BwATyxBgL9sAA8ALEFAD%2BwBjyxAQE%2FsAA8MTATIxQHFhUzNCc2VVWAgFWAgAFUVVRWVVVWVAABAAAAAAEAAVQABwAjGAGxAAA%2FsQcC%2FbEDB%2FywBDwAsQABP7AHPLEDAfaxBAT9MTARFBYXNS4BNWuVa0ABVGrAKispwEAAAQAAAAAAVQFUAAMAIBgBsAQQsAA8sAM8sQEC9bACPACwAy%2BwAjyxAAH1sAE8ETMRI1VVAVT%2BrAABAAAAAAEAAVQABwAlGAGwCS%2BwADyxAQL9sQUH%2FLAEPACxAAA%2FsAE8sQUB9rEEBP0xMCEjNCYnNR4BAQBVQGuVaz%2FAKyoqwQABAKsAAAGAAVQACQAiGAGwCy%2BxBgA8PLEFAv2wATwAsQUAP7AGPLEBAT%2BwADwxMAEjFBcGFTM0NyYBAFWAgFWAgAFUVFVWVVVWVQABAAAAAAEAAVQABwAlGAGwCS%2BwADyxAQL9sQUH%2FLAEPACxAAE%2FsAE8sQUB9rEEBP0xMAEjFAYHFT4BAQBVQWqVawFUVKsqKyvAAAEAqwAAAQABVAADACAYAbAFL7ABPLACPLEAAvWwAzwAsAMvsAI8sQAB9bABPBMzESOrVVUBVP6sAAAAAQAAAAEAAIsesexfDzz1AAMEAP%2F%2F%2F%2F%2FVre5k%2F%2F%2F%2F%2F9Wt7mT%2FgP%2F%2FAdYBWAAAAAoAAgABAAAAAAABAAABVP%2F%2FAAAXcP%2BA%2F4AB1gABAAAAAAAAAAAAAAAAAAAACQDVAAABAAAAAQD%2FgAEAAAABAAAAAQAAAAEAAKsBAAAAAQAAqwAAAAAAAAAhAAAAZQAAAK4AAAD0AAABLAAAAXQAAAG%2FAAACCQAAAkIAAQAAAAkACgACAAAAAAACAIAEAAAAAAAEAABlAAAAAAAAABUBAgAAAAAAAAABACYAAAAAAAAAAAACAA4AJgAAAAAAAAADAEQANAAAAAAAAAAEACYAeAAAAAAAAAAFABYAngAAAAAAAAAGABMAtAAAAAAAAAAIABwAxwABAAAAAAABACYAAAABAAAAAAACAA4AJgABAAAAAAADAEQANAABAAAAAAAEACYAeAABAAAAAAAFABYAngABAAAAAAAGABMAtAABAAAAAAAIABwAxwADAAEECQABACYAAAADAAEECQACAA4AJgADAAEECQADAEQANAADAAEECQAEACYAeAADAAEECQAFABYAngADAAEECQAGABMAtAADAAEECQAIABwAxwBCAHIAYQBjAGsAZQB0AHMAIABzAG0AYQBsAGwAIABzAGkAegBlAFIAZQBnAHUAbABhAHIATQBhAHQAaABzACAARgBvAHIAIABNAG8AcgBlACAAQgByAGEAYwBrAGUAdABzACAAcwBtAGEAbABsACAAcwBpAHoAZQBCAHIAYQBjAGsAZQB0AHMAIABzAG0AYQBsAGwAIABzAGkAegBlAFYAZQByAHMAaQBvAG4AIAAyAC4AMEJyYWNrZXRzX3NtYWxsX3NpemUATQBhAHQAaABzACAARgBvAHIAIABNAG8AcgBlAAAAAAMAAAAAAAAAqgBVAAAAAAAAAAAAAAAAAAAAAAAAAAC5B%2F8AAo2FAA%3D%3D)format('truetype')%3Bfont-weight%3Anormal%3Bfont-style%3Anormal%3B%7D%3C%2Fstyle%3E%3C%2Fdefs%3E%3Ctext%20font-family%3D%22brack_sm1837c52e4f2c6bfec104885%22%20font-size%3D%2218%22%20font-weight%3D%22bold%22%20text-anchor%3D%22start%22%20x%3D%223.5%22%20y%3D%227%22%3E%26%23x23A7%3B%3C%2Ftext%3E%3Ctext%20font-family%3D%22brack_sm1837c52e4f2c6bfec104885%22%20font-size%3D%2218%22%20font-weight%3D%22bold%22%20text-anchor%3D%22start%22%20x%3D%223.5%22%20y%3D%2213%22%3E%26%23x23AA%3B%3C%2Ftext%3E%3Ctext%20font-family%3D%22brack_sm1837c52e4f2c6bfec104885%22%20font-size%3D%2218%22%20font-weight%3D%22bold%22%20text-anchor%3D%22start%22%20x%3D%223.5%22%20y%3D%2219%22%3E%26%23x23AA%3B%3C%2Ftext%3E%3Ctext%20font-family%3D%22brack_sm1837c52e4f2c6bfec104885%22%20font-size%3D%2218%22%20font-weight%3D%22bold%22%20text-anchor%3D%22start%22%20x%3D%223.5%22%20y%3D%2225%22%3E%26%23x23A8%3B%3C%2Ftext%3E%3Ctext%20font-family%3D%22brack_sm1837c52e4f2c6bfec104885%22%20font-size%3D%2218%22%20font-weight%3D%22bold%22%20text-anchor%3D%22start%22%20x%3D%223.5%22%20y%3D%2231%22%3E%26%23x23AA%3B%3C%2Ftext%3E%3Ctext%20font-family%3D%22brack_sm1837c52e4f2c6bfec104885%22%20font-size%3D%2218%22%20font-weight%3D%22bold%22%20text-anchor%3D%22start%22%20x%3D%223.5%22%20y%3D%2237%22%3E%26%23x23AA%3B%3C%2Ftext%3E%3Ctext%20font-family%3D%22brack_sm1837c52e4f2c6bfec104885%22%20font-size%3D%2218%22%20font-weight%3D%22bold%22%20text-anchor%3D%22start%22%20x%3D%223.5%22%20y%3D%2243%22%3E%26%23x23A9%3B%3C%2Ftext%3E%3Ctext%20font-family%3D%22Times%20New%20Roman%22%20font-size%3D%2218%22%20font-weight%3D%22bold%22%20text-anchor%3D%22middle%22%20x%3D%2214.5%22%20y%3D%2227%22%3Ex%3C%2Ftext%3E%3Ctext%20font-family%3D%22math12eb8730e7a9c2a19e14e19f87f%22%20font-size%3D%2216%22%20font-weight%3D%22bold%22%20text-anchor%3D%22middle%22%20x%3D%2228.5%22%20y%3D%2227%22%3E%7C%3C%2Ftext%3E%3Ctext%20font-family%3D%22Times%20New%20Roman%22%20font-size%3D%2218%22%20font-weight%3D%22bold%22%20text-anchor%3D%22middle%22%20x%3D%2242.5%22%20y%3D%2227%22%3Ex%3C%2Ftext%3E%3Ctext%20font-family%3D%22math12eb8730e7a9c2a19e14e19f87f%22%20font-size%3D%2216%22%20font-weight%3D%22bold%22%20text-anchor%3D%22middle%22%20x%3D%2261.5%22%20y%3D%2227%22%3E%26%23x2260%3B%3C%2Ftext%3E%3Cline%20stroke%3D%22%23000000%22%20stroke-linecap%3D%22square%22%20stroke-width%3D%221%22%20x1%3D%2272.5%22%20x2%3D%2288.5%22%20y1%3D%2220.5%22%20y2%3D%2220.5%22%2F%3E%3Ctext%20font-family%3D%22math12eb8730e7a9c2a19e14e19f87f%22%20font-size%3D%2216%22%20font-weight%3D%22bold%22%20text-anchor%3D%22middle%22%20x%3D%2280.5%22%20y%3D%2216%22%3E%26%23x3C0%3B%3C%2Ftext%3E%3Ctext%20font-family%3D%22Times%20New%20Roman%22%20font-size%3D%2218%22%20font-weight%3D%22bold%22%20text-anchor%3D%22middle%22%20x%3D%2281.5%22%20y%3D%2238%22%3E2%3C%2Ftext%3E%3Ctext%20font-family%3D%22math12eb8730e7a9c2a19e14e19f87f%22%20font-size%3D%2216%22%20font-weight%3D%22bold%22%20text-anchor%3D%22middle%22%20x%3D%22100.5%22%20y%3D%2227%22%3E%2B%3C%2Ftext%3E%3Ctext%20font-family%3D%22Times%20New%20Roman%22%20font-size%3D%2218%22%20font-weight%3D%22bold%22%20text-anchor%3D%22middle%22%20x%3D%22114.5%22%20y%3D%2227%22%3Ek%3C%2Ftext%3E%3Ctext%20font-family%3D%22math12eb8730e7a9c2a19e14e19f87f%22%20font-size%3D%2216%22%20font-weight%3D%22bold%22%20text-anchor%3D%22middle%22%20x%3D%22125.5%22%20y%3D%2227%22%3E%26%23x3C0%3B%3C%2Ftext%3E%3Ctext%20font-family%3D%22math12eb8730e7a9c2a19e14e19f87f%22%20font-size%3D%2216%22%20font-weight%3D%22bold%22%20text-anchor%3D%22middle%22%20x%3D%22135.5%22%20y%3D%2227%22%3E%2C%3C%2Ftext%3E%3Ctext%20font-family%3D%22Times%20New%20Roman%22%20font-size%3D%2218%22%20font-weight%3D%22bold%22%20text-anchor%3D%22middle%22%20x%3D%22153.5%22%20y%3D%2227%22%3Ek%3C%2Ftext%3E%3Ctext%20font-family%3D%22math12eb8730e7a9c2a19e14e19f87f%22%20font-size%3D%2216%22%20font-weight%3D%22bold%22%20text-anchor%3D%22middle%22%20x%3D%22171.5%22%20y%3D%2227%22%3E%26%23x2208%3B%3C%2Ftext%3E%3Ctext%20font-family%3D%22math12eb8730e7a9c2a19e14e19f87f%22%20font-size%3D%2216%22%20font-weight%3D%22bold%22%20text-anchor%3D%22middle%22%20x%3D%22190.5%22%20y%3D%2227%22%3E%26%23x2124%3B%3C%2Ftext%3E%3Ctext%20font-family%3D%22brack_sm1837c52e4f2c6bfec104885%22%20font-size%3D%2218%22%20font-weight%3D%22bold%22%20text-anchor%3D%22start%22%20x%3D%22197.5%22%20y%3D%227%22%3E%26%23x23AB%3B%3C%2Ftext%3E%3Ctext%20font-family%3D%22brack_sm1837c52e4f2c6bfec104885%22%20font-size%3D%2218%22%20font-weight%3D%22bold%22%20text-anchor%3D%22start%22%20x%3D%22197.5%22%20y%3D%2213%22%3E%26%23x23AE%3B%3C%2Ftext%3E%3Ctext%20font-family%3D%22brack_sm1837c52e4f2c6bfec104885%22%20font-size%3D%2218%22%20font-weight%3D%22bold%22%20text-anchor%3D%22start%22%20x%3D%22197.5%22%20y%3D%2219%22%3E%26%23x23AE%3B%3C%2Ftext%3E%3Ctext%20font-family%3D%22brack_sm1837c52e4f2c6bfec104885%22%20font-size%3D%2218%22%20font-weight%3D%22bold%22%20text-anchor%3D%22start%22%20x%3D%22197.5%22%20y%3D%2225%22%3E%26%23x23AC%3B%3C%2Ftext%3E%3Ctext%20font-family%3D%22brack_sm1837c52e4f2c6bfec104885%22%20font-size%3D%2218%22%20font-weight%3D%22bold%22%20text-anchor%3D%22start%22%20x%3D%22197.5%22%20y%3D%2231%22%3E%26%23x23AE%3B%3C%2Ftext%3E%3Ctext%20font-family%3D%22brack_sm1837c52e4f2c6bfec104885%22%20font-size%3D%2218%22%20font-weight%3D%22bold%22%20text-anchor%3D%22start%22%20x%3D%22197.5%22%20y%3D%2237%22%3E%26%23x23AE%3B%3C%2Ftext%3E%3Ctext%20font-family%3D%22brack_sm1837c52e4f2c6bfec104885%22%20font-size%3D%2218%22%20font-weight%3D%22bold%22%20text-anchor%3D%22start%22%20x%3D%22197.5%22%20y%3D%2243%22%3E%26%23x23AD%3B%3C%2Ftext%3E%3C%2Fsvg%3E) (radians)
(radians)
- I.e. all values (positive or negative) except where the asymptotes appear
- Range:
format('truetype')%3Bfont-weight%3Anormal%3Bfont-style%3Anormal%3B%7D%3C%2Fstyle%3E%3C%2Fdefs%3E%3Ctext%20font-family%3D%22Times%20New%20Roman%22%20font-size%3D%2218%22%20text-anchor%3D%22middle%22%20x%3D%224.5%22%20y%3D%2216%22%3E%7B%3C%2Ftext%3E%3Ctext%20font-family%3D%22Times%20New%20Roman%22%20font-size%3D%2218%22%20text-anchor%3D%22middle%22%20x%3D%2289.5%22%20y%3D%2216%22%3E%7D%3C%2Ftext%3E%3Ctext%20font-family%3D%22Times%20New%20Roman%22%20font-size%3D%2218%22%20font-style%3D%22italic%22%20font-weight%3D%22bold%22%20text-anchor%3D%22middle%22%20x%3D%2214.5%22%20y%3D%2216%22%3Ey%3C%2Ftext%3E%3Ctext%20font-family%3D%22math110fad8c4e8597264278582a569%22%20font-size%3D%2216%22%20text-anchor%3D%22middle%22%20x%3D%2228.5%22%20y%3D%2216%22%3E%7C%3C%2Ftext%3E%3Ctext%20font-family%3D%22Times%20New%20Roman%22%20font-size%3D%2218%22%20font-style%3D%22italic%22%20font-weight%3D%22bold%22%20text-anchor%3D%22middle%22%20x%3D%2242.5%22%20y%3D%2216%22%3Ey%3C%2Ftext%3E%3Ctext%20font-family%3D%22math110fad8c4e8597264278582a569%22%20font-size%3D%2216%22%20text-anchor%3D%22middle%22%20x%3D%2260.5%22%20y%3D%2216%22%3E%26%23x2208%3B%3C%2Ftext%3E%3Ctext%20font-family%3D%22math110fad8c4e8597264278582a569%22%20font-size%3D%2216%22%20text-anchor%3D%22middle%22%20x%3D%2278.5%22%20y%3D%2216%22%3E%26%23x211D%3B%3C%2Ftext%3E%3C%2Fsvg%3E)
- tan x can take any real number value
- Domain:
How do I sketch trigonometric graphs?
- You may need to sketch a trigonometric graph
- so you will need to remember the key features of each one
- The following steps may help you sketch a trigonometric graph
- STEP 1
Check whether you should be working in degrees or radians
-
- Check the interval given in the question
- If you see π in the given interval then work in radians
- STEP 2
Label the x-axis in multiples of 90°- Or multiples of
format('truetype')%3Bfont-weight%3Anormal%3Bfont-style%3Anormal%3B%7D%3C%2Fstyle%3E%3C%2Fdefs%3E%3Cline%20stroke%3D%22%23000000%22%20stroke-linecap%3D%22square%22%20stroke-width%3D%221%22%20x1%3D%222.5%22%20x2%3D%2217.5%22%20y1%3D%2218.5%22%20y2%3D%2218.5%22%2F%3E%3Ctext%20font-family%3D%22math1437d7d1d97917cd627a34a6a0f%22%20font-size%3D%2214%22%20font-weight%3D%22bold%22%20text-anchor%3D%22middle%22%20x%3D%2210.5%22%20y%3D%2214%22%3E%26%23x3C0%3B%3C%2Ftext%3E%3Ctext%20font-family%3D%22Times%20New%20Roman%22%20font-size%3D%2216%22%20font-weight%3D%22bold%22%20text-anchor%3D%22middle%22%20x%3D%2210.5%22%20y%3D%2235%22%3E2%3C%2Ftext%3E%3C%2Fsvg%3E) if you are working in radians
if you are working in radians - Make sure you cover the entire given interval on the x-axis
- Or multiples of
- STEP 3
Label the y-axisformat('truetype')%3Bfont-weight%3Anormal%3Bfont-style%3Anormal%3B%7D%3C%2Fstyle%3E%3C%2Fdefs%3E%3Ctext%20font-family%3D%22math1ca1a29523a31a98778ef30b146%22%20font-size%3D%2216%22%20text-anchor%3D%22middle%22%20x%3D%226.5%22%20y%3D%2216%22%3E%26%23x2212%3B%3C%2Ftext%3E%3Ctext%20font-family%3D%22Times%20New%20Roman%22%20font-size%3D%2218%22%20text-anchor%3D%22middle%22%20x%3D%2217.5%22%20y%3D%2216%22%3E1%3C%2Ftext%3E%3Ctext%20font-family%3D%22math1ca1a29523a31a98778ef30b146%22%20font-size%3D%2216%22%20text-anchor%3D%22middle%22%20x%3D%2230.5%22%20y%3D%2216%22%3E%26%23x2264%3B%3C%2Ftext%3E%3Ctext%20font-family%3D%22Times%20New%20Roman%22%20font-size%3D%2218%22%20font-style%3D%22italic%22%20text-anchor%3D%22middle%22%20x%3D%2242.5%22%20y%3D%2216%22%3Ey%3C%2Ftext%3E%3Ctext%20font-family%3D%22math1ca1a29523a31a98778ef30b146%22%20font-size%3D%2216%22%20text-anchor%3D%22middle%22%20x%3D%2256.5%22%20y%3D%2216%22%3E%26%23x2264%3B%3C%2Ftext%3E%3Ctext%20font-family%3D%22Times%20New%20Roman%22%20font-size%3D%2218%22%20text-anchor%3D%22middle%22%20x%3D%2268.5%22%20y%3D%2216%22%3E1%3C%2Ftext%3E%3C%2Fsvg%3E) for sin x or cos x
for sin x or cos x- No specific points on the y-axis for tan x
- STEP 4
Draw the graph- Knowing exact values will help with this
- e.g. sin(0) = 0 and cos(0) = 1
- Mark the important points on the axis first
- If you are drawing the graph of tan x
- put the asymptotes in first
- If you are drawing sin x or cos x
- mark where the maximum and minimum points will be
- Try to keep the symmetry (and rotational symmetry) as you sketch
- This will help when using the graph to find solutions
- Knowing exact values will help with this
Exam Tip
- Sketch all three trig graphs on your exam paper so you can refer to them as many times as you need to!
Worked example
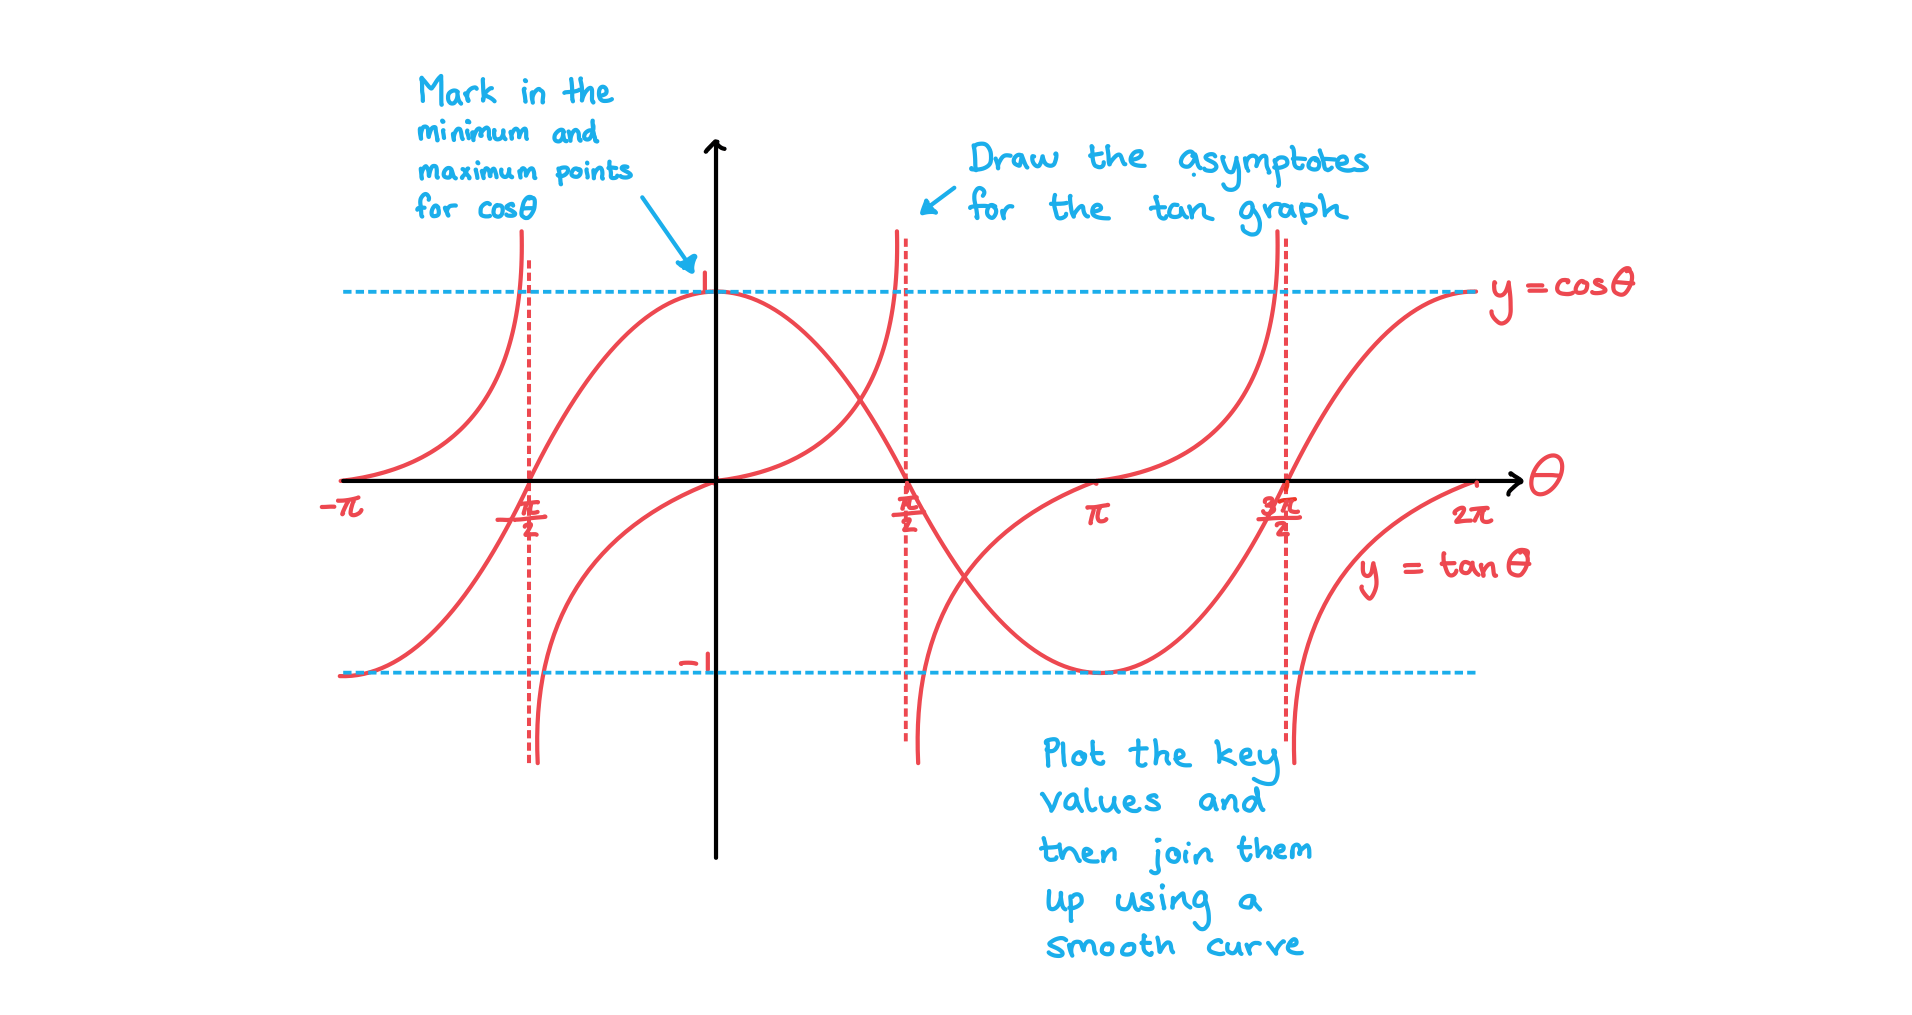
Sketch the graphs of format('truetype')%3Bfont-weight%3Anormal%3Bfont-style%3Anormal%3B%7D%3C%2Fstyle%3E%3C%2Fdefs%3E%3Ctext%20font-family%3D%22Times%20New%20Roman%22%20font-size%3D%2218%22%20font-style%3D%22italic%22%20text-anchor%3D%22middle%22%20x%3D%224.5%22%20y%3D%2216%22%3Ey%3C%2Ftext%3E%3Ctext%20font-family%3D%22math17f39f8317fbdb1988ef4c628eb%22%20font-size%3D%2216%22%20text-anchor%3D%22middle%22%20x%3D%2218.5%22%20y%3D%2216%22%3E%3D%3C%2Ftext%3E%3Ctext%20font-family%3D%22Times%20New%20Roman%22%20font-size%3D%2218%22%20text-anchor%3D%22middle%22%20x%3D%2239.5%22%20y%3D%2216%22%3Ecos%3C%2Ftext%3E%3Ctext%20font-family%3D%22Times%20New%20Roman%22%20font-size%3D%2218%22%20font-style%3D%22italic%22%20text-anchor%3D%22middle%22%20x%3D%2255.5%22%20y%3D%2216%22%3E%26%23x3B8%3B%3C%2Ftext%3E%3C%2Fsvg%3E) and
and format('truetype')%3Bfont-weight%3Anormal%3Bfont-style%3Anormal%3B%7D%3C%2Fstyle%3E%3C%2Fdefs%3E%3Ctext%20font-family%3D%22Times%20New%20Roman%22%20font-size%3D%2218%22%20font-style%3D%22italic%22%20text-anchor%3D%22middle%22%20x%3D%224.5%22%20y%3D%2216%22%3Ey%3C%2Ftext%3E%3Ctext%20font-family%3D%22math17f39f8317fbdb1988ef4c628eb%22%20font-size%3D%2216%22%20text-anchor%3D%22middle%22%20x%3D%2218.5%22%20y%3D%2216%22%3E%3D%3C%2Ftext%3E%3Ctext%20font-family%3D%22Times%20New%20Roman%22%20font-size%3D%2218%22%20text-anchor%3D%22middle%22%20x%3D%2238.5%22%20y%3D%2216%22%3Etan%3C%2Ftext%3E%3Ctext%20font-family%3D%22Times%20New%20Roman%22%20font-size%3D%2218%22%20font-style%3D%22italic%22%20text-anchor%3D%22middle%22%20x%3D%2253.5%22%20y%3D%2216%22%3E%26%23x3B8%3B%3C%2Ftext%3E%3C%2Fsvg%3E) on the same set of axes in the interval
on the same set of axes in the interval format('truetype')%3Bfont-weight%3Anormal%3Bfont-style%3Anormal%3B%7D%3C%2Fstyle%3E%3C%2Fdefs%3E%3Ctext%20font-family%3D%22math106990466ab1afafce1e80c422a%22%20font-size%3D%2216%22%20text-anchor%3D%22middle%22%20x%3D%226.5%22%20y%3D%2216%22%3E%26%23x2212%3B%3C%2Ftext%3E%3Ctext%20font-family%3D%22math106990466ab1afafce1e80c422a%22%20font-size%3D%2216%22%20font-style%3D%22italic%22%20text-anchor%3D%22middle%22%20x%3D%2219.5%22%20y%3D%2216%22%3E%26%23x3C0%3B%3C%2Ftext%3E%3Ctext%20font-family%3D%22math106990466ab1afafce1e80c422a%22%20font-size%3D%2216%22%20text-anchor%3D%22middle%22%20x%3D%2234.5%22%20y%3D%2216%22%3E%26%23x2264%3B%3C%2Ftext%3E%3Ctext%20font-family%3D%22Times%20New%20Roman%22%20font-size%3D%2218%22%20font-style%3D%22italic%22%20text-anchor%3D%22middle%22%20x%3D%2246.5%22%20y%3D%2216%22%3E%26%23x3B8%3B%3C%2Ftext%3E%3Ctext%20font-family%3D%22math106990466ab1afafce1e80c422a%22%20font-size%3D%2216%22%20text-anchor%3D%22middle%22%20x%3D%2260.5%22%20y%3D%2216%22%3E%26%23x2264%3B%3C%2Ftext%3E%3Ctext%20font-family%3D%22Times%20New%20Roman%22%20font-size%3D%2218%22%20text-anchor%3D%22middle%22%20x%3D%2272.5%22%20y%3D%2216%22%3E2%3C%2Ftext%3E%3Ctext%20font-family%3D%22math106990466ab1afafce1e80c422a%22%20font-size%3D%2216%22%20font-style%3D%22italic%22%20text-anchor%3D%22middle%22%20x%3D%2283.5%22%20y%3D%2216%22%3E%26%23x3C0%3B%3C%2Ftext%3E%3C%2Fsvg%3E) . Clearly mark the key features of both graphs.
. Clearly mark the key features of both graphs.
format('truetype')%3Bfont-weight%3Anormal%3Bfont-style%3Anormal%3B%7D%40font-face%7Bfont-family%3A'brack_sm2882ad605b1e27be87c7468'%3Bsrc%3Aurl(data%3Afont%2Ftruetype%3Bcharset%3Dutf-8%3Bbase64%2CAAEAAAAMAIAAAwBAT1MvMi7PH4UAAADMAAAATmNtYXA3kjw6AAABHAAAADxjdnQgAQYDiAAAAVgAAAASZ2x5ZkyYQ7YAAAFsAAAAkWhlYWQLyR8fAAACAAAAADZoaGVhAq0XCAAAAjgAAAAkaG10eDEjA%2FUAAAJcAAAADGxvY2EAAEKZAAACaAAAABBtYXhwBJsEcQAAAngAAAAgbmFtZW7QvZAAAAKYAAAB5XBvc3QArQBVAAAEgAAAACBwcmVwu5WEAAAABKAAAAAHAAACDAGQAAUAAAQABAAAAAAABAAEAAAAAAAAAQEAAAAAAAAAAAAAAAAAAAAAAAAAAAAAAAAAAAAAACAgICAAAAAg9AMD%2FP%2F8AAABVAABAAAAAAACAAEAAQAAABQAAwABAAAAFAAEACgAAAAGAAQAAQACI5wjn%2F%2F%2FAAAjnCOf%2F%2F%2FcZdxjAAEAAAAAAAAAAAFUAFQBAAArAIwAgACoAAcAAAACAAAAAADVAQEAAwAHAAAxMxEjFyM1M9XVq4CAAQHWqwABAAAAAABVAVgAAwAfGAGwAy%2BwADyxAgL1sAE8ALEDAD%2BwAjx8sQAG9bABPBEzESNVVQFY%2FqgAAQDXAAABLAFUAAMAIBgBsAUvsAE8sAI8sQAC9bADPACwAy%2BwAjyxAAH1sAE8EzMRI9dVVQFU%2FqwAAAAAAQAAAAEAAIsesexfDzz1AAMEAP%2F%2F%2F%2F%2FVre5k%2F%2F%2F%2F%2F9Wt7mT%2FgP%2F%2FAdYBWAAAAAoAAgABAAAAAAABAAABVP%2F%2FAAAXcP%2BA%2F4AB1gABAAAAAAAAAAAAAAAAAAAAAwDVAAABLAAAASwA1wAAAAAAAAAhAAAAWAAAAJEAAQAAAAMACgACAAAAAAACAIAEAAAAAAAEAABlAAAAAAAAABUBAgAAAAAAAAABACYAAAAAAAAAAAACAA4AJgAAAAAAAAADAEQANAAAAAAAAAAEACYAeAAAAAAAAAAFABYAngAAAAAAAAAGABMAtAAAAAAAAAAIABwAxwABAAAAAAABACYAAAABAAAAAAACAA4AJgABAAAAAAADAEQANAABAAAAAAAEACYAeAABAAAAAAAFABYAngABAAAAAAAGABMAtAABAAAAAAAIABwAxwADAAEECQABACYAAAADAAEECQACAA4AJgADAAEECQADAEQANAADAAEECQAEACYAeAADAAEECQAFABYAngADAAEECQAGABMAtAADAAEECQAIABwAxwBCAHIAYQBjAGsAZQB0AHMAIABzAG0AYQBsAGwAIABzAGkAegBlAFIAZQBnAHUAbABhAHIATQBhAHQAaABzACAARgBvAHIAIABNAG8AcgBlACAAQgByAGEAYwBrAGUAdABzACAAcwBtAGEAbABsACAAcwBpAHoAZQBCAHIAYQBjAGsAZQB0AHMAIABzAG0AYQBsAGwAIABzAGkAegBlAFYAZQByAHMAaQBvAG4AIAAyAC4AMEJyYWNrZXRzX3NtYWxsX3NpemUATQBhAHQAaABzACAARgBvAHIAIABNAG8AcgBlAAAAAAMAAAAAAAAAqgBVAAAAAAAAAAAAAAAAAAAAAAAAAAC5B%2F8AAo2FAA%3D%3D)format('truetype')%3Bfont-weight%3Anormal%3Bfont-style%3Anormal%3B%7D%40font-face%7Bfont-family%3A'bracketse552f5417ff4680c6b50499'%3Bsrc%3Aurl(data%3Afont%2Ftruetype%3Bcharset%3Dutf-8%3Bbase64%2CAAEAAAAMAIAAAwBAT1MvMi7RIisAAADMAAAATmNtYXBi7uzYAAABHAAAAExjdnQgBAkDLgAAAWgAAAASZ2x5Zo64f%2BkAAAF8AAABSWhlYWQLniGcAAACyAAAADZoaGVhBK4XLAAAAwAAAAAkaG10eCWq%2F90AAAMkAAAAFGxvY2EAABknAAADOAAAABhtYXhwBJIESAAAA1AAAAAgbmFtZRAA8I4AAANwAAAB3nBvc3QBwwDgAAAFUAAAACBwcmVwupWEAAAABXAAAAAHAAACggGQAAUAAAQABAAAAAAABAAEAAAAAAAAAQEAAAAAAAAAAAAAAAAAAAAAAAAAAAAAAAAAAAAAACAgICAAAAAg9AMEAAAAAAADgAAAAAAAAAACAAEAAQAAABQAAwABAAAAFAAEADgAAAAKAAgAAgACI5sjnSOeI6D%2F%2FwAAI5sjnSOeI6D%2F%2F9xm3GXcZdxkAAEAAAAAAAAAAAAAAAABVABWAQAALACoA4AAMgAHAAAAAgAAACoA1QNVAAMABwAANTMRIxMjETPV1auAgCoDK%2F0AAtUAAQAAAAABgAOAAAUAJBgBsAAvsAPFsQEC%2FbADELEEBP0AsQAAP7ABPLEEBj%2BwAzwwMTEzEAEjAFUBKyv%2BqwH8AYT%2BqgABAAAAAAGAA4AABQAmGAGwAC6wA8WxBQL9sAMQsQIE%2FQB8sQAGPxiwBTyxAwb2sAI8MDEREgEzABMBAVQr%2FtMCA4D91v6qAYQB%2FAAB%2F6wAAAEsA4AABQAnGAGwAC%2BwBzywA8WxAQL9sAMQsQQE%2FQCxAAA%2FsAE8sQQGP7ADPDAxISMSATMAASxVAf7UKwFVAfwBhP6rAAH%2FrAAAASwDgAAFACkYAbABL7AHPLAExbEAAv2wBBCxAwT9AHyxAQY%2FsAA8GLEEAD%2BwAzwwMRMzEAEjANdV%2FqsrASsDgP3V%2FqsBhgAAAAABAAAAAQAAeuTcpl8PPPUAAwQA%2F%2F%2F%2F%2F9Wt7o7%2F%2F%2F%2F%2F1a3ujv%2BsAAABgAOAAAAACgACAAEAAAAAAAEAAAOAAAAAABdw%2F6z%2FrAGAAAEAAAAAAAAAAAAAAAAAAAAFANUAAAEsAAABLAAAASz%2FrAEs%2F6wAAAAAAAAAJAAAAGgAAACzAAAA%2FQAAAUkAAQAAAAUACAACAAAAAAACAIAEAAAAAAAEAAA%2BAAAAAAAAABUBAgAAAAAAAAABACQAAAAAAAAAAAACAA4AJAAAAAAAAAADAEIAMgAAAAAAAAAEACQAdAAAAAAAAAAFABYAmAAAAAAAAAAGABIArgAAAAAAAAAIABwAwAABAAAAAAABACQAAAABAAAAAAACAA4AJAABAAAAAAADAEIAMgABAAAAAAAEACQAdAABAAAAAAAFABYAmAABAAAAAAAGABIArgABAAAAAAAIABwAwAADAAEECQABACQAAAADAAEECQACAA4AJAADAAEECQADAEIAMgADAAEECQAEACQAdAADAAEECQAFABYAmAADAAEECQAGABIArgADAAEECQAIABwAwABCAHIAYQBjAGsAZQB0AHMAIABmAHUAbABsACAAcwBpAHoAZQBSAGUAZwB1AGwAYQByAE0AYQB0AGgAcwAgAEYAbwByACAATQBvAHIAZQAgAEIAcgBhAGMAawBlAHQAcwAgAGYAdQBsAGwAIABzAGkAegBlAEIAcgBhAGMAawBlAHQAcwAgAGYAdQBsAGwAIABzAGkAegBlAFYAZQByAHMAaQBvAG4AIAAyAC4AMEJyYWNrZXRzX2Z1bGxfc2l6ZQBNAGEAdABoAHMAIABGAG8AcgAgAE0AbwByAGUAAAADAAAAAAAAAcAA4AAAAAAAAAAAAAAAAAAAAAAAAAAAuQf%2FAAGNhQA%3D)format('truetype')%3Bfont-weight%3Anormal%3Bfont-style%3Anormal%3B%7D%3C%2Fstyle%3E%3C%2Fdefs%3E%3Ctext%20font-family%3D%22Times%20New%20Roman%22%20font-size%3D%2218%22%20font-style%3D%22italic%22%20text-anchor%3D%22middle%22%20x%3D%224.5%22%20y%3D%2230%22%3Ex%3C%2Ftext%3E%3Ctext%20font-family%3D%22math143f4d31b04031e49f5eb18baba%22%20font-size%3D%2216%22%20text-anchor%3D%22middle%22%20x%3D%2218.5%22%20y%3D%2230%22%3E%3D%3C%2Ftext%3E%3Ctext%20font-family%3D%22Times%20New%20Roman%22%20font-size%3D%2218%22%20text-anchor%3D%22middle%22%20x%3D%2237.5%22%20y%3D%2230%22%3Esin%3C%2Ftext%3E%3Ctext%20font-family%3D%22math143f4d31b04031e49f5eb18baba%22%20font-size%3D%2212%22%20text-anchor%3D%22middle%22%20x%3D%2253.5%22%20y%3D%2225%22%3E%26%23x2212%3B%3C%2Ftext%3E%3Ctext%20font-family%3D%22Times%20New%20Roman%22%20font-size%3D%2213%22%20text-anchor%3D%22middle%22%20x%3D%2261.5%22%20y%3D%2225%22%3E1%3C%2Ftext%3E%3Ctext%20font-family%3D%22bracketse552f5417ff4680c6b50499%22%20font-size%3D%2218%22%20text-anchor%3D%22start%22%20x%3D%2266.5%22%20y%3D%2217%22%3E%26%23x239B%3B%3C%2Ftext%3E%3Ctext%20font-family%3D%22brack_sm2882ad605b1e27be87c7468%22%20font-size%3D%2218%22%20text-anchor%3D%22start%22%20x%3D%2266.5%22%20y%3D%2223%22%3E%26%23x239C%3B%3C%2Ftext%3E%3Ctext%20font-family%3D%22brack_sm2882ad605b1e27be87c7468%22%20font-size%3D%2218%22%20text-anchor%3D%22start%22%20x%3D%2266.5%22%20y%3D%2229%22%3E%26%23x239C%3B%3C%2Ftext%3E%3Ctext%20font-family%3D%22bracketse552f5417ff4680c6b50499%22%20font-size%3D%2218%22%20text-anchor%3D%22start%22%20x%3D%2266.5%22%20y%3D%2245%22%3E%26%23x239D%3B%3C%2Ftext%3E%3Ctext%20font-family%3D%22bracketse552f5417ff4680c6b50499%22%20font-size%3D%2218%22%20text-anchor%3D%22start%22%20x%3D%2290.5%22%20y%3D%2217%22%3E%26%23x239E%3B%3C%2Ftext%3E%3Ctext%20font-family%3D%22brack_sm2882ad605b1e27be87c7468%22%20font-size%3D%2218%22%20text-anchor%3D%22start%22%20x%3D%2290.5%22%20y%3D%2223%22%3E%26%23x239F%3B%3C%2Ftext%3E%3Ctext%20font-family%3D%22brack_sm2882ad605b1e27be87c7468%22%20font-size%3D%2218%22%20text-anchor%3D%22start%22%20x%3D%2290.5%22%20y%3D%2229%22%3E%26%23x239F%3B%3C%2Ftext%3E%3Ctext%20font-family%3D%22bracketse552f5417ff4680c6b50499%22%20font-size%3D%2218%22%20text-anchor%3D%22start%22%20x%3D%2290.5%22%20y%3D%2245%22%3E%26%23x23A0%3B%3C%2Ftext%3E%3Cline%20stroke%3D%22%23000000%22%20stroke-linecap%3D%22square%22%20stroke-width%3D%221%22%20x1%3D%2274.5%22%20x2%3D%2286.5%22%20y1%3D%2223.5%22%20y2%3D%2223.5%22%2F%3E%3Ctext%20font-family%3D%22Times%20New%20Roman%22%20font-size%3D%2218%22%20text-anchor%3D%22middle%22%20x%3D%2280.5%22%20y%3D%2216%22%3E1%3C%2Ftext%3E%3Ctext%20font-family%3D%22Times%20New%20Roman%22%20font-size%3D%2218%22%20text-anchor%3D%22middle%22%20x%3D%2280.5%22%20y%3D%2241%22%3E2%3C%2Ftext%3E%3C%2Fsvg%3E)
format('truetype')%3Bfont-weight%3Anormal%3Bfont-style%3Anormal%3B%7D%40font-face%7Bfont-family%3A'brack_sm2882ad605b1e27be87c7468'%3Bsrc%3Aurl(data%3Afont%2Ftruetype%3Bcharset%3Dutf-8%3Bbase64%2CAAEAAAAMAIAAAwBAT1MvMi7PH4UAAADMAAAATmNtYXA3kjw6AAABHAAAADxjdnQgAQYDiAAAAVgAAAASZ2x5ZkyYQ7YAAAFsAAAAkWhlYWQLyR8fAAACAAAAADZoaGVhAq0XCAAAAjgAAAAkaG10eDEjA%2FUAAAJcAAAADGxvY2EAAEKZAAACaAAAABBtYXhwBJsEcQAAAngAAAAgbmFtZW7QvZAAAAKYAAAB5XBvc3QArQBVAAAEgAAAACBwcmVwu5WEAAAABKAAAAAHAAACDAGQAAUAAAQABAAAAAAABAAEAAAAAAAAAQEAAAAAAAAAAAAAAAAAAAAAAAAAAAAAAAAAAAAAACAgICAAAAAg9AMD%2FP%2F8AAABVAABAAAAAAACAAEAAQAAABQAAwABAAAAFAAEACgAAAAGAAQAAQACI5wjn%2F%2F%2FAAAjnCOf%2F%2F%2FcZdxjAAEAAAAAAAAAAAFUAFQBAAArAIwAgACoAAcAAAACAAAAAADVAQEAAwAHAAAxMxEjFyM1M9XVq4CAAQHWqwABAAAAAABVAVgAAwAfGAGwAy%2BwADyxAgL1sAE8ALEDAD%2BwAjx8sQAG9bABPBEzESNVVQFY%2FqgAAQDXAAABLAFUAAMAIBgBsAUvsAE8sAI8sQAC9bADPACwAy%2BwAjyxAAH1sAE8EzMRI9dVVQFU%2FqwAAAAAAQAAAAEAAIsesexfDzz1AAMEAP%2F%2F%2F%2F%2FVre5k%2F%2F%2F%2F%2F9Wt7mT%2FgP%2F%2FAdYBWAAAAAoAAgABAAAAAAABAAABVP%2F%2FAAAXcP%2BA%2F4AB1gABAAAAAAAAAAAAAAAAAAAAAwDVAAABLAAAASwA1wAAAAAAAAAhAAAAWAAAAJEAAQAAAAMACgACAAAAAAACAIAEAAAAAAAEAABlAAAAAAAAABUBAgAAAAAAAAABACYAAAAAAAAAAAACAA4AJgAAAAAAAAADAEQANAAAAAAAAAAEACYAeAAAAAAAAAAFABYAngAAAAAAAAAGABMAtAAAAAAAAAAIABwAxwABAAAAAAABACYAAAABAAAAAAACAA4AJgABAAAAAAADAEQANAABAAAAAAAEACYAeAABAAAAAAAFABYAngABAAAAAAAGABMAtAABAAAAAAAIABwAxwADAAEECQABACYAAAADAAEECQACAA4AJgADAAEECQADAEQANAADAAEECQAEACYAeAADAAEECQAFABYAngADAAEECQAGABMAtAADAAEECQAIABwAxwBCAHIAYQBjAGsAZQB0AHMAIABzAG0AYQBsAGwAIABzAGkAegBlAFIAZQBnAHUAbABhAHIATQBhAHQAaABzACAARgBvAHIAIABNAG8AcgBlACAAQgByAGEAYwBrAGUAdABzACAAcwBtAGEAbABsACAAcwBpAHoAZQBCAHIAYQBjAGsAZQB0AHMAIABzAG0AYQBsAGwAIABzAGkAegBlAFYAZQByAHMAaQBvAG4AIAAyAC4AMEJyYWNrZXRzX3NtYWxsX3NpemUATQBhAHQAaABzACAARgBvAHIAIABNAG8AcgBlAAAAAAMAAAAAAAAAqgBVAAAAAAAAAAAAAAAAAAAAAAAAAAC5B%2F8AAo2FAA%3D%3D)format('truetype')%3Bfont-weight%3Anormal%3Bfont-style%3Anormal%3B%7D%40font-face%7Bfont-family%3A'bracketse552f5417ff4680c6b50499'%3Bsrc%3Aurl(data%3Afont%2Ftruetype%3Bcharset%3Dutf-8%3Bbase64%2CAAEAAAAMAIAAAwBAT1MvMi7RIisAAADMAAAATmNtYXBi7uzYAAABHAAAAExjdnQgBAkDLgAAAWgAAAASZ2x5Zo64f%2BkAAAF8AAABSWhlYWQLniGcAAACyAAAADZoaGVhBK4XLAAAAwAAAAAkaG10eCWq%2F90AAAMkAAAAFGxvY2EAABknAAADOAAAABhtYXhwBJIESAAAA1AAAAAgbmFtZRAA8I4AAANwAAAB3nBvc3QBwwDgAAAFUAAAACBwcmVwupWEAAAABXAAAAAHAAACggGQAAUAAAQABAAAAAAABAAEAAAAAAAAAQEAAAAAAAAAAAAAAAAAAAAAAAAAAAAAAAAAAAAAACAgICAAAAAg9AMEAAAAAAADgAAAAAAAAAACAAEAAQAAABQAAwABAAAAFAAEADgAAAAKAAgAAgACI5sjnSOeI6D%2F%2FwAAI5sjnSOeI6D%2F%2F9xm3GXcZdxkAAEAAAAAAAAAAAAAAAABVABWAQAALACoA4AAMgAHAAAAAgAAACoA1QNVAAMABwAANTMRIxMjETPV1auAgCoDK%2F0AAtUAAQAAAAABgAOAAAUAJBgBsAAvsAPFsQEC%2FbADELEEBP0AsQAAP7ABPLEEBj%2BwAzwwMTEzEAEjAFUBKyv%2BqwH8AYT%2BqgABAAAAAAGAA4AABQAmGAGwAC6wA8WxBQL9sAMQsQIE%2FQB8sQAGPxiwBTyxAwb2sAI8MDEREgEzABMBAVQr%2FtMCA4D91v6qAYQB%2FAAB%2F6wAAAEsA4AABQAnGAGwAC%2BwBzywA8WxAQL9sAMQsQQE%2FQCxAAA%2FsAE8sQQGP7ADPDAxISMSATMAASxVAf7UKwFVAfwBhP6rAAH%2FrAAAASwDgAAFACkYAbABL7AHPLAExbEAAv2wBBCxAwT9AHyxAQY%2FsAA8GLEEAD%2BwAzwwMRMzEAEjANdV%2FqsrASsDgP3V%2FqsBhgAAAAABAAAAAQAAeuTcpl8PPPUAAwQA%2F%2F%2F%2F%2F9Wt7o7%2F%2F%2F%2F%2F1a3ujv%2BsAAABgAOAAAAACgACAAEAAAAAAAEAAAOAAAAAABdw%2F6z%2FrAGAAAEAAAAAAAAAAAAAAAAAAAAFANUAAAEsAAABLAAAASz%2FrAEs%2F6wAAAAAAAAAJAAAAGgAAACzAAAA%2FQAAAUkAAQAAAAUACAACAAAAAAACAIAEAAAAAAAEAAA%2BAAAAAAAAABUBAgAAAAAAAAABACQAAAAAAAAAAAACAA4AJAAAAAAAAAADAEIAMgAAAAAAAAAEACQAdAAAAAAAAAAFABYAmAAAAAAAAAAGABIArgAAAAAAAAAIABwAwAABAAAAAAABACQAAAABAAAAAAACAA4AJAABAAAAAAADAEIAMgABAAAAAAAEACQAdAABAAAAAAAFABYAmAABAAAAAAAGABIArgABAAAAAAAIABwAwAADAAEECQABACQAAAADAAEECQACAA4AJAADAAEECQADAEIAMgADAAEECQAEACQAdAADAAEECQAFABYAmAADAAEECQAGABIArgADAAEECQAIABwAwABCAHIAYQBjAGsAZQB0AHMAIABmAHUAbABsACAAcwBpAHoAZQBSAGUAZwB1AGwAYQByAE0AYQB0AGgAcwAgAEYAbwByACAATQBvAHIAZQAgAEIAcgBhAGMAawBlAHQAcwAgAGYAdQBsAGwAIABzAGkAegBlAEIAcgBhAGMAawBlAHQAcwAgAGYAdQBsAGwAIABzAGkAegBlAFYAZQByAHMAaQBvAG4AIAAyAC4AMEJyYWNrZXRzX2Z1bGxfc2l6ZQBNAGEAdABoAHMAIABGAG8AcgAgAE0AbwByAGUAAAADAAAAAAAAAcAA4AAAAAAAAAAAAAAAAAAAAAAAAAAAuQf%2FAAGNhQA%3D)format('truetype')%3Bfont-weight%3Anormal%3Bfont-style%3Anormal%3B%7D%3C%2Fstyle%3E%3C%2Fdefs%3E%3Ctext%20font-family%3D%22Times%20New%20Roman%22%20font-size%3D%2218%22%20text-anchor%3D%22middle%22%20x%3D%2210.5%22%20y%3D%2230%22%3Esin%3C%2Ftext%3E%3Ctext%20font-family%3D%22Times%20New%20Roman%22%20font-size%3D%2218%22%20font-style%3D%22italic%22%20text-anchor%3D%22middle%22%20x%3D%2225.5%22%20y%3D%2230%22%3Ex%3C%2Ftext%3E%3Ctext%20font-family%3D%22math14603afe0e081fab4a03b15aadd%22%20font-size%3D%2216%22%20text-anchor%3D%22middle%22%20x%3D%2239.5%22%20y%3D%2230%22%3E%3D%3C%2Ftext%3E%3Cline%20stroke%3D%22%23000000%22%20stroke-linecap%3D%22square%22%20stroke-width%3D%221%22%20x1%3D%2250.5%22%20x2%3D%2262.5%22%20y1%3D%2223.5%22%20y2%3D%2223.5%22%2F%3E%3Ctext%20font-family%3D%22Times%20New%20Roman%22%20font-size%3D%2218%22%20text-anchor%3D%22middle%22%20x%3D%2256.5%22%20y%3D%2216%22%3E1%3C%2Ftext%3E%3Ctext%20font-family%3D%22Times%20New%20Roman%22%20font-size%3D%2218%22%20text-anchor%3D%22middle%22%20x%3D%2256.5%22%20y%3D%2241%22%3E2%3C%2Ftext%3E%3Ctext%20font-family%3D%22math14603afe0e081fab4a03b15aadd%22%20font-size%3D%2216%22%20text-anchor%3D%22middle%22%20x%3D%2281.5%22%20y%3D%2230%22%3E%26%23x21D4%3B%3C%2Ftext%3E%3Ctext%20font-family%3D%22Times%20New%20Roman%22%20font-size%3D%2218%22%20font-style%3D%22italic%22%20text-anchor%3D%22middle%22%20x%3D%22101.5%22%20y%3D%2230%22%3Ex%3C%2Ftext%3E%3Ctext%20font-family%3D%22math14603afe0e081fab4a03b15aadd%22%20font-size%3D%2216%22%20text-anchor%3D%22middle%22%20x%3D%22115.5%22%20y%3D%2230%22%3E%3D%3C%2Ftext%3E%3Ctext%20font-family%3D%22Times%20New%20Roman%22%20font-size%3D%2218%22%20text-anchor%3D%22middle%22%20x%3D%22134.5%22%20y%3D%2230%22%3Esin%3C%2Ftext%3E%3Ctext%20font-family%3D%22math14603afe0e081fab4a03b15aadd%22%20font-size%3D%2212%22%20text-anchor%3D%22middle%22%20x%3D%22150.5%22%20y%3D%2225%22%3E%26%23x2212%3B%3C%2Ftext%3E%3Ctext%20font-family%3D%22Times%20New%20Roman%22%20font-size%3D%2213%22%20text-anchor%3D%22middle%22%20x%3D%22158.5%22%20y%3D%2225%22%3E1%3C%2Ftext%3E%3Ctext%20font-family%3D%22bracketse552f5417ff4680c6b50499%22%20font-size%3D%2218%22%20text-anchor%3D%22start%22%20x%3D%22163.5%22%20y%3D%2217%22%3E%26%23x239B%3B%3C%2Ftext%3E%3Ctext%20font-family%3D%22brack_sm2882ad605b1e27be87c7468%22%20font-size%3D%2218%22%20text-anchor%3D%22start%22%20x%3D%22163.5%22%20y%3D%2223%22%3E%26%23x239C%3B%3C%2Ftext%3E%3Ctext%20font-family%3D%22brack_sm2882ad605b1e27be87c7468%22%20font-size%3D%2218%22%20text-anchor%3D%22start%22%20x%3D%22163.5%22%20y%3D%2229%22%3E%26%23x239C%3B%3C%2Ftext%3E%3Ctext%20font-family%3D%22bracketse552f5417ff4680c6b50499%22%20font-size%3D%2218%22%20text-anchor%3D%22start%22%20x%3D%22163.5%22%20y%3D%2245%22%3E%26%23x239D%3B%3C%2Ftext%3E%3Ctext%20font-family%3D%22bracketse552f5417ff4680c6b50499%22%20font-size%3D%2218%22%20text-anchor%3D%22start%22%20x%3D%22187.5%22%20y%3D%2217%22%3E%26%23x239E%3B%3C%2Ftext%3E%3Ctext%20font-family%3D%22brack_sm2882ad605b1e27be87c7468%22%20font-size%3D%2218%22%20text-anchor%3D%22start%22%20x%3D%22187.5%22%20y%3D%2223%22%3E%26%23x239F%3B%3C%2Ftext%3E%3Ctext%20font-family%3D%22brack_sm2882ad605b1e27be87c7468%22%20font-size%3D%2218%22%20text-anchor%3D%22start%22%20x%3D%22187.5%22%20y%3D%2229%22%3E%26%23x239F%3B%3C%2Ftext%3E%3Ctext%20font-family%3D%22bracketse552f5417ff4680c6b50499%22%20font-size%3D%2218%22%20text-anchor%3D%22start%22%20x%3D%22187.5%22%20y%3D%2245%22%3E%26%23x23A0%3B%3C%2Ftext%3E%3Cline%20stroke%3D%22%23000000%22%20stroke-linecap%3D%22square%22%20stroke-width%3D%221%22%20x1%3D%22171.5%22%20x2%3D%22183.5%22%20y1%3D%2223.5%22%20y2%3D%2223.5%22%2F%3E%3Ctext%20font-family%3D%22Times%20New%20Roman%22%20font-size%3D%2218%22%20text-anchor%3D%22middle%22%20x%3D%22177.5%22%20y%3D%2216%22%3E1%3C%2Ftext%3E%3Ctext%20font-family%3D%22Times%20New%20Roman%22%20font-size%3D%2218%22%20text-anchor%3D%22middle%22%20x%3D%22177.5%22%20y%3D%2241%22%3E2%3C%2Ftext%3E%3C%2Fsvg%3E)
format('truetype')%3Bfont-weight%3Anormal%3Bfont-style%3Anormal%3B%7D%3C%2Fstyle%3E%3C%2Fdefs%3E%3Ctext%20font-family%3D%22Times%20New%20Roman%22%20font-size%3D%2218%22%20font-style%3D%22italic%22%20text-anchor%3D%22middle%22%20x%3D%224.5%22%20y%3D%2230%22%3Ey%3C%2Ftext%3E%3Ctext%20font-family%3D%22math17f39f8317fbdb1988ef4c628eb%22%20font-size%3D%2216%22%20text-anchor%3D%22middle%22%20x%3D%2218.5%22%20y%3D%2230%22%3E%3D%3C%2Ftext%3E%3Cline%20stroke%3D%22%23000000%22%20stroke-linecap%3D%22square%22%20stroke-width%3D%221%22%20x1%3D%2229.5%22%20x2%3D%2241.5%22%20y1%3D%2223.5%22%20y2%3D%2223.5%22%2F%3E%3Ctext%20font-family%3D%22Times%20New%20Roman%22%20font-size%3D%2218%22%20text-anchor%3D%22middle%22%20x%3D%2235.5%22%20y%3D%2216%22%3E1%3C%2Ftext%3E%3Ctext%20font-family%3D%22Times%20New%20Roman%22%20font-size%3D%2218%22%20text-anchor%3D%22middle%22%20x%3D%2235.5%22%20y%3D%2241%22%3E2%3C%2Ftext%3E%3C%2Fsvg%3E)
format('truetype')%3Bfont-weight%3Anormal%3Bfont-style%3Anormal%3B%7D%40font-face%7Bfont-family%3A'round_brackets18549f92a457f2409'%3Bsrc%3Aurl(data%3Afont%2Ftruetype%3Bcharset%3Dutf-8%3Bbase64%2CAAEAAAAMAIAAAwBAT1MvMjwHLFQAAADMAAAATmNtYXDf7xCrAAABHAAAADxjdnQgBAkDLgAAAVgAAAASZ2x5ZmAOz2cAAAFsAAABJGhlYWQOKih8AAACkAAAADZoaGVhCvgVwgAAAsgAAAAkaG10eCA6AAIAAALsAAAADGxvY2EAAARLAAAC%2BAAAABBtYXhwBIgEWQAAAwgAAAAgbmFtZXHR30MAAAMoAAACOXBvc3QDogHPAAAFZAAAACBwcmVwupWEAAAABYQAAAAHAAAGcgGQAAUAAAgACAAAAAAACAAIAAAAAAAAAQIAAAAAAAAAAAAAAAAAAAAAAAAAAAAAAAAAAAAAACAgICAAAAAo8AMGe%2F57AAAHPgGyAAAAAAACAAEAAQAAABQAAwABAAAAFAAEACgAAAAGAAQAAQACACgAKf%2F%2FAAAAKAAp%2F%2F%2F%2F2f%2FZAAEAAAAAAAAAAAFUAFYBAAAsAKgDgAAyAAcAAAACAAAAKgDVA1UAAwAHAAA1MxEjEyMRM9XVq4CAKgMr%2FQAC1QABAAD%2B0AIgBtAACQBNGAGwChCwA9SwAxCwAtSwChCwBdSwBRCwANSwAxCwBzywAhCwCDwAsAoQsAPUsAMQsAfUsAoQsAXUsAoQsADUsAMQsAI8sAcQsAg8MTAREAEzABEQASMAAZCQ%2FnABkJD%2BcALQ%2FZD%2BcAGQAnACcAGQ%2FnAAAQAA%2FtACIAbQAAkATRgBsAoQsAPUsAMQsALUsAoQsAXUsAUQsADUsAMQsAc8sAIQsAg8ALAKELAD1LADELAH1LAKELAF1LAKELAA1LADELACPLAHELAIPDEwARABIwAREAEzAAIg%2FnCQAZD%2BcJABkALQ%2FZD%2BcAGQAnACcAGQ%2FnAAAQAAAAEAAPW2NYFfDzz1AAMIAP%2F%2F%2F%2F%2FVre7u%2F%2F%2F%2F%2F9Wt7u4AAP7QA7cG0AAAAAoAAgABAAAAAAABAAAHPv5OAAAXcAAA%2F%2F4DtwABAAAAAAAAAAAAAAAAAAAAAwDVAAACIAAAAiAAAAAAAAAAAAAkAAAAowAAASQAAQAAAAMACgACAAAAAAACAIAEAAAAAAAEAABNAAAAAAAAABUBAgAAAAAAAAABAD4AAAAAAAAAAAACAA4APgAAAAAAAAADAFwATAAAAAAAAAAEAD4AqAAAAAAAAAAFABYA5gAAAAAAAAAGAB8A%2FAAAAAAAAAAIABwBGwABAAAAAAABAD4AAAABAAAAAAACAA4APgABAAAAAAADAFwATAABAAAAAAAEAD4AqAABAAAAAAAFABYA5gABAAAAAAAGAB8A%2FAABAAAAAAAIABwBGwADAAEECQABAD4AAAADAAEECQACAA4APgADAAEECQADAFwATAADAAEECQAEAD4AqAADAAEECQAFABYA5gADAAEECQAGAB8A%2FAADAAEECQAIABwBGwBSAG8AdQBuAGQAIABiAHIAYQBjAGsAZQB0AHMAIAB3AGkAdABoACAAYQBzAGMAZQBuAHQAIAAxADgANQA0AFIAZQBnAHUAbABhAHIATQBhAHQAaABzACAARgBvAHIAIABNAG8AcgBlACAAUgBvAHUAbgBkACAAYgByAGEAYwBrAGUAdABzACAAdwBpAHQAaAAgAGEAcwBjAGUAbgB0ACAAMQA4ADUANABSAG8AdQBuAGQAIABiAHIAYQBjAGsAZQB0AHMAIAB3AGkAdABoACAAYQBzAGMAZQBuAHQAIAAxADgANQA0AFYAZQByAHMAaQBvAG4AIAAyAC4AMFJvdW5kX2JyYWNrZXRzX3dpdGhfYXNjZW50XzE4NTQATQBhAHQAaABzACAARgBvAHIAIABNAG8AcgBlAAAAAAMAAAAAAAADnwHPAAAAAAAAAAAAAAAAAAAAAAAAAAC5B%2F8AAY2FAA%3D%3D)format('truetype')%3Bfont-weight%3Anormal%3Bfont-style%3Anormal%3B%7D%3C%2Fstyle%3E%3C%2Fdefs%3E%3Ctext%20font-family%3D%22Times%20New%20Roman%22%20font-size%3D%2218%22%20text-anchor%3D%22middle%22%20x%3D%2210.5%22%20y%3D%2216%22%3Esin%3C%2Ftext%3E%3Ctext%20font-family%3D%22round_brackets18549f92a457f2409%22%20font-size%3D%2218%22%20text-anchor%3D%22middle%22%20x%3D%2224.5%22%20y%3D%2216%22%3E(%3C%2Ftext%3E%3Ctext%20font-family%3D%22round_brackets18549f92a457f2409%22%20font-size%3D%2218%22%20text-anchor%3D%22middle%22%20x%3D%2252.5%22%20y%3D%2216%22%3E)%3C%2Ftext%3E%3Ctext%20font-family%3D%22math135b31cfba37a56451b4768509d%22%20font-size%3D%2216%22%20text-anchor%3D%22middle%22%20x%3D%2233.5%22%20y%3D%2216%22%3E%26%23x2212%3B%3C%2Ftext%3E%3Ctext%20font-family%3D%22Times%20New%20Roman%22%20font-size%3D%2218%22%20font-style%3D%22italic%22%20text-anchor%3D%22middle%22%20x%3D%2244.5%22%20y%3D%2216%22%3Ex%3C%2Ftext%3E%3Ctext%20font-family%3D%22math135b31cfba37a56451b4768509d%22%20font-size%3D%2216%22%20text-anchor%3D%22middle%22%20x%3D%2264.5%22%20y%3D%2216%22%3E%3D%3C%2Ftext%3E%3Ctext%20font-family%3D%22math135b31cfba37a56451b4768509d%22%20font-size%3D%2216%22%20text-anchor%3D%22middle%22%20x%3D%2281.5%22%20y%3D%2216%22%3E%26%23x2212%3B%3C%2Ftext%3E%3Ctext%20font-family%3D%22Times%20New%20Roman%22%20font-size%3D%2218%22%20text-anchor%3D%22middle%22%20x%3D%22100.5%22%20y%3D%2216%22%3Esin%3C%2Ftext%3E%3Ctext%20font-family%3D%22Times%20New%20Roman%22%20font-size%3D%2218%22%20font-style%3D%22italic%22%20text-anchor%3D%22middle%22%20x%3D%22115.5%22%20y%3D%2216%22%3Ex%3C%2Ftext%3E%3C%2Fsvg%3E)
format('truetype')%3Bfont-weight%3Anormal%3Bfont-style%3Anormal%3B%7D%40font-face%7Bfont-family%3A'round_brackets18549f92a457f2409'%3Bsrc%3Aurl(data%3Afont%2Ftruetype%3Bcharset%3Dutf-8%3Bbase64%2CAAEAAAAMAIAAAwBAT1MvMjwHLFQAAADMAAAATmNtYXDf7xCrAAABHAAAADxjdnQgBAkDLgAAAVgAAAASZ2x5ZmAOz2cAAAFsAAABJGhlYWQOKih8AAACkAAAADZoaGVhCvgVwgAAAsgAAAAkaG10eCA6AAIAAALsAAAADGxvY2EAAARLAAAC%2BAAAABBtYXhwBIgEWQAAAwgAAAAgbmFtZXHR30MAAAMoAAACOXBvc3QDogHPAAAFZAAAACBwcmVwupWEAAAABYQAAAAHAAAGcgGQAAUAAAgACAAAAAAACAAIAAAAAAAAAQIAAAAAAAAAAAAAAAAAAAAAAAAAAAAAAAAAAAAAACAgICAAAAAo8AMGe%2F57AAAHPgGyAAAAAAACAAEAAQAAABQAAwABAAAAFAAEACgAAAAGAAQAAQACACgAKf%2F%2FAAAAKAAp%2F%2F%2F%2F2f%2FZAAEAAAAAAAAAAAFUAFYBAAAsAKgDgAAyAAcAAAACAAAAKgDVA1UAAwAHAAA1MxEjEyMRM9XVq4CAKgMr%2FQAC1QABAAD%2B0AIgBtAACQBNGAGwChCwA9SwAxCwAtSwChCwBdSwBRCwANSwAxCwBzywAhCwCDwAsAoQsAPUsAMQsAfUsAoQsAXUsAoQsADUsAMQsAI8sAcQsAg8MTAREAEzABEQASMAAZCQ%2FnABkJD%2BcALQ%2FZD%2BcAGQAnACcAGQ%2FnAAAQAA%2FtACIAbQAAkATRgBsAoQsAPUsAMQsALUsAoQsAXUsAUQsADUsAMQsAc8sAIQsAg8ALAKELAD1LADELAH1LAKELAF1LAKELAA1LADELACPLAHELAIPDEwARABIwAREAEzAAIg%2FnCQAZD%2BcJABkALQ%2FZD%2BcAGQAnACcAGQ%2FnAAAQAAAAEAAPW2NYFfDzz1AAMIAP%2F%2F%2F%2F%2FVre7u%2F%2F%2F%2F%2F9Wt7u4AAP7QA7cG0AAAAAoAAgABAAAAAAABAAAHPv5OAAAXcAAA%2F%2F4DtwABAAAAAAAAAAAAAAAAAAAAAwDVAAACIAAAAiAAAAAAAAAAAAAkAAAAowAAASQAAQAAAAMACgACAAAAAAACAIAEAAAAAAAEAABNAAAAAAAAABUBAgAAAAAAAAABAD4AAAAAAAAAAAACAA4APgAAAAAAAAADAFwATAAAAAAAAAAEAD4AqAAAAAAAAAAFABYA5gAAAAAAAAAGAB8A%2FAAAAAAAAAAIABwBGwABAAAAAAABAD4AAAABAAAAAAACAA4APgABAAAAAAADAFwATAABAAAAAAAEAD4AqAABAAAAAAAFABYA5gABAAAAAAAGAB8A%2FAABAAAAAAAIABwBGwADAAEECQABAD4AAAADAAEECQACAA4APgADAAEECQADAFwATAADAAEECQAEAD4AqAADAAEECQAFABYA5gADAAEECQAGAB8A%2FAADAAEECQAIABwBGwBSAG8AdQBuAGQAIABiAHIAYQBjAGsAZQB0AHMAIAB3AGkAdABoACAAYQBzAGMAZQBuAHQAIAAxADgANQA0AFIAZQBnAHUAbABhAHIATQBhAHQAaABzACAARgBvAHIAIABNAG8AcgBlACAAUgBvAHUAbgBkACAAYgByAGEAYwBrAGUAdABzACAAdwBpAHQAaAAgAGEAcwBjAGUAbgB0ACAAMQA4ADUANABSAG8AdQBuAGQAIABiAHIAYQBjAGsAZQB0AHMAIAB3AGkAdABoACAAYQBzAGMAZQBuAHQAIAAxADgANQA0AFYAZQByAHMAaQBvAG4AIAAyAC4AMFJvdW5kX2JyYWNrZXRzX3dpdGhfYXNjZW50XzE4NTQATQBhAHQAaABzACAARgBvAHIAIABNAG8AcgBlAAAAAAMAAAAAAAADnwHPAAAAAAAAAAAAAAAAAAAAAAAAAAC5B%2F8AAY2FAA%3D%3D)format('truetype')%3Bfont-weight%3Anormal%3Bfont-style%3Anormal%3B%7D%3C%2Fstyle%3E%3C%2Fdefs%3E%3Ctext%20font-family%3D%22Times%20New%20Roman%22%20font-size%3D%2218%22%20text-anchor%3D%22middle%22%20x%3D%2210.5%22%20y%3D%2216%22%3Esin%3C%2Ftext%3E%3Ctext%20font-family%3D%22Times%20New%20Roman%22%20font-size%3D%2218%22%20font-style%3D%22italic%22%20text-anchor%3D%22middle%22%20x%3D%2225.5%22%20y%3D%2216%22%3Ex%3C%2Ftext%3E%3Ctext%20font-family%3D%22math1b8e855ae38b0b5ed2ea1919b93%22%20font-size%3D%2216%22%20text-anchor%3D%22middle%22%20x%3D%2239.5%22%20y%3D%2216%22%3E%3D%3C%2Ftext%3E%3Ctext%20font-family%3D%22Times%20New%20Roman%22%20font-size%3D%2218%22%20text-anchor%3D%22middle%22%20x%3D%2258.5%22%20y%3D%2216%22%3Esin%3C%2Ftext%3E%3Ctext%20font-family%3D%22round_brackets18549f92a457f2409%22%20font-size%3D%2218%22%20text-anchor%3D%22middle%22%20x%3D%2272.5%22%20y%3D%2216%22%3E(%3C%2Ftext%3E%3Ctext%20font-family%3D%22round_brackets18549f92a457f2409%22%20font-size%3D%2218%22%20text-anchor%3D%22middle%22%20x%3D%22139.5%22%20y%3D%2216%22%3E)%3C%2Ftext%3E%3Ctext%20font-family%3D%22Times%20New%20Roman%22%20font-size%3D%2218%22%20text-anchor%3D%22middle%22%20x%3D%2288.5%22%20y%3D%2216%22%3E180%3C%2Ftext%3E%3Ctext%20font-family%3D%22math1b8e855ae38b0b5ed2ea1919b93%22%20font-size%3D%2216%22%20text-anchor%3D%22middle%22%20x%3D%22106.5%22%20y%3D%2216%22%3E%26%23xB0%3B%3C%2Ftext%3E%3Ctext%20font-family%3D%22math1b8e855ae38b0b5ed2ea1919b93%22%20font-size%3D%2216%22%20text-anchor%3D%22middle%22%20x%3D%22118.5%22%20y%3D%2216%22%3E%26%23x2212%3B%3C%2Ftext%3E%3Ctext%20font-family%3D%22Times%20New%20Roman%22%20font-size%3D%2218%22%20font-style%3D%22italic%22%20text-anchor%3D%22middle%22%20x%3D%22131.5%22%20y%3D%2216%22%3Ex%3C%2Ftext%3E%3C%2Fsvg%3E)
format('truetype')%3Bfont-weight%3Anormal%3Bfont-style%3Anormal%3B%7D%40font-face%7Bfont-family%3A'round_brackets18549f92a457f2409'%3Bsrc%3Aurl(data%3Afont%2Ftruetype%3Bcharset%3Dutf-8%3Bbase64%2CAAEAAAAMAIAAAwBAT1MvMjwHLFQAAADMAAAATmNtYXDf7xCrAAABHAAAADxjdnQgBAkDLgAAAVgAAAASZ2x5ZmAOz2cAAAFsAAABJGhlYWQOKih8AAACkAAAADZoaGVhCvgVwgAAAsgAAAAkaG10eCA6AAIAAALsAAAADGxvY2EAAARLAAAC%2BAAAABBtYXhwBIgEWQAAAwgAAAAgbmFtZXHR30MAAAMoAAACOXBvc3QDogHPAAAFZAAAACBwcmVwupWEAAAABYQAAAAHAAAGcgGQAAUAAAgACAAAAAAACAAIAAAAAAAAAQIAAAAAAAAAAAAAAAAAAAAAAAAAAAAAAAAAAAAAACAgICAAAAAo8AMGe%2F57AAAHPgGyAAAAAAACAAEAAQAAABQAAwABAAAAFAAEACgAAAAGAAQAAQACACgAKf%2F%2FAAAAKAAp%2F%2F%2F%2F2f%2FZAAEAAAAAAAAAAAFUAFYBAAAsAKgDgAAyAAcAAAACAAAAKgDVA1UAAwAHAAA1MxEjEyMRM9XVq4CAKgMr%2FQAC1QABAAD%2B0AIgBtAACQBNGAGwChCwA9SwAxCwAtSwChCwBdSwBRCwANSwAxCwBzywAhCwCDwAsAoQsAPUsAMQsAfUsAoQsAXUsAoQsADUsAMQsAI8sAcQsAg8MTAREAEzABEQASMAAZCQ%2FnABkJD%2BcALQ%2FZD%2BcAGQAnACcAGQ%2FnAAAQAA%2FtACIAbQAAkATRgBsAoQsAPUsAMQsALUsAoQsAXUsAUQsADUsAMQsAc8sAIQsAg8ALAKELAD1LADELAH1LAKELAF1LAKELAA1LADELACPLAHELAIPDEwARABIwAREAEzAAIg%2FnCQAZD%2BcJABkALQ%2FZD%2BcAGQAnACcAGQ%2FnAAAQAAAAEAAPW2NYFfDzz1AAMIAP%2F%2F%2F%2F%2FVre7u%2F%2F%2F%2F%2F9Wt7u4AAP7QA7cG0AAAAAoAAgABAAAAAAABAAAHPv5OAAAXcAAA%2F%2F4DtwABAAAAAAAAAAAAAAAAAAAAAwDVAAACIAAAAiAAAAAAAAAAAAAkAAAAowAAASQAAQAAAAMACgACAAAAAAACAIAEAAAAAAAEAABNAAAAAAAAABUBAgAAAAAAAAABAD4AAAAAAAAAAAACAA4APgAAAAAAAAADAFwATAAAAAAAAAAEAD4AqAAAAAAAAAAFABYA5gAAAAAAAAAGAB8A%2FAAAAAAAAAAIABwBGwABAAAAAAABAD4AAAABAAAAAAACAA4APgABAAAAAAADAFwATAABAAAAAAAEAD4AqAABAAAAAAAFABYA5gABAAAAAAAGAB8A%2FAABAAAAAAAIABwBGwADAAEECQABAD4AAAADAAEECQACAA4APgADAAEECQADAFwATAADAAEECQAEAD4AqAADAAEECQAFABYA5gADAAEECQAGAB8A%2FAADAAEECQAIABwBGwBSAG8AdQBuAGQAIABiAHIAYQBjAGsAZQB0AHMAIAB3AGkAdABoACAAYQBzAGMAZQBuAHQAIAAxADgANQA0AFIAZQBnAHUAbABhAHIATQBhAHQAaABzACAARgBvAHIAIABNAG8AcgBlACAAUgBvAHUAbgBkACAAYgByAGEAYwBrAGUAdABzACAAdwBpAHQAaAAgAGEAcwBjAGUAbgB0ACAAMQA4ADUANABSAG8AdQBuAGQAIABiAHIAYQBjAGsAZQB0AHMAIAB3AGkAdABoACAAYQBzAGMAZQBuAHQAIAAxADgANQA0AFYAZQByAHMAaQBvAG4AIAAyAC4AMFJvdW5kX2JyYWNrZXRzX3dpdGhfYXNjZW50XzE4NTQATQBhAHQAaABzACAARgBvAHIAIABNAG8AcgBlAAAAAAMAAAAAAAADnwHPAAAAAAAAAAAAAAAAAAAAAAAAAAC5B%2F8AAY2FAA%3D%3D)format('truetype')%3Bfont-weight%3Anormal%3Bfont-style%3Anormal%3B%7D%3C%2Fstyle%3E%3C%2Fdefs%3E%3Ctext%20font-family%3D%22Times%20New%20Roman%22%20font-size%3D%2218%22%20text-anchor%3D%22middle%22%20x%3D%2210.5%22%20y%3D%2216%22%3Esin%3C%2Ftext%3E%3Ctext%20font-family%3D%22Times%20New%20Roman%22%20font-size%3D%2218%22%20font-style%3D%22italic%22%20text-anchor%3D%22middle%22%20x%3D%2225.5%22%20y%3D%2216%22%3Ex%3C%2Ftext%3E%3Ctext%20font-family%3D%22math1bb31387dafcdfde3d14dfd0d9b%22%20font-size%3D%2216%22%20text-anchor%3D%22middle%22%20x%3D%2239.5%22%20y%3D%2216%22%3E%3D%3C%2Ftext%3E%3Ctext%20font-family%3D%22Times%20New%20Roman%22%20font-size%3D%2218%22%20text-anchor%3D%22middle%22%20x%3D%2258.5%22%20y%3D%2216%22%3Esin%3C%2Ftext%3E%3Ctext%20font-family%3D%22round_brackets18549f92a457f2409%22%20font-size%3D%2218%22%20text-anchor%3D%22middle%22%20x%3D%2272.5%22%20y%3D%2216%22%3E(%3C%2Ftext%3E%3Ctext%20font-family%3D%22round_brackets18549f92a457f2409%22%20font-size%3D%2218%22%20text-anchor%3D%22middle%22%20x%3D%22117.5%22%20y%3D%2216%22%3E)%3C%2Ftext%3E%3Ctext%20font-family%3D%22math1bb31387dafcdfde3d14dfd0d9b%22%20font-size%3D%2216%22%20font-style%3D%22italic%22%20text-anchor%3D%22middle%22%20x%3D%2281.5%22%20y%3D%2216%22%3E%26%23x3C0%3B%3C%2Ftext%3E%3Ctext%20font-family%3D%22math1bb31387dafcdfde3d14dfd0d9b%22%20font-size%3D%2216%22%20text-anchor%3D%22middle%22%20x%3D%2296.5%22%20y%3D%2216%22%3E%26%23x2212%3B%3C%2Ftext%3E%3Ctext%20font-family%3D%22Times%20New%20Roman%22%20font-size%3D%2218%22%20font-style%3D%22italic%22%20text-anchor%3D%22middle%22%20x%3D%22109.5%22%20y%3D%2216%22%3Ex%3C%2Ftext%3E%3C%2Fsvg%3E) in radians
in radiansformat('truetype')%3Bfont-weight%3Anormal%3Bfont-style%3Anormal%3B%7D%40font-face%7Bfont-family%3A'round_brackets18549f92a457f2409'%3Bsrc%3Aurl(data%3Afont%2Ftruetype%3Bcharset%3Dutf-8%3Bbase64%2CAAEAAAAMAIAAAwBAT1MvMjwHLFQAAADMAAAATmNtYXDf7xCrAAABHAAAADxjdnQgBAkDLgAAAVgAAAASZ2x5ZmAOz2cAAAFsAAABJGhlYWQOKih8AAACkAAAADZoaGVhCvgVwgAAAsgAAAAkaG10eCA6AAIAAALsAAAADGxvY2EAAARLAAAC%2BAAAABBtYXhwBIgEWQAAAwgAAAAgbmFtZXHR30MAAAMoAAACOXBvc3QDogHPAAAFZAAAACBwcmVwupWEAAAABYQAAAAHAAAGcgGQAAUAAAgACAAAAAAACAAIAAAAAAAAAQIAAAAAAAAAAAAAAAAAAAAAAAAAAAAAAAAAAAAAACAgICAAAAAo8AMGe%2F57AAAHPgGyAAAAAAACAAEAAQAAABQAAwABAAAAFAAEACgAAAAGAAQAAQACACgAKf%2F%2FAAAAKAAp%2F%2F%2F%2F2f%2FZAAEAAAAAAAAAAAFUAFYBAAAsAKgDgAAyAAcAAAACAAAAKgDVA1UAAwAHAAA1MxEjEyMRM9XVq4CAKgMr%2FQAC1QABAAD%2B0AIgBtAACQBNGAGwChCwA9SwAxCwAtSwChCwBdSwBRCwANSwAxCwBzywAhCwCDwAsAoQsAPUsAMQsAfUsAoQsAXUsAoQsADUsAMQsAI8sAcQsAg8MTAREAEzABEQASMAAZCQ%2FnABkJD%2BcALQ%2FZD%2BcAGQAnACcAGQ%2FnAAAQAA%2FtACIAbQAAkATRgBsAoQsAPUsAMQsALUsAoQsAXUsAUQsADUsAMQsAc8sAIQsAg8ALAKELAD1LADELAH1LAKELAF1LAKELAA1LADELACPLAHELAIPDEwARABIwAREAEzAAIg%2FnCQAZD%2BcJABkALQ%2FZD%2BcAGQAnACcAGQ%2FnAAAQAAAAEAAPW2NYFfDzz1AAMIAP%2F%2F%2F%2F%2FVre7u%2F%2F%2F%2F%2F9Wt7u4AAP7QA7cG0AAAAAoAAgABAAAAAAABAAAHPv5OAAAXcAAA%2F%2F4DtwABAAAAAAAAAAAAAAAAAAAAAwDVAAACIAAAAiAAAAAAAAAAAAAkAAAAowAAASQAAQAAAAMACgACAAAAAAACAIAEAAAAAAAEAABNAAAAAAAAABUBAgAAAAAAAAABAD4AAAAAAAAAAAACAA4APgAAAAAAAAADAFwATAAAAAAAAAAEAD4AqAAAAAAAAAAFABYA5gAAAAAAAAAGAB8A%2FAAAAAAAAAAIABwBGwABAAAAAAABAD4AAAABAAAAAAACAA4APgABAAAAAAADAFwATAABAAAAAAAEAD4AqAABAAAAAAAFABYA5gABAAAAAAAGAB8A%2FAABAAAAAAAIABwBGwADAAEECQABAD4AAAADAAEECQACAA4APgADAAEECQADAFwATAADAAEECQAEAD4AqAADAAEECQAFABYA5gADAAEECQAGAB8A%2FAADAAEECQAIABwBGwBSAG8AdQBuAGQAIABiAHIAYQBjAGsAZQB0AHMAIAB3AGkAdABoACAAYQBzAGMAZQBuAHQAIAAxADgANQA0AFIAZQBnAHUAbABhAHIATQBhAHQAaABzACAARgBvAHIAIABNAG8AcgBlACAAUgBvAHUAbgBkACAAYgByAGEAYwBrAGUAdABzACAAdwBpAHQAaAAgAGEAcwBjAGUAbgB0ACAAMQA4ADUANABSAG8AdQBuAGQAIABiAHIAYQBjAGsAZQB0AHMAIAB3AGkAdABoACAAYQBzAGMAZQBuAHQAIAAxADgANQA0AFYAZQByAHMAaQBvAG4AIAAyAC4AMFJvdW5kX2JyYWNrZXRzX3dpdGhfYXNjZW50XzE4NTQATQBhAHQAaABzACAARgBvAHIAIABNAG8AcgBlAAAAAAMAAAAAAAADnwHPAAAAAAAAAAAAAAAAAAAAAAAAAAC5B%2F8AAY2FAA%3D%3D)format('truetype')%3Bfont-weight%3Anormal%3Bfont-style%3Anormal%3B%7D%3C%2Fstyle%3E%3C%2Fdefs%3E%3Ctext%20font-family%3D%22Times%20New%20Roman%22%20font-size%3D%2218%22%20text-anchor%3D%22middle%22%20x%3D%2212.5%22%20y%3D%2216%22%3Ecos%3C%2Ftext%3E%3Ctext%20font-family%3D%22round_brackets18549f92a457f2409%22%20font-size%3D%2218%22%20text-anchor%3D%22middle%22%20x%3D%2227.5%22%20y%3D%2216%22%3E(%3C%2Ftext%3E%3Ctext%20font-family%3D%22round_brackets18549f92a457f2409%22%20font-size%3D%2218%22%20text-anchor%3D%22middle%22%20x%3D%2255.5%22%20y%3D%2216%22%3E)%3C%2Ftext%3E%3Ctext%20font-family%3D%22math135b31cfba37a56451b4768509d%22%20font-size%3D%2216%22%20text-anchor%3D%22middle%22%20x%3D%2236.5%22%20y%3D%2216%22%3E%26%23x2212%3B%3C%2Ftext%3E%3Ctext%20font-family%3D%22Times%20New%20Roman%22%20font-size%3D%2218%22%20font-style%3D%22italic%22%20text-anchor%3D%22middle%22%20x%3D%2247.5%22%20y%3D%2216%22%3Ex%3C%2Ftext%3E%3Ctext%20font-family%3D%22math135b31cfba37a56451b4768509d%22%20font-size%3D%2216%22%20text-anchor%3D%22middle%22%20x%3D%2267.5%22%20y%3D%2216%22%3E%3D%3C%2Ftext%3E%3Ctext%20font-family%3D%22Times%20New%20Roman%22%20font-size%3D%2218%22%20text-anchor%3D%22middle%22%20x%3D%2288.5%22%20y%3D%2216%22%3Ecos%3C%2Ftext%3E%3Ctext%20font-family%3D%22Times%20New%20Roman%22%20font-size%3D%2218%22%20font-style%3D%22italic%22%20text-anchor%3D%22middle%22%20x%3D%22104.5%22%20y%3D%2216%22%3Ex%3C%2Ftext%3E%3C%2Fsvg%3E)
format('truetype')%3Bfont-weight%3Anormal%3Bfont-style%3Anormal%3B%7D%40font-face%7Bfont-family%3A'round_brackets18549f92a457f2409'%3Bsrc%3Aurl(data%3Afont%2Ftruetype%3Bcharset%3Dutf-8%3Bbase64%2CAAEAAAAMAIAAAwBAT1MvMjwHLFQAAADMAAAATmNtYXDf7xCrAAABHAAAADxjdnQgBAkDLgAAAVgAAAASZ2x5ZmAOz2cAAAFsAAABJGhlYWQOKih8AAACkAAAADZoaGVhCvgVwgAAAsgAAAAkaG10eCA6AAIAAALsAAAADGxvY2EAAARLAAAC%2BAAAABBtYXhwBIgEWQAAAwgAAAAgbmFtZXHR30MAAAMoAAACOXBvc3QDogHPAAAFZAAAACBwcmVwupWEAAAABYQAAAAHAAAGcgGQAAUAAAgACAAAAAAACAAIAAAAAAAAAQIAAAAAAAAAAAAAAAAAAAAAAAAAAAAAAAAAAAAAACAgICAAAAAo8AMGe%2F57AAAHPgGyAAAAAAACAAEAAQAAABQAAwABAAAAFAAEACgAAAAGAAQAAQACACgAKf%2F%2FAAAAKAAp%2F%2F%2F%2F2f%2FZAAEAAAAAAAAAAAFUAFYBAAAsAKgDgAAyAAcAAAACAAAAKgDVA1UAAwAHAAA1MxEjEyMRM9XVq4CAKgMr%2FQAC1QABAAD%2B0AIgBtAACQBNGAGwChCwA9SwAxCwAtSwChCwBdSwBRCwANSwAxCwBzywAhCwCDwAsAoQsAPUsAMQsAfUsAoQsAXUsAoQsADUsAMQsAI8sAcQsAg8MTAREAEzABEQASMAAZCQ%2FnABkJD%2BcALQ%2FZD%2BcAGQAnACcAGQ%2FnAAAQAA%2FtACIAbQAAkATRgBsAoQsAPUsAMQsALUsAoQsAXUsAUQsADUsAMQsAc8sAIQsAg8ALAKELAD1LADELAH1LAKELAF1LAKELAA1LADELACPLAHELAIPDEwARABIwAREAEzAAIg%2FnCQAZD%2BcJABkALQ%2FZD%2BcAGQAnACcAGQ%2FnAAAQAAAAEAAPW2NYFfDzz1AAMIAP%2F%2F%2F%2F%2FVre7u%2F%2F%2F%2F%2F9Wt7u4AAP7QA7cG0AAAAAoAAgABAAAAAAABAAAHPv5OAAAXcAAA%2F%2F4DtwABAAAAAAAAAAAAAAAAAAAAAwDVAAACIAAAAiAAAAAAAAAAAAAkAAAAowAAASQAAQAAAAMACgACAAAAAAACAIAEAAAAAAAEAABNAAAAAAAAABUBAgAAAAAAAAABAD4AAAAAAAAAAAACAA4APgAAAAAAAAADAFwATAAAAAAAAAAEAD4AqAAAAAAAAAAFABYA5gAAAAAAAAAGAB8A%2FAAAAAAAAAAIABwBGwABAAAAAAABAD4AAAABAAAAAAACAA4APgABAAAAAAADAFwATAABAAAAAAAEAD4AqAABAAAAAAAFABYA5gABAAAAAAAGAB8A%2FAABAAAAAAAIABwBGwADAAEECQABAD4AAAADAAEECQACAA4APgADAAEECQADAFwATAADAAEECQAEAD4AqAADAAEECQAFABYA5gADAAEECQAGAB8A%2FAADAAEECQAIABwBGwBSAG8AdQBuAGQAIABiAHIAYQBjAGsAZQB0AHMAIAB3AGkAdABoACAAYQBzAGMAZQBuAHQAIAAxADgANQA0AFIAZQBnAHUAbABhAHIATQBhAHQAaABzACAARgBvAHIAIABNAG8AcgBlACAAUgBvAHUAbgBkACAAYgByAGEAYwBrAGUAdABzACAAdwBpAHQAaAAgAGEAcwBjAGUAbgB0ACAAMQA4ADUANABSAG8AdQBuAGQAIABiAHIAYQBjAGsAZQB0AHMAIAB3AGkAdABoACAAYQBzAGMAZQBuAHQAIAAxADgANQA0AFYAZQByAHMAaQBvAG4AIAAyAC4AMFJvdW5kX2JyYWNrZXRzX3dpdGhfYXNjZW50XzE4NTQATQBhAHQAaABzACAARgBvAHIAIABNAG8AcgBlAAAAAAMAAAAAAAADnwHPAAAAAAAAAAAAAAAAAAAAAAAAAAC5B%2F8AAY2FAA%3D%3D)format('truetype')%3Bfont-weight%3Anormal%3Bfont-style%3Anormal%3B%7D%3C%2Fstyle%3E%3C%2Fdefs%3E%3Ctext%20font-family%3D%22Times%20New%20Roman%22%20font-size%3D%2218%22%20text-anchor%3D%22middle%22%20x%3D%2212.5%22%20y%3D%2216%22%3Ecos%3C%2Ftext%3E%3Ctext%20font-family%3D%22Times%20New%20Roman%22%20font-size%3D%2218%22%20font-style%3D%22italic%22%20text-anchor%3D%22middle%22%20x%3D%2228.5%22%20y%3D%2216%22%3Ex%3C%2Ftext%3E%3Ctext%20font-family%3D%22math1b8e855ae38b0b5ed2ea1919b93%22%20font-size%3D%2216%22%20text-anchor%3D%22middle%22%20x%3D%2242.5%22%20y%3D%2216%22%3E%3D%3C%2Ftext%3E%3Ctext%20font-family%3D%22Times%20New%20Roman%22%20font-size%3D%2218%22%20text-anchor%3D%22middle%22%20x%3D%2263.5%22%20y%3D%2216%22%3Ecos%3C%2Ftext%3E%3Ctext%20font-family%3D%22round_brackets18549f92a457f2409%22%20font-size%3D%2218%22%20text-anchor%3D%22middle%22%20x%3D%2278.5%22%20y%3D%2216%22%3E(%3C%2Ftext%3E%3Ctext%20font-family%3D%22round_brackets18549f92a457f2409%22%20font-size%3D%2218%22%20text-anchor%3D%22middle%22%20x%3D%22145.5%22%20y%3D%2216%22%3E)%3C%2Ftext%3E%3Ctext%20font-family%3D%22Times%20New%20Roman%22%20font-size%3D%2218%22%20text-anchor%3D%22middle%22%20x%3D%2294.5%22%20y%3D%2216%22%3E360%3C%2Ftext%3E%3Ctext%20font-family%3D%22math1b8e855ae38b0b5ed2ea1919b93%22%20font-size%3D%2216%22%20text-anchor%3D%22middle%22%20x%3D%22112.5%22%20y%3D%2216%22%3E%26%23xB0%3B%3C%2Ftext%3E%3Ctext%20font-family%3D%22math1b8e855ae38b0b5ed2ea1919b93%22%20font-size%3D%2216%22%20text-anchor%3D%22middle%22%20x%3D%22124.5%22%20y%3D%2216%22%3E%26%23x2212%3B%3C%2Ftext%3E%3Ctext%20font-family%3D%22Times%20New%20Roman%22%20font-size%3D%2218%22%20font-style%3D%22italic%22%20text-anchor%3D%22middle%22%20x%3D%22137.5%22%20y%3D%2216%22%3Ex%3C%2Ftext%3E%3C%2Fsvg%3E)
format('truetype')%3Bfont-weight%3Anormal%3Bfont-style%3Anormal%3B%7D%40font-face%7Bfont-family%3A'round_brackets18549f92a457f2409'%3Bsrc%3Aurl(data%3Afont%2Ftruetype%3Bcharset%3Dutf-8%3Bbase64%2CAAEAAAAMAIAAAwBAT1MvMjwHLFQAAADMAAAATmNtYXDf7xCrAAABHAAAADxjdnQgBAkDLgAAAVgAAAASZ2x5ZmAOz2cAAAFsAAABJGhlYWQOKih8AAACkAAAADZoaGVhCvgVwgAAAsgAAAAkaG10eCA6AAIAAALsAAAADGxvY2EAAARLAAAC%2BAAAABBtYXhwBIgEWQAAAwgAAAAgbmFtZXHR30MAAAMoAAACOXBvc3QDogHPAAAFZAAAACBwcmVwupWEAAAABYQAAAAHAAAGcgGQAAUAAAgACAAAAAAACAAIAAAAAAAAAQIAAAAAAAAAAAAAAAAAAAAAAAAAAAAAAAAAAAAAACAgICAAAAAo8AMGe%2F57AAAHPgGyAAAAAAACAAEAAQAAABQAAwABAAAAFAAEACgAAAAGAAQAAQACACgAKf%2F%2FAAAAKAAp%2F%2F%2F%2F2f%2FZAAEAAAAAAAAAAAFUAFYBAAAsAKgDgAAyAAcAAAACAAAAKgDVA1UAAwAHAAA1MxEjEyMRM9XVq4CAKgMr%2FQAC1QABAAD%2B0AIgBtAACQBNGAGwChCwA9SwAxCwAtSwChCwBdSwBRCwANSwAxCwBzywAhCwCDwAsAoQsAPUsAMQsAfUsAoQsAXUsAoQsADUsAMQsAI8sAcQsAg8MTAREAEzABEQASMAAZCQ%2FnABkJD%2BcALQ%2FZD%2BcAGQAnACcAGQ%2FnAAAQAA%2FtACIAbQAAkATRgBsAoQsAPUsAMQsALUsAoQsAXUsAUQsADUsAMQsAc8sAIQsAg8ALAKELAD1LADELAH1LAKELAF1LAKELAA1LADELACPLAHELAIPDEwARABIwAREAEzAAIg%2FnCQAZD%2BcJABkALQ%2FZD%2BcAGQAnACcAGQ%2FnAAAQAAAAEAAPW2NYFfDzz1AAMIAP%2F%2F%2F%2F%2FVre7u%2F%2F%2F%2F%2F9Wt7u4AAP7QA7cG0AAAAAoAAgABAAAAAAABAAAHPv5OAAAXcAAA%2F%2F4DtwABAAAAAAAAAAAAAAAAAAAAAwDVAAACIAAAAiAAAAAAAAAAAAAkAAAAowAAASQAAQAAAAMACgACAAAAAAACAIAEAAAAAAAEAABNAAAAAAAAABUBAgAAAAAAAAABAD4AAAAAAAAAAAACAA4APgAAAAAAAAADAFwATAAAAAAAAAAEAD4AqAAAAAAAAAAFABYA5gAAAAAAAAAGAB8A%2FAAAAAAAAAAIABwBGwABAAAAAAABAD4AAAABAAAAAAACAA4APgABAAAAAAADAFwATAABAAAAAAAEAD4AqAABAAAAAAAFABYA5gABAAAAAAAGAB8A%2FAABAAAAAAAIABwBGwADAAEECQABAD4AAAADAAEECQACAA4APgADAAEECQADAFwATAADAAEECQAEAD4AqAADAAEECQAFABYA5gADAAEECQAGAB8A%2FAADAAEECQAIABwBGwBSAG8AdQBuAGQAIABiAHIAYQBjAGsAZQB0AHMAIAB3AGkAdABoACAAYQBzAGMAZQBuAHQAIAAxADgANQA0AFIAZQBnAHUAbABhAHIATQBhAHQAaABzACAARgBvAHIAIABNAG8AcgBlACAAUgBvAHUAbgBkACAAYgByAGEAYwBrAGUAdABzACAAdwBpAHQAaAAgAGEAcwBjAGUAbgB0ACAAMQA4ADUANABSAG8AdQBuAGQAIABiAHIAYQBjAGsAZQB0AHMAIAB3AGkAdABoACAAYQBzAGMAZQBuAHQAIAAxADgANQA0AFYAZQByAHMAaQBvAG4AIAAyAC4AMFJvdW5kX2JyYWNrZXRzX3dpdGhfYXNjZW50XzE4NTQATQBhAHQAaABzACAARgBvAHIAIABNAG8AcgBlAAAAAAMAAAAAAAADnwHPAAAAAAAAAAAAAAAAAAAAAAAAAAC5B%2F8AAY2FAA%3D%3D)format('truetype')%3Bfont-weight%3Anormal%3Bfont-style%3Anormal%3B%7D%3C%2Fstyle%3E%3C%2Fdefs%3E%3Ctext%20font-family%3D%22Times%20New%20Roman%22%20font-size%3D%2218%22%20text-anchor%3D%22middle%22%20x%3D%2212.5%22%20y%3D%2216%22%3Ecos%3C%2Ftext%3E%3Ctext%20font-family%3D%22Times%20New%20Roman%22%20font-size%3D%2218%22%20font-style%3D%22italic%22%20text-anchor%3D%22middle%22%20x%3D%2228.5%22%20y%3D%2216%22%3Ex%3C%2Ftext%3E%3Ctext%20font-family%3D%22math1bb31387dafcdfde3d14dfd0d9b%22%20font-size%3D%2216%22%20text-anchor%3D%22middle%22%20x%3D%2242.5%22%20y%3D%2216%22%3E%3D%3C%2Ftext%3E%3Ctext%20font-family%3D%22Times%20New%20Roman%22%20font-size%3D%2218%22%20text-anchor%3D%22middle%22%20x%3D%2263.5%22%20y%3D%2216%22%3Ecos%3C%2Ftext%3E%3Ctext%20font-family%3D%22round_brackets18549f92a457f2409%22%20font-size%3D%2218%22%20text-anchor%3D%22middle%22%20x%3D%2278.5%22%20y%3D%2216%22%3E(%3C%2Ftext%3E%3Ctext%20font-family%3D%22round_brackets18549f92a457f2409%22%20font-size%3D%2218%22%20text-anchor%3D%22middle%22%20x%3D%22132.5%22%20y%3D%2216%22%3E)%3C%2Ftext%3E%3Ctext%20font-family%3D%22Times%20New%20Roman%22%20font-size%3D%2218%22%20text-anchor%3D%22middle%22%20x%3D%2285.5%22%20y%3D%2216%22%3E2%3C%2Ftext%3E%3Ctext%20font-family%3D%22math1bb31387dafcdfde3d14dfd0d9b%22%20font-size%3D%2216%22%20font-style%3D%22italic%22%20text-anchor%3D%22middle%22%20x%3D%2296.5%22%20y%3D%2216%22%3E%26%23x3C0%3B%3C%2Ftext%3E%3Ctext%20font-family%3D%22math1bb31387dafcdfde3d14dfd0d9b%22%20font-size%3D%2216%22%20text-anchor%3D%22middle%22%20x%3D%22111.5%22%20y%3D%2216%22%3E%26%23x2212%3B%3C%2Ftext%3E%3Ctext%20font-family%3D%22Times%20New%20Roman%22%20font-size%3D%2218%22%20font-style%3D%22italic%22%20text-anchor%3D%22middle%22%20x%3D%22124.5%22%20y%3D%2216%22%3Ex%3C%2Ftext%3E%3C%2Fsvg%3E) in radians
in radiansformat('truetype')%3Bfont-weight%3Anormal%3Bfont-style%3Anormal%3B%7D%40font-face%7Bfont-family%3A'round_brackets18549f92a457f2409'%3Bsrc%3Aurl(data%3Afont%2Ftruetype%3Bcharset%3Dutf-8%3Bbase64%2CAAEAAAAMAIAAAwBAT1MvMjwHLFQAAADMAAAATmNtYXDf7xCrAAABHAAAADxjdnQgBAkDLgAAAVgAAAASZ2x5ZmAOz2cAAAFsAAABJGhlYWQOKih8AAACkAAAADZoaGVhCvgVwgAAAsgAAAAkaG10eCA6AAIAAALsAAAADGxvY2EAAARLAAAC%2BAAAABBtYXhwBIgEWQAAAwgAAAAgbmFtZXHR30MAAAMoAAACOXBvc3QDogHPAAAFZAAAACBwcmVwupWEAAAABYQAAAAHAAAGcgGQAAUAAAgACAAAAAAACAAIAAAAAAAAAQIAAAAAAAAAAAAAAAAAAAAAAAAAAAAAAAAAAAAAACAgICAAAAAo8AMGe%2F57AAAHPgGyAAAAAAACAAEAAQAAABQAAwABAAAAFAAEACgAAAAGAAQAAQACACgAKf%2F%2FAAAAKAAp%2F%2F%2F%2F2f%2FZAAEAAAAAAAAAAAFUAFYBAAAsAKgDgAAyAAcAAAACAAAAKgDVA1UAAwAHAAA1MxEjEyMRM9XVq4CAKgMr%2FQAC1QABAAD%2B0AIgBtAACQBNGAGwChCwA9SwAxCwAtSwChCwBdSwBRCwANSwAxCwBzywAhCwCDwAsAoQsAPUsAMQsAfUsAoQsAXUsAoQsADUsAMQsAI8sAcQsAg8MTAREAEzABEQASMAAZCQ%2FnABkJD%2BcALQ%2FZD%2BcAGQAnACcAGQ%2FnAAAQAA%2FtACIAbQAAkATRgBsAoQsAPUsAMQsALUsAoQsAXUsAUQsADUsAMQsAc8sAIQsAg8ALAKELAD1LADELAH1LAKELAF1LAKELAA1LADELACPLAHELAIPDEwARABIwAREAEzAAIg%2FnCQAZD%2BcJABkALQ%2FZD%2BcAGQAnACcAGQ%2FnAAAQAAAAEAAPW2NYFfDzz1AAMIAP%2F%2F%2F%2F%2FVre7u%2F%2F%2F%2F%2F9Wt7u4AAP7QA7cG0AAAAAoAAgABAAAAAAABAAAHPv5OAAAXcAAA%2F%2F4DtwABAAAAAAAAAAAAAAAAAAAAAwDVAAACIAAAAiAAAAAAAAAAAAAkAAAAowAAASQAAQAAAAMACgACAAAAAAACAIAEAAAAAAAEAABNAAAAAAAAABUBAgAAAAAAAAABAD4AAAAAAAAAAAACAA4APgAAAAAAAAADAFwATAAAAAAAAAAEAD4AqAAAAAAAAAAFABYA5gAAAAAAAAAGAB8A%2FAAAAAAAAAAIABwBGwABAAAAAAABAD4AAAABAAAAAAACAA4APgABAAAAAAADAFwATAABAAAAAAAEAD4AqAABAAAAAAAFABYA5gABAAAAAAAGAB8A%2FAABAAAAAAAIABwBGwADAAEECQABAD4AAAADAAEECQACAA4APgADAAEECQADAFwATAADAAEECQAEAD4AqAADAAEECQAFABYA5gADAAEECQAGAB8A%2FAADAAEECQAIABwBGwBSAG8AdQBuAGQAIABiAHIAYQBjAGsAZQB0AHMAIAB3AGkAdABoACAAYQBzAGMAZQBuAHQAIAAxADgANQA0AFIAZQBnAHUAbABhAHIATQBhAHQAaABzACAARgBvAHIAIABNAG8AcgBlACAAUgBvAHUAbgBkACAAYgByAGEAYwBrAGUAdABzACAAdwBpAHQAaAAgAGEAcwBjAGUAbgB0ACAAMQA4ADUANABSAG8AdQBuAGQAIABiAHIAYQBjAGsAZQB0AHMAIAB3AGkAdABoACAAYQBzAGMAZQBuAHQAIAAxADgANQA0AFYAZQByAHMAaQBvAG4AIAAyAC4AMFJvdW5kX2JyYWNrZXRzX3dpdGhfYXNjZW50XzE4NTQATQBhAHQAaABzACAARgBvAHIAIABNAG8AcgBlAAAAAAMAAAAAAAADnwHPAAAAAAAAAAAAAAAAAAAAAAAAAAC5B%2F8AAY2FAA%3D%3D)format('truetype')%3Bfont-weight%3Anormal%3Bfont-style%3Anormal%3B%7D%3C%2Fstyle%3E%3C%2Fdefs%3E%3Ctext%20font-family%3D%22Times%20New%20Roman%22%20font-size%3D%2218%22%20text-anchor%3D%22middle%22%20x%3D%2211.5%22%20y%3D%2216%22%3Etan%3C%2Ftext%3E%3Ctext%20font-family%3D%22Times%20New%20Roman%22%20font-size%3D%2218%22%20font-style%3D%22italic%22%20text-anchor%3D%22middle%22%20x%3D%2226.5%22%20y%3D%2216%22%3Ex%3C%2Ftext%3E%3Ctext%20font-family%3D%22math1f3a478e3753805256692637772%22%20font-size%3D%2216%22%20text-anchor%3D%22middle%22%20x%3D%2240.5%22%20y%3D%2216%22%3E%3D%3C%2Ftext%3E%3Ctext%20font-family%3D%22Times%20New%20Roman%22%20font-size%3D%2218%22%20text-anchor%3D%22middle%22%20x%3D%2260.5%22%20y%3D%2216%22%3Etan%3C%2Ftext%3E%3Ctext%20font-family%3D%22round_brackets18549f92a457f2409%22%20font-size%3D%2218%22%20text-anchor%3D%22middle%22%20x%3D%2274.5%22%20y%3D%2216%22%3E(%3C%2Ftext%3E%3Ctext%20font-family%3D%22round_brackets18549f92a457f2409%22%20font-size%3D%2218%22%20text-anchor%3D%22middle%22%20x%3D%22150.5%22%20y%3D%2216%22%3E)%3C%2Ftext%3E%3Ctext%20font-family%3D%22Times%20New%20Roman%22%20font-size%3D%2218%22%20font-style%3D%22italic%22%20text-anchor%3D%22middle%22%20x%3D%2281.5%22%20y%3D%2216%22%3Ex%3C%2Ftext%3E%3Ctext%20font-family%3D%22math1f3a478e3753805256692637772%22%20font-size%3D%2216%22%20text-anchor%3D%22middle%22%20x%3D%2295.5%22%20y%3D%2216%22%3E%26%23xB1%3B%3C%2Ftext%3E%3Ctext%20font-family%3D%22Times%20New%20Roman%22%20font-size%3D%2218%22%20text-anchor%3D%22middle%22%20x%3D%22116.5%22%20y%3D%2216%22%3E180%3C%2Ftext%3E%3Ctext%20font-family%3D%22Times%20New%20Roman%22%20font-size%3D%2218%22%20font-style%3D%22italic%22%20text-anchor%3D%22middle%22%20x%3D%22134.5%22%20y%3D%2216%22%3Ek%3C%2Ftext%3E%3Ctext%20font-family%3D%22math1f3a478e3753805256692637772%22%20font-size%3D%2216%22%20text-anchor%3D%22middle%22%20x%3D%22144.5%22%20y%3D%2216%22%3E%26%23xB0%3B%3C%2Ftext%3E%3C%2Fsvg%3E) for
for format('truetype')%3Bfont-weight%3Anormal%3Bfont-style%3Anormal%3B%7D%3C%2Fstyle%3E%3C%2Fdefs%3E%3Ctext%20font-family%3D%22Times%20New%20Roman%22%20font-size%3D%2218%22%20font-style%3D%22italic%22%20text-anchor%3D%22middle%22%20x%3D%224.5%22%20y%3D%2216%22%3Ek%3C%2Ftext%3E%3Ctext%20font-family%3D%22math1eee4cec553550b4ee665470625%22%20font-size%3D%2216%22%20text-anchor%3D%22middle%22%20x%3D%2218.5%22%20y%3D%2216%22%3E%26%23x2208%3B%3C%2Ftext%3E%3Ctext%20font-family%3D%22math1eee4cec553550b4ee665470625%22%20font-size%3D%2216%22%20text-anchor%3D%22middle%22%20x%3D%2232.5%22%20y%3D%2216%22%3E%26%23x2115%3B%3C%2Ftext%3E%3C%2Fsvg%3E)
format('truetype')%3Bfont-weight%3Anormal%3Bfont-style%3Anormal%3B%7D%40font-face%7Bfont-family%3A'round_brackets18549f92a457f2409'%3Bsrc%3Aurl(data%3Afont%2Ftruetype%3Bcharset%3Dutf-8%3Bbase64%2CAAEAAAAMAIAAAwBAT1MvMjwHLFQAAADMAAAATmNtYXDf7xCrAAABHAAAADxjdnQgBAkDLgAAAVgAAAASZ2x5ZmAOz2cAAAFsAAABJGhlYWQOKih8AAACkAAAADZoaGVhCvgVwgAAAsgAAAAkaG10eCA6AAIAAALsAAAADGxvY2EAAARLAAAC%2BAAAABBtYXhwBIgEWQAAAwgAAAAgbmFtZXHR30MAAAMoAAACOXBvc3QDogHPAAAFZAAAACBwcmVwupWEAAAABYQAAAAHAAAGcgGQAAUAAAgACAAAAAAACAAIAAAAAAAAAQIAAAAAAAAAAAAAAAAAAAAAAAAAAAAAAAAAAAAAACAgICAAAAAo8AMGe%2F57AAAHPgGyAAAAAAACAAEAAQAAABQAAwABAAAAFAAEACgAAAAGAAQAAQACACgAKf%2F%2FAAAAKAAp%2F%2F%2F%2F2f%2FZAAEAAAAAAAAAAAFUAFYBAAAsAKgDgAAyAAcAAAACAAAAKgDVA1UAAwAHAAA1MxEjEyMRM9XVq4CAKgMr%2FQAC1QABAAD%2B0AIgBtAACQBNGAGwChCwA9SwAxCwAtSwChCwBdSwBRCwANSwAxCwBzywAhCwCDwAsAoQsAPUsAMQsAfUsAoQsAXUsAoQsADUsAMQsAI8sAcQsAg8MTAREAEzABEQASMAAZCQ%2FnABkJD%2BcALQ%2FZD%2BcAGQAnACcAGQ%2FnAAAQAA%2FtACIAbQAAkATRgBsAoQsAPUsAMQsALUsAoQsAXUsAUQsADUsAMQsAc8sAIQsAg8ALAKELAD1LADELAH1LAKELAF1LAKELAA1LADELACPLAHELAIPDEwARABIwAREAEzAAIg%2FnCQAZD%2BcJABkALQ%2FZD%2BcAGQAnACcAGQ%2FnAAAQAAAAEAAPW2NYFfDzz1AAMIAP%2F%2F%2F%2F%2FVre7u%2F%2F%2F%2F%2F9Wt7u4AAP7QA7cG0AAAAAoAAgABAAAAAAABAAAHPv5OAAAXcAAA%2F%2F4DtwABAAAAAAAAAAAAAAAAAAAAAwDVAAACIAAAAiAAAAAAAAAAAAAkAAAAowAAASQAAQAAAAMACgACAAAAAAACAIAEAAAAAAAEAABNAAAAAAAAABUBAgAAAAAAAAABAD4AAAAAAAAAAAACAA4APgAAAAAAAAADAFwATAAAAAAAAAAEAD4AqAAAAAAAAAAFABYA5gAAAAAAAAAGAB8A%2FAAAAAAAAAAIABwBGwABAAAAAAABAD4AAAABAAAAAAACAA4APgABAAAAAAADAFwATAABAAAAAAAEAD4AqAABAAAAAAAFABYA5gABAAAAAAAGAB8A%2FAABAAAAAAAIABwBGwADAAEECQABAD4AAAADAAEECQACAA4APgADAAEECQADAFwATAADAAEECQAEAD4AqAADAAEECQAFABYA5gADAAEECQAGAB8A%2FAADAAEECQAIABwBGwBSAG8AdQBuAGQAIABiAHIAYQBjAGsAZQB0AHMAIAB3AGkAdABoACAAYQBzAGMAZQBuAHQAIAAxADgANQA0AFIAZQBnAHUAbABhAHIATQBhAHQAaABzACAARgBvAHIAIABNAG8AcgBlACAAUgBvAHUAbgBkACAAYgByAGEAYwBrAGUAdABzACAAdwBpAHQAaAAgAGEAcwBjAGUAbgB0ACAAMQA4ADUANABSAG8AdQBuAGQAIABiAHIAYQBjAGsAZQB0AHMAIAB3AGkAdABoACAAYQBzAGMAZQBuAHQAIAAxADgANQA0AFYAZQByAHMAaQBvAG4AIAAyAC4AMFJvdW5kX2JyYWNrZXRzX3dpdGhfYXNjZW50XzE4NTQATQBhAHQAaABzACAARgBvAHIAIABNAG8AcgBlAAAAAAMAAAAAAAADnwHPAAAAAAAAAAAAAAAAAAAAAAAAAAC5B%2F8AAY2FAA%3D%3D)format('truetype')%3Bfont-weight%3Anormal%3Bfont-style%3Anormal%3B%7D%3C%2Fstyle%3E%3C%2Fdefs%3E%3Ctext%20font-family%3D%22Times%20New%20Roman%22%20font-size%3D%2218%22%20text-anchor%3D%22middle%22%20x%3D%2211.5%22%20y%3D%2216%22%3Etan%3C%2Ftext%3E%3Ctext%20font-family%3D%22Times%20New%20Roman%22%20font-size%3D%2218%22%20font-style%3D%22italic%22%20text-anchor%3D%22middle%22%20x%3D%2226.5%22%20y%3D%2216%22%3Ex%3C%2Ftext%3E%3Ctext%20font-family%3D%22math13bdb91053c256b34874b3b0df9%22%20font-size%3D%2216%22%20text-anchor%3D%22middle%22%20x%3D%2240.5%22%20y%3D%2216%22%3E%3D%3C%2Ftext%3E%3Ctext%20font-family%3D%22Times%20New%20Roman%22%20font-size%3D%2218%22%20text-anchor%3D%22middle%22%20x%3D%2260.5%22%20y%3D%2216%22%3Etan%3C%2Ftext%3E%3Ctext%20font-family%3D%22round_brackets18549f92a457f2409%22%20font-size%3D%2218%22%20text-anchor%3D%22middle%22%20x%3D%2274.5%22%20y%3D%2216%22%3E(%3C%2Ftext%3E%3Ctext%20font-family%3D%22round_brackets18549f92a457f2409%22%20font-size%3D%2218%22%20text-anchor%3D%22middle%22%20x%3D%22127.5%22%20y%3D%2216%22%3E)%3C%2Ftext%3E%3Ctext%20font-family%3D%22Times%20New%20Roman%22%20font-size%3D%2218%22%20font-style%3D%22italic%22%20text-anchor%3D%22middle%22%20x%3D%2281.5%22%20y%3D%2216%22%3Ex%3C%2Ftext%3E%3Ctext%20font-family%3D%22math13bdb91053c256b34874b3b0df9%22%20font-size%3D%2216%22%20text-anchor%3D%22middle%22%20x%3D%2295.5%22%20y%3D%2216%22%3E%26%23xB1%3B%3C%2Ftext%3E%3Ctext%20font-family%3D%22Times%20New%20Roman%22%20font-size%3D%2218%22%20font-style%3D%22italic%22%20text-anchor%3D%22middle%22%20x%3D%22107.5%22%20y%3D%2216%22%3Ek%3C%2Ftext%3E%3Ctext%20font-family%3D%22math13bdb91053c256b34874b3b0df9%22%20font-size%3D%2216%22%20font-style%3D%22italic%22%20text-anchor%3D%22middle%22%20x%3D%22118.5%22%20y%3D%2216%22%3E%26%23x3C0%3B%3C%2Ftext%3E%3C%2Fsvg%3E) in radians
in radiansformat('truetype')%3Bfont-weight%3Anormal%3Bfont-style%3Anormal%3B%7D%40font-face%7Bfont-family%3A'round_brackets18549f92a457f2409'%3Bsrc%3Aurl(data%3Afont%2Ftruetype%3Bcharset%3Dutf-8%3Bbase64%2CAAEAAAAMAIAAAwBAT1MvMjwHLFQAAADMAAAATmNtYXDf7xCrAAABHAAAADxjdnQgBAkDLgAAAVgAAAASZ2x5ZmAOz2cAAAFsAAABJGhlYWQOKih8AAACkAAAADZoaGVhCvgVwgAAAsgAAAAkaG10eCA6AAIAAALsAAAADGxvY2EAAARLAAAC%2BAAAABBtYXhwBIgEWQAAAwgAAAAgbmFtZXHR30MAAAMoAAACOXBvc3QDogHPAAAFZAAAACBwcmVwupWEAAAABYQAAAAHAAAGcgGQAAUAAAgACAAAAAAACAAIAAAAAAAAAQIAAAAAAAAAAAAAAAAAAAAAAAAAAAAAAAAAAAAAACAgICAAAAAo8AMGe%2F57AAAHPgGyAAAAAAACAAEAAQAAABQAAwABAAAAFAAEACgAAAAGAAQAAQACACgAKf%2F%2FAAAAKAAp%2F%2F%2F%2F2f%2FZAAEAAAAAAAAAAAFUAFYBAAAsAKgDgAAyAAcAAAACAAAAKgDVA1UAAwAHAAA1MxEjEyMRM9XVq4CAKgMr%2FQAC1QABAAD%2B0AIgBtAACQBNGAGwChCwA9SwAxCwAtSwChCwBdSwBRCwANSwAxCwBzywAhCwCDwAsAoQsAPUsAMQsAfUsAoQsAXUsAoQsADUsAMQsAI8sAcQsAg8MTAREAEzABEQASMAAZCQ%2FnABkJD%2BcALQ%2FZD%2BcAGQAnACcAGQ%2FnAAAQAA%2FtACIAbQAAkATRgBsAoQsAPUsAMQsALUsAoQsAXUsAUQsADUsAMQsAc8sAIQsAg8ALAKELAD1LADELAH1LAKELAF1LAKELAA1LADELACPLAHELAIPDEwARABIwAREAEzAAIg%2FnCQAZD%2BcJABkALQ%2FZD%2BcAGQAnACcAGQ%2FnAAAQAAAAEAAPW2NYFfDzz1AAMIAP%2F%2F%2F%2F%2FVre7u%2F%2F%2F%2F%2F9Wt7u4AAP7QA7cG0AAAAAoAAgABAAAAAAABAAAHPv5OAAAXcAAA%2F%2F4DtwABAAAAAAAAAAAAAAAAAAAAAwDVAAACIAAAAiAAAAAAAAAAAAAkAAAAowAAASQAAQAAAAMACgACAAAAAAACAIAEAAAAAAAEAABNAAAAAAAAABUBAgAAAAAAAAABAD4AAAAAAAAAAAACAA4APgAAAAAAAAADAFwATAAAAAAAAAAEAD4AqAAAAAAAAAAFABYA5gAAAAAAAAAGAB8A%2FAAAAAAAAAAIABwBGwABAAAAAAABAD4AAAABAAAAAAACAA4APgABAAAAAAADAFwATAABAAAAAAAEAD4AqAABAAAAAAAFABYA5gABAAAAAAAGAB8A%2FAABAAAAAAAIABwBGwADAAEECQABAD4AAAADAAEECQACAA4APgADAAEECQADAFwATAADAAEECQAEAD4AqAADAAEECQAFABYA5gADAAEECQAGAB8A%2FAADAAEECQAIABwBGwBSAG8AdQBuAGQAIABiAHIAYQBjAGsAZQB0AHMAIAB3AGkAdABoACAAYQBzAGMAZQBuAHQAIAAxADgANQA0AFIAZQBnAHUAbABhAHIATQBhAHQAaABzACAARgBvAHIAIABNAG8AcgBlACAAUgBvAHUAbgBkACAAYgByAGEAYwBrAGUAdABzACAAdwBpAHQAaAAgAGEAcwBjAGUAbgB0ACAAMQA4ADUANABSAG8AdQBuAGQAIABiAHIAYQBjAGsAZQB0AHMAIAB3AGkAdABoACAAYQBzAGMAZQBuAHQAIAAxADgANQA0AFYAZQByAHMAaQBvAG4AIAAyAC4AMFJvdW5kX2JyYWNrZXRzX3dpdGhfYXNjZW50XzE4NTQATQBhAHQAaABzACAARgBvAHIAIABNAG8AcgBlAAAAAAMAAAAAAAADnwHPAAAAAAAAAAAAAAAAAAAAAAAAAAC5B%2F8AAY2FAA%3D%3D)format('truetype')%3Bfont-weight%3Anormal%3Bfont-style%3Anormal%3B%7D%3C%2Fstyle%3E%3C%2Fdefs%3E%3Ctext%20font-family%3D%22Times%20New%20Roman%22%20font-size%3D%2218%22%20text-anchor%3D%22middle%22%20x%3D%2210.5%22%20y%3D%2216%22%3Esin%3C%2Ftext%3E%3Ctext%20font-family%3D%22Times%20New%20Roman%22%20font-size%3D%2218%22%20font-style%3D%22italic%22%20text-anchor%3D%22middle%22%20x%3D%2225.5%22%20y%3D%2216%22%3Ex%3C%2Ftext%3E%3Ctext%20font-family%3D%22math1f3a478e3753805256692637772%22%20font-size%3D%2216%22%20text-anchor%3D%22middle%22%20x%3D%2239.5%22%20y%3D%2216%22%3E%3D%3C%2Ftext%3E%3Ctext%20font-family%3D%22Times%20New%20Roman%22%20font-size%3D%2218%22%20text-anchor%3D%22middle%22%20x%3D%2258.5%22%20y%3D%2216%22%3Esin%3C%2Ftext%3E%3Ctext%20font-family%3D%22round_brackets18549f92a457f2409%22%20font-size%3D%2218%22%20text-anchor%3D%22middle%22%20x%3D%2272.5%22%20y%3D%2216%22%3E(%3C%2Ftext%3E%3Ctext%20font-family%3D%22round_brackets18549f92a457f2409%22%20font-size%3D%2218%22%20text-anchor%3D%22middle%22%20x%3D%22148.5%22%20y%3D%2216%22%3E)%3C%2Ftext%3E%3Ctext%20font-family%3D%22Times%20New%20Roman%22%20font-size%3D%2218%22%20font-style%3D%22italic%22%20text-anchor%3D%22middle%22%20x%3D%2279.5%22%20y%3D%2216%22%3Ex%3C%2Ftext%3E%3Ctext%20font-family%3D%22math1f3a478e3753805256692637772%22%20font-size%3D%2216%22%20text-anchor%3D%22middle%22%20x%3D%2293.5%22%20y%3D%2216%22%3E%26%23xB1%3B%3C%2Ftext%3E%3Ctext%20font-family%3D%22Times%20New%20Roman%22%20font-size%3D%2218%22%20text-anchor%3D%22middle%22%20x%3D%22114.5%22%20y%3D%2216%22%3E360%3C%2Ftext%3E%3Ctext%20font-family%3D%22Times%20New%20Roman%22%20font-size%3D%2218%22%20font-style%3D%22italic%22%20text-anchor%3D%22middle%22%20x%3D%22132.5%22%20y%3D%2216%22%3Ek%3C%2Ftext%3E%3Ctext%20font-family%3D%22math1f3a478e3753805256692637772%22%20font-size%3D%2216%22%20text-anchor%3D%22middle%22%20x%3D%22142.5%22%20y%3D%2216%22%3E%26%23xB0%3B%3C%2Ftext%3E%3C%2Fsvg%3E) for
for format('truetype')%3Bfont-weight%3Anormal%3Bfont-style%3Anormal%3B%7D%40font-face%7Bfont-family%3A'round_brackets18549f92a457f2409'%3Bsrc%3Aurl(data%3Afont%2Ftruetype%3Bcharset%3Dutf-8%3Bbase64%2CAAEAAAAMAIAAAwBAT1MvMjwHLFQAAADMAAAATmNtYXDf7xCrAAABHAAAADxjdnQgBAkDLgAAAVgAAAASZ2x5ZmAOz2cAAAFsAAABJGhlYWQOKih8AAACkAAAADZoaGVhCvgVwgAAAsgAAAAkaG10eCA6AAIAAALsAAAADGxvY2EAAARLAAAC%2BAAAABBtYXhwBIgEWQAAAwgAAAAgbmFtZXHR30MAAAMoAAACOXBvc3QDogHPAAAFZAAAACBwcmVwupWEAAAABYQAAAAHAAAGcgGQAAUAAAgACAAAAAAACAAIAAAAAAAAAQIAAAAAAAAAAAAAAAAAAAAAAAAAAAAAAAAAAAAAACAgICAAAAAo8AMGe%2F57AAAHPgGyAAAAAAACAAEAAQAAABQAAwABAAAAFAAEACgAAAAGAAQAAQACACgAKf%2F%2FAAAAKAAp%2F%2F%2F%2F2f%2FZAAEAAAAAAAAAAAFUAFYBAAAsAKgDgAAyAAcAAAACAAAAKgDVA1UAAwAHAAA1MxEjEyMRM9XVq4CAKgMr%2FQAC1QABAAD%2B0AIgBtAACQBNGAGwChCwA9SwAxCwAtSwChCwBdSwBRCwANSwAxCwBzywAhCwCDwAsAoQsAPUsAMQsAfUsAoQsAXUsAoQsADUsAMQsAI8sAcQsAg8MTAREAEzABEQASMAAZCQ%2FnABkJD%2BcALQ%2FZD%2BcAGQAnACcAGQ%2FnAAAQAA%2FtACIAbQAAkATRgBsAoQsAPUsAMQsALUsAoQsAXUsAUQsADUsAMQsAc8sAIQsAg8ALAKELAD1LADELAH1LAKELAF1LAKELAA1LADELACPLAHELAIPDEwARABIwAREAEzAAIg%2FnCQAZD%2BcJABkALQ%2FZD%2BcAGQAnACcAGQ%2FnAAAQAAAAEAAPW2NYFfDzz1AAMIAP%2F%2F%2F%2F%2FVre7u%2F%2F%2F%2F%2F9Wt7u4AAP7QA7cG0AAAAAoAAgABAAAAAAABAAAHPv5OAAAXcAAA%2F%2F4DtwABAAAAAAAAAAAAAAAAAAAAAwDVAAACIAAAAiAAAAAAAAAAAAAkAAAAowAAASQAAQAAAAMACgACAAAAAAACAIAEAAAAAAAEAABNAAAAAAAAABUBAgAAAAAAAAABAD4AAAAAAAAAAAACAA4APgAAAAAAAAADAFwATAAAAAAAAAAEAD4AqAAAAAAAAAAFABYA5gAAAAAAAAAGAB8A%2FAAAAAAAAAAIABwBGwABAAAAAAABAD4AAAABAAAAAAACAA4APgABAAAAAAADAFwATAABAAAAAAAEAD4AqAABAAAAAAAFABYA5gABAAAAAAAGAB8A%2FAABAAAAAAAIABwBGwADAAEECQABAD4AAAADAAEECQACAA4APgADAAEECQADAFwATAADAAEECQAEAD4AqAADAAEECQAFABYA5gADAAEECQAGAB8A%2FAADAAEECQAIABwBGwBSAG8AdQBuAGQAIABiAHIAYQBjAGsAZQB0AHMAIAB3AGkAdABoACAAYQBzAGMAZQBuAHQAIAAxADgANQA0AFIAZQBnAHUAbABhAHIATQBhAHQAaABzACAARgBvAHIAIABNAG8AcgBlACAAUgBvAHUAbgBkACAAYgByAGEAYwBrAGUAdABzACAAdwBpAHQAaAAgAGEAcwBjAGUAbgB0ACAAMQA4ADUANABSAG8AdQBuAGQAIABiAHIAYQBjAGsAZQB0AHMAIAB3AGkAdABoACAAYQBzAGMAZQBuAHQAIAAxADgANQA0AFYAZQByAHMAaQBvAG4AIAAyAC4AMFJvdW5kX2JyYWNrZXRzX3dpdGhfYXNjZW50XzE4NTQATQBhAHQAaABzACAARgBvAHIAIABNAG8AcgBlAAAAAAMAAAAAAAADnwHPAAAAAAAAAAAAAAAAAAAAAAAAAAC5B%2F8AAY2FAA%3D%3D)format('truetype')%3Bfont-weight%3Anormal%3Bfont-style%3Anormal%3B%7D%3C%2Fstyle%3E%3C%2Fdefs%3E%3Ctext%20font-family%3D%22Times%20New%20Roman%22%20font-size%3D%2218%22%20text-anchor%3D%22middle%22%20x%3D%2210.5%22%20y%3D%2216%22%3Esin%3C%2Ftext%3E%3Ctext%20font-family%3D%22Times%20New%20Roman%22%20font-size%3D%2218%22%20font-style%3D%22italic%22%20text-anchor%3D%22middle%22%20x%3D%2225.5%22%20y%3D%2216%22%3Ex%3C%2Ftext%3E%3Ctext%20font-family%3D%22math1bf6e26fff1260b48e1f5420e22%22%20font-size%3D%2216%22%20text-anchor%3D%22middle%22%20x%3D%2239.5%22%20y%3D%2216%22%3E%3D%3C%2Ftext%3E%3Ctext%20font-family%3D%22Times%20New%20Roman%22%20font-size%3D%2218%22%20text-anchor%3D%22middle%22%20x%3D%2258.5%22%20y%3D%2216%22%3Esin%3C%2Ftext%3E%3Ctext%20font-family%3D%22round_brackets18549f92a457f2409%22%20font-size%3D%2218%22%20text-anchor%3D%22middle%22%20x%3D%2272.5%22%20y%3D%2216%22%3E(%3C%2Ftext%3E%3Ctext%20font-family%3D%22round_brackets18549f92a457f2409%22%20font-size%3D%2218%22%20text-anchor%3D%22middle%22%20x%3D%22135.5%22%20y%3D%2216%22%3E)%3C%2Ftext%3E%3Ctext%20font-family%3D%22Times%20New%20Roman%22%20font-size%3D%2218%22%20font-style%3D%22italic%22%20text-anchor%3D%22middle%22%20x%3D%2279.5%22%20y%3D%2216%22%3Ex%3C%2Ftext%3E%3Ctext%20font-family%3D%22math1bf6e26fff1260b48e1f5420e22%22%20font-size%3D%2216%22%20text-anchor%3D%22middle%22%20x%3D%2293.5%22%20y%3D%2216%22%3E%2B%3C%2Ftext%3E%3Ctext%20font-family%3D%22Times%20New%20Roman%22%20font-size%3D%2218%22%20text-anchor%3D%22middle%22%20x%3D%22106.5%22%20y%3D%2216%22%3E2%3C%2Ftext%3E%3Ctext%20font-family%3D%22Times%20New%20Roman%22%20font-size%3D%2218%22%20font-style%3D%22italic%22%20text-anchor%3D%22middle%22%20x%3D%22115.5%22%20y%3D%2216%22%3Ek%3C%2Ftext%3E%3Ctext%20font-family%3D%22math1bf6e26fff1260b48e1f5420e22%22%20font-size%3D%2216%22%20font-style%3D%22italic%22%20text-anchor%3D%22middle%22%20x%3D%22126.5%22%20y%3D%2216%22%3E%26%23x3C0%3B%3C%2Ftext%3E%3C%2Fsvg%3E) in radians
in radiansformat('truetype')%3Bfont-weight%3Anormal%3Bfont-style%3Anormal%3B%7D%40font-face%7Bfont-family%3A'round_brackets18549f92a457f2409'%3Bsrc%3Aurl(data%3Afont%2Ftruetype%3Bcharset%3Dutf-8%3Bbase64%2CAAEAAAAMAIAAAwBAT1MvMjwHLFQAAADMAAAATmNtYXDf7xCrAAABHAAAADxjdnQgBAkDLgAAAVgAAAASZ2x5ZmAOz2cAAAFsAAABJGhlYWQOKih8AAACkAAAADZoaGVhCvgVwgAAAsgAAAAkaG10eCA6AAIAAALsAAAADGxvY2EAAARLAAAC%2BAAAABBtYXhwBIgEWQAAAwgAAAAgbmFtZXHR30MAAAMoAAACOXBvc3QDogHPAAAFZAAAACBwcmVwupWEAAAABYQAAAAHAAAGcgGQAAUAAAgACAAAAAAACAAIAAAAAAAAAQIAAAAAAAAAAAAAAAAAAAAAAAAAAAAAAAAAAAAAACAgICAAAAAo8AMGe%2F57AAAHPgGyAAAAAAACAAEAAQAAABQAAwABAAAAFAAEACgAAAAGAAQAAQACACgAKf%2F%2FAAAAKAAp%2F%2F%2F%2F2f%2FZAAEAAAAAAAAAAAFUAFYBAAAsAKgDgAAyAAcAAAACAAAAKgDVA1UAAwAHAAA1MxEjEyMRM9XVq4CAKgMr%2FQAC1QABAAD%2B0AIgBtAACQBNGAGwChCwA9SwAxCwAtSwChCwBdSwBRCwANSwAxCwBzywAhCwCDwAsAoQsAPUsAMQsAfUsAoQsAXUsAoQsADUsAMQsAI8sAcQsAg8MTAREAEzABEQASMAAZCQ%2FnABkJD%2BcALQ%2FZD%2BcAGQAnACcAGQ%2FnAAAQAA%2FtACIAbQAAkATRgBsAoQsAPUsAMQsALUsAoQsAXUsAUQsADUsAMQsAc8sAIQsAg8ALAKELAD1LADELAH1LAKELAF1LAKELAA1LADELACPLAHELAIPDEwARABIwAREAEzAAIg%2FnCQAZD%2BcJABkALQ%2FZD%2BcAGQAnACcAGQ%2FnAAAQAAAAEAAPW2NYFfDzz1AAMIAP%2F%2F%2F%2F%2FVre7u%2F%2F%2F%2F%2F9Wt7u4AAP7QA7cG0AAAAAoAAgABAAAAAAABAAAHPv5OAAAXcAAA%2F%2F4DtwABAAAAAAAAAAAAAAAAAAAAAwDVAAACIAAAAiAAAAAAAAAAAAAkAAAAowAAASQAAQAAAAMACgACAAAAAAACAIAEAAAAAAAEAABNAAAAAAAAABUBAgAAAAAAAAABAD4AAAAAAAAAAAACAA4APgAAAAAAAAADAFwATAAAAAAAAAAEAD4AqAAAAAAAAAAFABYA5gAAAAAAAAAGAB8A%2FAAAAAAAAAAIABwBGwABAAAAAAABAD4AAAABAAAAAAACAA4APgABAAAAAAADAFwATAABAAAAAAAEAD4AqAABAAAAAAAFABYA5gABAAAAAAAGAB8A%2FAABAAAAAAAIABwBGwADAAEECQABAD4AAAADAAEECQACAA4APgADAAEECQADAFwATAADAAEECQAEAD4AqAADAAEECQAFABYA5gADAAEECQAGAB8A%2FAADAAEECQAIABwBGwBSAG8AdQBuAGQAIABiAHIAYQBjAGsAZQB0AHMAIAB3AGkAdABoACAAYQBzAGMAZQBuAHQAIAAxADgANQA0AFIAZQBnAHUAbABhAHIATQBhAHQAaABzACAARgBvAHIAIABNAG8AcgBlACAAUgBvAHUAbgBkACAAYgByAGEAYwBrAGUAdABzACAAdwBpAHQAaAAgAGEAcwBjAGUAbgB0ACAAMQA4ADUANABSAG8AdQBuAGQAIABiAHIAYQBjAGsAZQB0AHMAIAB3AGkAdABoACAAYQBzAGMAZQBuAHQAIAAxADgANQA0AFYAZQByAHMAaQBvAG4AIAAyAC4AMFJvdW5kX2JyYWNrZXRzX3dpdGhfYXNjZW50XzE4NTQATQBhAHQAaABzACAARgBvAHIAIABNAG8AcgBlAAAAAAMAAAAAAAADnwHPAAAAAAAAAAAAAAAAAAAAAAAAAAC5B%2F8AAY2FAA%3D%3D)format('truetype')%3Bfont-weight%3Anormal%3Bfont-style%3Anormal%3B%7D%3C%2Fstyle%3E%3C%2Fdefs%3E%3Ctext%20font-family%3D%22Times%20New%20Roman%22%20font-size%3D%2218%22%20text-anchor%3D%22middle%22%20x%3D%2212.5%22%20y%3D%2216%22%3Ecos%3C%2Ftext%3E%3Ctext%20font-family%3D%22Times%20New%20Roman%22%20font-size%3D%2218%22%20font-style%3D%22italic%22%20text-anchor%3D%22middle%22%20x%3D%2228.5%22%20y%3D%2216%22%3Ex%3C%2Ftext%3E%3Ctext%20font-family%3D%22math1f3a478e3753805256692637772%22%20font-size%3D%2216%22%20text-anchor%3D%22middle%22%20x%3D%2242.5%22%20y%3D%2216%22%3E%3D%3C%2Ftext%3E%3Ctext%20font-family%3D%22Times%20New%20Roman%22%20font-size%3D%2218%22%20text-anchor%3D%22middle%22%20x%3D%2263.5%22%20y%3D%2216%22%3Ecos%3C%2Ftext%3E%3Ctext%20font-family%3D%22round_brackets18549f92a457f2409%22%20font-size%3D%2218%22%20text-anchor%3D%22middle%22%20x%3D%2278.5%22%20y%3D%2216%22%3E(%3C%2Ftext%3E%3Ctext%20font-family%3D%22round_brackets18549f92a457f2409%22%20font-size%3D%2218%22%20text-anchor%3D%22middle%22%20x%3D%22154.5%22%20y%3D%2216%22%3E)%3C%2Ftext%3E%3Ctext%20font-family%3D%22Times%20New%20Roman%22%20font-size%3D%2218%22%20font-style%3D%22italic%22%20text-anchor%3D%22middle%22%20x%3D%2285.5%22%20y%3D%2216%22%3Ex%3C%2Ftext%3E%3Ctext%20font-family%3D%22math1f3a478e3753805256692637772%22%20font-size%3D%2216%22%20text-anchor%3D%22middle%22%20x%3D%2299.5%22%20y%3D%2216%22%3E%26%23xB1%3B%3C%2Ftext%3E%3Ctext%20font-family%3D%22Times%20New%20Roman%22%20font-size%3D%2218%22%20text-anchor%3D%22middle%22%20x%3D%22120.5%22%20y%3D%2216%22%3E360%3C%2Ftext%3E%3Ctext%20font-family%3D%22Times%20New%20Roman%22%20font-size%3D%2218%22%20font-style%3D%22italic%22%20text-anchor%3D%22middle%22%20x%3D%22138.5%22%20y%3D%2216%22%3Ek%3C%2Ftext%3E%3Ctext%20font-family%3D%22math1f3a478e3753805256692637772%22%20font-size%3D%2216%22%20text-anchor%3D%22middle%22%20x%3D%22148.5%22%20y%3D%2216%22%3E%26%23xB0%3B%3C%2Ftext%3E%3C%2Fsvg%3E) for
for format('truetype')%3Bfont-weight%3Anormal%3Bfont-style%3Anormal%3B%7D%40font-face%7Bfont-family%3A'round_brackets18549f92a457f2409'%3Bsrc%3Aurl(data%3Afont%2Ftruetype%3Bcharset%3Dutf-8%3Bbase64%2CAAEAAAAMAIAAAwBAT1MvMjwHLFQAAADMAAAATmNtYXDf7xCrAAABHAAAADxjdnQgBAkDLgAAAVgAAAASZ2x5ZmAOz2cAAAFsAAABJGhlYWQOKih8AAACkAAAADZoaGVhCvgVwgAAAsgAAAAkaG10eCA6AAIAAALsAAAADGxvY2EAAARLAAAC%2BAAAABBtYXhwBIgEWQAAAwgAAAAgbmFtZXHR30MAAAMoAAACOXBvc3QDogHPAAAFZAAAACBwcmVwupWEAAAABYQAAAAHAAAGcgGQAAUAAAgACAAAAAAACAAIAAAAAAAAAQIAAAAAAAAAAAAAAAAAAAAAAAAAAAAAAAAAAAAAACAgICAAAAAo8AMGe%2F57AAAHPgGyAAAAAAACAAEAAQAAABQAAwABAAAAFAAEACgAAAAGAAQAAQACACgAKf%2F%2FAAAAKAAp%2F%2F%2F%2F2f%2FZAAEAAAAAAAAAAAFUAFYBAAAsAKgDgAAyAAcAAAACAAAAKgDVA1UAAwAHAAA1MxEjEyMRM9XVq4CAKgMr%2FQAC1QABAAD%2B0AIgBtAACQBNGAGwChCwA9SwAxCwAtSwChCwBdSwBRCwANSwAxCwBzywAhCwCDwAsAoQsAPUsAMQsAfUsAoQsAXUsAoQsADUsAMQsAI8sAcQsAg8MTAREAEzABEQASMAAZCQ%2FnABkJD%2BcALQ%2FZD%2BcAGQAnACcAGQ%2FnAAAQAA%2FtACIAbQAAkATRgBsAoQsAPUsAMQsALUsAoQsAXUsAUQsADUsAMQsAc8sAIQsAg8ALAKELAD1LADELAH1LAKELAF1LAKELAA1LADELACPLAHELAIPDEwARABIwAREAEzAAIg%2FnCQAZD%2BcJABkALQ%2FZD%2BcAGQAnACcAGQ%2FnAAAQAAAAEAAPW2NYFfDzz1AAMIAP%2F%2F%2F%2F%2FVre7u%2F%2F%2F%2F%2F9Wt7u4AAP7QA7cG0AAAAAoAAgABAAAAAAABAAAHPv5OAAAXcAAA%2F%2F4DtwABAAAAAAAAAAAAAAAAAAAAAwDVAAACIAAAAiAAAAAAAAAAAAAkAAAAowAAASQAAQAAAAMACgACAAAAAAACAIAEAAAAAAAEAABNAAAAAAAAABUBAgAAAAAAAAABAD4AAAAAAAAAAAACAA4APgAAAAAAAAADAFwATAAAAAAAAAAEAD4AqAAAAAAAAAAFABYA5gAAAAAAAAAGAB8A%2FAAAAAAAAAAIABwBGwABAAAAAAABAD4AAAABAAAAAAACAA4APgABAAAAAAADAFwATAABAAAAAAAEAD4AqAABAAAAAAAFABYA5gABAAAAAAAGAB8A%2FAABAAAAAAAIABwBGwADAAEECQABAD4AAAADAAEECQACAA4APgADAAEECQADAFwATAADAAEECQAEAD4AqAADAAEECQAFABYA5gADAAEECQAGAB8A%2FAADAAEECQAIABwBGwBSAG8AdQBuAGQAIABiAHIAYQBjAGsAZQB0AHMAIAB3AGkAdABoACAAYQBzAGMAZQBuAHQAIAAxADgANQA0AFIAZQBnAHUAbABhAHIATQBhAHQAaABzACAARgBvAHIAIABNAG8AcgBlACAAUgBvAHUAbgBkACAAYgByAGEAYwBrAGUAdABzACAAdwBpAHQAaAAgAGEAcwBjAGUAbgB0ACAAMQA4ADUANABSAG8AdQBuAGQAIABiAHIAYQBjAGsAZQB0AHMAIAB3AGkAdABoACAAYQBzAGMAZQBuAHQAIAAxADgANQA0AFYAZQByAHMAaQBvAG4AIAAyAC4AMFJvdW5kX2JyYWNrZXRzX3dpdGhfYXNjZW50XzE4NTQATQBhAHQAaABzACAARgBvAHIAIABNAG8AcgBlAAAAAAMAAAAAAAADnwHPAAAAAAAAAAAAAAAAAAAAAAAAAAC5B%2F8AAY2FAA%3D%3D)format('truetype')%3Bfont-weight%3Anormal%3Bfont-style%3Anormal%3B%7D%3C%2Fstyle%3E%3C%2Fdefs%3E%3Ctext%20font-family%3D%22Times%20New%20Roman%22%20font-size%3D%2218%22%20text-anchor%3D%22middle%22%20x%3D%2212.5%22%20y%3D%2216%22%3Ecos%3C%2Ftext%3E%3Ctext%20font-family%3D%22Times%20New%20Roman%22%20font-size%3D%2218%22%20font-style%3D%22italic%22%20text-anchor%3D%22middle%22%20x%3D%2228.5%22%20y%3D%2216%22%3Ex%3C%2Ftext%3E%3Ctext%20font-family%3D%22math1bf6e26fff1260b48e1f5420e22%22%20font-size%3D%2216%22%20text-anchor%3D%22middle%22%20x%3D%2242.5%22%20y%3D%2216%22%3E%3D%3C%2Ftext%3E%3Ctext%20font-family%3D%22Times%20New%20Roman%22%20font-size%3D%2218%22%20text-anchor%3D%22middle%22%20x%3D%2263.5%22%20y%3D%2216%22%3Ecos%3C%2Ftext%3E%3Ctext%20font-family%3D%22round_brackets18549f92a457f2409%22%20font-size%3D%2218%22%20text-anchor%3D%22middle%22%20x%3D%2278.5%22%20y%3D%2216%22%3E(%3C%2Ftext%3E%3Ctext%20font-family%3D%22round_brackets18549f92a457f2409%22%20font-size%3D%2218%22%20text-anchor%3D%22middle%22%20x%3D%22141.5%22%20y%3D%2216%22%3E)%3C%2Ftext%3E%3Ctext%20font-family%3D%22Times%20New%20Roman%22%20font-size%3D%2218%22%20font-style%3D%22italic%22%20text-anchor%3D%22middle%22%20x%3D%2285.5%22%20y%3D%2216%22%3Ex%3C%2Ftext%3E%3Ctext%20font-family%3D%22math1bf6e26fff1260b48e1f5420e22%22%20font-size%3D%2216%22%20text-anchor%3D%22middle%22%20x%3D%2299.5%22%20y%3D%2216%22%3E%2B%3C%2Ftext%3E%3Ctext%20font-family%3D%22Times%20New%20Roman%22%20font-size%3D%2218%22%20text-anchor%3D%22middle%22%20x%3D%22112.5%22%20y%3D%2216%22%3E2%3C%2Ftext%3E%3Ctext%20font-family%3D%22Times%20New%20Roman%22%20font-size%3D%2218%22%20font-style%3D%22italic%22%20text-anchor%3D%22middle%22%20x%3D%22121.5%22%20y%3D%2216%22%3Ek%3C%2Ftext%3E%3Ctext%20font-family%3D%22math1bf6e26fff1260b48e1f5420e22%22%20font-size%3D%2216%22%20font-style%3D%22italic%22%20text-anchor%3D%22middle%22%20x%3D%22132.5%22%20y%3D%2216%22%3E%26%23x3C0%3B%3C%2Ftext%3E%3C%2Fsvg%3E) in radians
in radiansformat('truetype')%3Bfont-weight%3Anormal%3Bfont-style%3Anormal%3B%7D%3C%2Fstyle%3E%3C%2Fdefs%3E%3Ctext%20font-family%3D%22Times%20New%20Roman%22%20font-size%3D%2218%22%20text-anchor%3D%22middle%22%20x%3D%2212.5%22%20y%3D%2230%22%3Ecos%3C%2Ftext%3E%3Ctext%20font-family%3D%22Times%20New%20Roman%22%20font-size%3D%2218%22%20font-style%3D%22italic%22%20text-anchor%3D%22middle%22%20x%3D%2228.5%22%20y%3D%2230%22%3Ex%3C%2Ftext%3E%3Ctext%20font-family%3D%22math17f39f8317fbdb1988ef4c628eb%22%20font-size%3D%2216%22%20text-anchor%3D%22middle%22%20x%3D%2242.5%22%20y%3D%2230%22%3E%3D%3C%2Ftext%3E%3Cline%20stroke%3D%22%23000000%22%20stroke-linecap%3D%22square%22%20stroke-width%3D%221%22%20x1%3D%2253.5%22%20x2%3D%2265.5%22%20y1%3D%2223.5%22%20y2%3D%2223.5%22%2F%3E%3Ctext%20font-family%3D%22Times%20New%20Roman%22%20font-size%3D%2218%22%20text-anchor%3D%22middle%22%20x%3D%2259.5%22%20y%3D%2216%22%3E1%3C%2Ftext%3E%3Ctext%20font-family%3D%22Times%20New%20Roman%22%20font-size%3D%2218%22%20text-anchor%3D%22middle%22%20x%3D%2259.5%22%20y%3D%2241%22%3E2%3C%2Ftext%3E%3C%2Fsvg%3E) is
is format('truetype')%3Bfont-weight%3Anormal%3Bfont-style%3Anormal%3B%7D%3C%2Fstyle%3E%3C%2Fdefs%3E%3Ctext%20font-family%3D%22Times%20New%20Roman%22%20font-size%3D%2218%22%20font-style%3D%22italic%22%20text-anchor%3D%22middle%22%20x%3D%224.5%22%20y%3D%2216%22%3Ex%3C%2Ftext%3E%3Ctext%20font-family%3D%22math123919e9c7f188e0f3ae690e7e2%22%20font-size%3D%2216%22%20text-anchor%3D%22middle%22%20x%3D%2218.5%22%20y%3D%2216%22%3E%3D%3C%2Ftext%3E%3Ctext%20font-family%3D%22Times%20New%20Roman%22%20font-size%3D%2218%22%20text-anchor%3D%22middle%22%20x%3D%2236.5%22%20y%3D%2216%22%3E60%3C%2Ftext%3E%3Ctext%20font-family%3D%22math123919e9c7f188e0f3ae690e7e2%22%20font-size%3D%2216%22%20text-anchor%3D%22middle%22%20x%3D%2249.5%22%20y%3D%2216%22%3E%26%23xB0%3B%3C%2Ftext%3E%3C%2Fsvg%3E) . Find all the other solutions in the interval
. Find all the other solutions in the interval format('truetype')%3Bfont-weight%3Anormal%3Bfont-style%3Anormal%3B%7D%3C%2Fstyle%3E%3C%2Fdefs%3E%3Ctext%20font-family%3D%22math1758852a928fac3ea63bfdc71b0%22%20font-size%3D%2216%22%20text-anchor%3D%22middle%22%20x%3D%226.5%22%20y%3D%2216%22%3E%26%23x2212%3B%3C%2Ftext%3E%3Ctext%20font-family%3D%22Times%20New%20Roman%22%20font-size%3D%2218%22%20text-anchor%3D%22middle%22%20x%3D%2226.5%22%20y%3D%2216%22%3E360%3C%2Ftext%3E%3Ctext%20font-family%3D%22math1758852a928fac3ea63bfdc71b0%22%20font-size%3D%2216%22%20text-anchor%3D%22middle%22%20x%3D%2244.5%22%20y%3D%2216%22%3E%26%23xB0%3B%3C%2Ftext%3E%3Ctext%20font-family%3D%22math1758852a928fac3ea63bfdc71b0%22%20font-size%3D%2216%22%20text-anchor%3D%22middle%22%20x%3D%2256.5%22%20y%3D%2216%22%3E%26%23x2264%3B%3C%2Ftext%3E%3Ctext%20font-family%3D%22Times%20New%20Roman%22%20font-size%3D%2218%22%20font-style%3D%22italic%22%20text-anchor%3D%22middle%22%20x%3D%2268.5%22%20y%3D%2216%22%3Ex%3C%2Ftext%3E%3Ctext%20font-family%3D%22math1758852a928fac3ea63bfdc71b0%22%20font-size%3D%2216%22%20text-anchor%3D%22middle%22%20x%3D%2282.5%22%20y%3D%2216%22%3E%26%23x2264%3B%3C%2Ftext%3E%3Ctext%20font-family%3D%22Times%20New%20Roman%22%20font-size%3D%2218%22%20text-anchor%3D%22middle%22%20x%3D%22103.5%22%20y%3D%2216%22%3E360%3C%2Ftext%3E%3Ctext%20font-family%3D%22math1758852a928fac3ea63bfdc71b0%22%20font-size%3D%2216%22%20text-anchor%3D%22middle%22%20x%3D%22121.5%22%20y%3D%2216%22%3E%26%23xB0%3B%3C%2Ftext%3E%3C%2Fsvg%3E) .
.