Wage Determination (CIE IGCSE Economics)

Revision Note

Steve Vorster

Expertise

Economics & Business Subject Lead

Factors That Influence The Demand for Labour

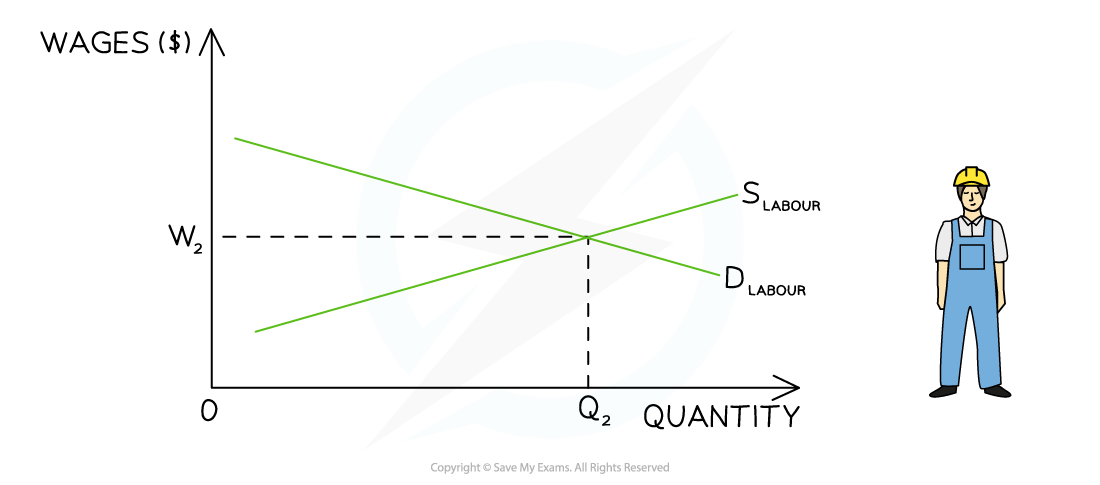
  • The labour market is composed of sellers of labour (households) & buyers of labour (firms)
    • Workers supply their labour & firms demand labour

  • The demand for labour is a derived demand
    • This means that it depends on the demand for goods/services
      • If demand for goods/services increases then the demand for labour will increase - and vice versa

Factors That Influence The Demand for Labour


The price of the product being produced


The demand for the final product

  • If the selling price of the product increases, then the firm will be incentivised to supply more & the firm's demand for labour will increase

  • As demand for labour is a derived demand, when an economy is booming then demand for most goods/services will be high - & the demand for labour will be high
  • Conversely, when an economy is in a recession demand for most goods/services will be lower - & the demand for labour will be lower

The ability to substitute capital (machinery) for labour


The productivity of labour

  • Firms will constantly evaluate if it will be possible & more cost effective to switch production from using labour to capital (machinery)
  • If it is more cost effective, then demand for labour will fall

  • If the productivity of labour increases (possibly through training) this will lower average costs & firms will likely demand more labour

Factors Influencing the Supply of Labour

  • There are numerous factors that influence the amount of labour supplied to a particular industry

Factors Influencing The Supply Of Labour


Training period


Wages in other occupations


Changes in migration policy


Long training periods (& their cost) act as a barrier to entry & exclude many households from offering labour in certain markets
 

Comparative wage rates in substitute labour markets strongly influence the supply of labour e.g. it is getting harder to recruit economics teachers as the private sector offers higher wages for their skills


Policies that increase the net migration rate  increase the supply of labour to certain industries e.g. in 2022, 36% of Singapore's labour force were migrants


Income tax levels


Working conditions


Trade union power


At a certain level, income taxes become a disincentive to households offering their labour. The assumption is that as income tax increases, labour supply decreases - and vice versa


The working conditions & non-wage benefits can act as strong incentive in certain industries e.g. tech companies are well known for their laid-back work environment & wide range of benefits e.g. on-site childcare & restaurants


Trade unions can increase the supply of labour to certain industries as workers consider the benefits of belonging to the union e.g higher wages & a safer working environment

Level of welfare benefits


Social trends


The higher the level of welfare benefits, the lower the incentive for low-skilled labour to offer their labour - and vice versa


Social trends include any major changes within society & can influence the supply of labour to certain industries e.g. work from home during Covid resulted in significant changes to the labour market & not all workers returned to work when economies opened up again


Diagrammatic Analysis of the Labour Market

  • The labour market is a type of factor market
      
  • Factor markets follow exactly the same rules as product markets
    • They are affected by changes to price, demand & supply
    • They are affected by the price elasticity of demand & supply. 
        
  • Labour market equilibrium occurs where the demand for labour (DL) is equal to the supply of labour (SL)
    • The DL is the demand by firms for workers - firms demand more labour as the wage rate decreases which results in a downward sloping demand curve
    • The SL is the supply of labour by workers - workers supply more labour as the wage rate increases which results in an upward sloping supply curve

  • Individual firms are price takers in the labour market as they have to accept the wage rate that workers are being paid in the industry
    • If they offer a lower wage, they will likely struggle to recruit workers
    • If they offer a higher wage there will be a large number of workers applying to work there

3-5-3--wage-equilibrium_edexcel-al-economics

In the labour market for graphic designers, the equilibrium wage rate is W and the equilibrium quantity is Q. At this point the DL = SL

Diagram Analysis

  • The market for graphic designers is in equilibrium where DL = S
  • The equilibrium wage is W and the quantity of labour is Q
  • There is no excess supply of labour
  • There is no excess demand for labour

Analysing the PED & PES of Labour

  Price Inelastic Demand & Supply

  • Consider the labour market for NBA basketball players
  • In 2022, LeBron James received a salary of $45m

3-3-2-wage-determination-inelastic

Wage determination in highly skilled markets is price inelastic in both supply & demand

   
Diagram Analysis

  • DL is the demand for labour from the basketball clubs
  • SL is the supply of labour by the basketball players
  • The demand for highly skilled players is very price inelastic
    • Clubs want the very best players, almost irrespective of what they cost
  • The supply of highly skilled players is also very price inelastic 
    • A significant increase in price will have little impact on the quantity of labour supplied in the market as it takes years to develop LeBron James type skills
  • The market equilibrium is found at W1Q- a high price & relatively low quantity


Price Elastic Demand & Supply
  

  • Consider the labour market for labourers on a building site
     

3-3-2-wage-determination-elastic

Wage determination in unskilled markets is price elastic in both supply & demand


Diagram Analysis

  • DL is the demand for labour from the building company for labourers
  • SL is the supply of labour by people willing to work on a building site
  • The demand for workers is very price elastic
    • If wages dropped a little, then firms would respond quickly by employing more workers
  • The supply of workers is also very price elastic 
    • Due to it being an unskilled job, there would quickly be an increase in the supply of labour if wages were to increase
  • The market equilibrium is found at W1Q- a low price & relatively high quantity

Relative Bargaining Power

  • Workers have different degrees of bargaining power when it comes to negotiating wage increases with their employers
  • The following factors influence their bargaining power
  1. Membership of a trade union: trade unions represent the interests of the workers in negotiations with employers & members frequently enjoy higher wages than non-union members
     
  2. Age & experience: young, inexperienced workers have less bargaining power then older, more experienced workers. As workers grow older their age often begins to count against them & this reduces bargaining power

  3. Level of education: education provides higher levels of skill & specialisation to a worker. This increases their bargaining power relative to unskilled workers

  4. Current supply conditions: the supply of labour in many industries can change due to socio-political conditions e.g prior to Brexit, workers in the hotel industry had very little bargaining power. Brexit created a shortage of labour willing to work in hotels & so the bargaining power of workers has increased, resulting in higher wages in the industry

Government Policy: Minimum Wages

  • Government's often intervene in the labour market by setting a minimum wage
    • They do this in order to improve equity & avoid the exploitation of worker
  • A minimum wage is a legally imposed wage level that employers must pay their workers
      • It is set above the market rate
      • The minimum wage/hour often varies based on age

3-5-3--minimum-wage_edexcel-al-economics

A national minimum wage (NMW1) is imposed above the market wage rate (We) at W1

Diagram Analysis

  • The market equilibrium wage & quantity for truck drivers in the UK is seen at WeQe
  • The government imposes a national minimum wage (NMW) at W1
  • Incentivised by higher wages, the supply of labour increases from Qe to Qs
  • Facing higher production costs, the demand for labour by firms decreases from Qe to Qd
  • This means that at a wage rate of W1 there is excess supply of labour & the potential for unemployment equal to QdQs

Exam Tip

When evaluating national minimum wages, do not assume that they will automatically increase unemployment.

Many studies have shown that unemployment does not increase - and in some instances employment increases. This is likely due to the fact that workers are receiving higher wages & choose to consume more. This increases total demand in the economy which in turn increases the demand for labour by firms - thus reducing/eliminating any potential unemployment.

You've read 0 of your 0 free revision notes

Get unlimited access

to absolutely everything:

  • Downloadable PDFs
  • Unlimited Revision Notes
  • Topic Questions
  • Past Papers
  • Model Answers
  • Videos (Maths and Science)

Join the 100,000+ Students that ❤️ Save My Exams

the (exam) results speak for themselves:

Did this page help you?

Steve Vorster

Author: Steve Vorster

Steve has taught A Level, GCSE, IGCSE Business and Economics - as well as IBDP Economics and Business Management. He is an IBDP Examiner and IGCSE textbook author. His students regularly achieve 90-100% in their final exams. Steve has been the Assistant Head of Sixth Form for a school in Devon, and Head of Economics at the world's largest International school in Singapore. He loves to create resources which speed up student learning and are easily accessible by all.