Estimating Braking Distances, Speeds & Accelerations (OCR Gateway GCSE Physics)

Revision Note

Test Yourself
Joanna

Author

Joanna

Expertise

Physics

Estimating Stopping Distances

  • For a given braking force, the speed of a vehicle determines the size of the stopping distance
  • The greater the speed of the vehicle, the larger the stopping distance
  • The image below shows how the stopping distance of a typical family car increases with increasing speed:

Highway Code, downloadable IGCSE & GCSE Physics revision notes

A vehicle's stopping distance increases with speed. At a speed of 20 mph the stopping distance is 12 m, whereas at 60 mph the stopping distance is 73 m (reproduced from the UK Highway Code)

Estimating stopping distance table, downloadable IGCSE & GCSE Physics revision notes

Velocity-Time Graphs for Stopping Distance

  • The velocity-time graph below shows how the velocity of a car will typically change during an emergency stop

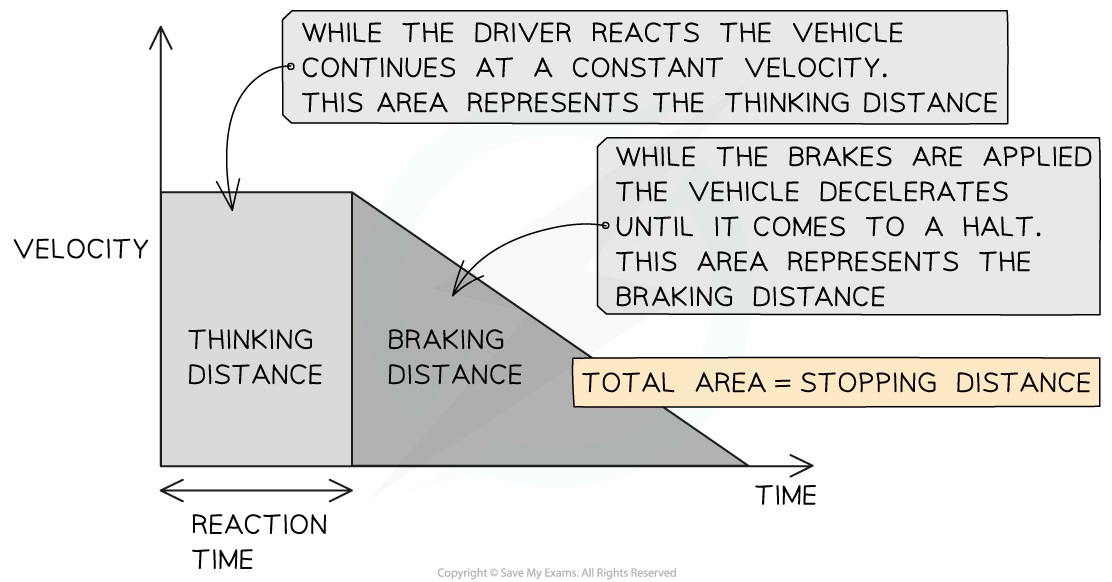
Graph showing how the velocity typically changes as a vehicle comes to an emergency stop

  • While the driver reacts (the time taken to press the brakes is called the reaction time), the vehicle continues moving at a constant velocity
    • The area underneath the graph during this time represents the thinking distance

  • As soon as the brakes are applied, the vehicle decelerates to a halt
    • The area underneath the graph during this time represents the braking distance

Worked example

While driving at a speed of 35 m/s, a driver sees an obstacle in the road at time t = 0. The velocity−time graph below shows how the speed of the car changes as the driver reacts and slams on the brakes, bringing the car to a halt.WE stopping distance question graph, downloadable IGCSE & GCSE Physics revision notesDetermine:

(a) The braking distance of the car

(b) The driver's reaction time

Part (a)

Step 1: Identify the section of the graph which represents the braking distance

    • The area under a velocity-time graph represents distance travelled
    • The braking distance of the car is the distance travelled under the braking force

    • This area of the graph is shaded below:

WE stopping distance solution graph a, downloadable IGCSE & GCSE Physics revision notes

The braking distance of the car is the area shaded because the car decelerates once the brakes are applied

Step 2: Calculate the area under the graph during the car's deceleration

    • The area is a triangle, so the braking distance is given by:

Braking distance = Area = ½ × base × height

Braking distance = ½ × (4.5 – 1) × 35 = 61.3 m

Part (b)

Step 1: Determine how long the driver takes before the brakes are applied

    • Between seeing the obstacle and applying the brakes, 1 second passes
    • This sequence of events is labelled on the graph below:

WE stopping distance solution graph b, downloadable IGCSE & GCSE Physics revision notes

The driver's reaction time is the time between the moment they see the obstacle to the moment the brakes are applied

    • Therefore, the driver's reaction time is 1 s

Exam Tip

The thinking and stopping distance definitions are often confused with each other. Remember that the thinking distance is to do with the driver whilst the stopping distance is to do with the vehicle and road conditions

Worked example

Estimating Braking Speeds & Accelerations

The graph below shows how the thinking distance of a driver depends on the speed of the car.WE Thinking distance question graph, downloadable IGCSE & GCSE Physics revision notes

(a) Describe the connection between thinking distance and speed.

(b) Some people drive when they are tired, despite warnings against doing so. Draw a new line on the graph to show how thinking distance varies with speed for a tired driver.

Part (a)

Step 1: Check if the line is straight and if it goes through the origin

    • The graph shows a straight line through the origin
    • Therefore, the thinking distance is directly proportional to the speed of the car

Part (b)

Step 1: Recall the factors which affect the thinking distance

    • Three additional factors affect the thinking distance, because they affect human reaction time:
      • Tiredness
      • Distractions
      • Intoxication

    • Hence, a tired driver's reaction time is greater (i.e. it takes longer for them to react)

Step 2: Draw a line that shows greater thinking distance for the same speed

    • At the same speed, a tired driver's thinking distance will be greater than a driver who is alert
    • This means a line should be drawn with a steeper gradient, as shown below:

WE Thinking distance solution graph, downloadable IGCSE & GCSE Physics revision notes

Part (b)

Step 1: Determine how long the driver takes before the brakes are applied

    • Between seeing the obstacle and applying the brakes, 1 second passes
    • This sequence of events is labelled on the graph below:

WE stopping distance solution graph b, downloadable IGCSE & GCSE Physics revision notes

The driver's reaction time is the time between the moment they see the obstacle to the moment the brakes are applied

    • Therefore, the driver's reaction time is 1 s

Worked example

A passenger travels in a car at a moderate speed. The vehicle is involved in a collision, which brings the car (and the passenger) to a halt in 0.1 seconds. Estimate:

a) The acceleration of the car (and the passenger)

b) The force on the passenger

Part (a)

Step 1: Estimate the required quantities and list the known quantities

A moderate speed for a car is about 50 mph or 20 m/s

    • Initial velocity ~ 20 m/s
    • Final velocity = 0 m/s
    • Time, t = 0.1 s

Step 2: Calculate the change in velocity of the car (and the passenger)

change in velocity = Δv = final velocity − initial velocity

Δv = 0 − 20

Δv = −20 m/s

Step 3: Calculate the acceleration of the car (and the passenger) using the equation:

Step 4: Calculate the deceleration

a = −20 ÷ 0.1

a ~ −200 m/s2

Part (b)

Step 1: Estimate the required quantities and list the known quantities

An adult person has a mass of about 70 kg

    • Mass of the passenger, m ~ 70 kg
    • Acceleration, a = −200 m/s2

Step 2: State Newton's second law 

    • This question involves quantities of force, mass and acceleration, so the equation for Newton's second law is:

F = ma

Step 3: Calculate an estimate for the decelerating force

F = 70 × −200

F ~ −14 000 N

Exam Tip

Remember that resultant force is a vector quantity. Examiners may ask you to comment on why its value is negative - this happens when the resultant force acts in the opposite direction to the object's motion.

In the worked example above, the resultant force opposes the passenger's motion, slowing them down (decelerating them) to a halt, this is why it has a minus symbol.

You've read 0 of your 0 free revision notes

Get unlimited access

to absolutely everything:

  • Downloadable PDFs
  • Unlimited Revision Notes
  • Topic Questions
  • Past Papers
  • Model Answers
  • Videos (Maths and Science)

Join the 100,000+ Students that ❤️ Save My Exams

the (exam) results speak for themselves:

Did this page help you?

Joanna

Author: Joanna

Joanna obtained her undergraduate degree in Natural Sciences from Cambridge University and completed her MSc in Education at Loughborough University. After a decade of teaching and leading the physics department in a high-performing academic school, Joanna now mentors new teachers and is currently studying part-time for her PhD at Leicester University. Her passions are helping students and learning about cool physics, so creating brilliant resources to help with exam preparation is her dream job!