
Resource Levelling
What is resource levelling?
- Typically a project will have involve time periods when a low number of workers is required and other time periods when a high number of workers is required
- Resource levelling is the process of analysing a project, then adjusting the start (and end) times of activities with the aim of keeping the number of workers required at any particular time either to a minimum or within a specified limit
- Activities from 'busier' times (lots of workers involved) are delayed to 'quieter' times (few workers involved)
- i.e. workers (resources) are spread more evenly ('levelled') throughout the project
- Activities from 'busier' times (lots of workers involved) are delayed to 'quieter' times (few workers involved)
What does resource levelling involve?
- Resource levelling requires consideration of
- activity dependencies
- precedence table or an activity network
- early and late event times and the critical activities
- activity network and/or Gantt chart
- the number of workers per activity
- precedence table or a resource histogram
- the minimum project duration
- also called the critical time of the project
- activity network or Gantt chart
- activity dependencies
What types of problem can be solved using resource levelling?
- The first type of problem requires minimising the number of workers needed at any particular time whilst maintaining the critical time of the project
- Questions may ask which activities are occurring at certain times throughout the project
- Phrases such as "on day 14" or "at time 8.5 hours" need to be interpreted carefully
- This will depend on whether the resource histogram time axis is treated as discrete or continuous
- The second type of problem requires adhering to a limit on the number of workers but minimising the delay to the project's critical time
- any delay to a critical activity would affect the project's critical time
- In both cases, an optimal solution is not necessarily required
- but the solution needs to meet the constraints (restrictions/limits) regarding the number of workers and/or project duration
How do I apply resource levelling to a project where the critical time cannot be delayed?
- Start by finding the time(s) with the highest number of workers
- a resource histogram would be the easiest way of seeing this
- remember that resource histograms - and Gantt charts - are initially drawn with activities starting at their early start time
- i.e. the early event time at the activity start node
- Look for a non-critical activity (i.e. those activities that have a (total) float) such that
- the start time can be delayed so that its end time will not surpass its late end time
- i.e the late event time at the activity end node
- This ensures there is no delay to the project's critical time
- a (completed) activity network is the easiest way to find early and late event times
- a Gantt chart is the easiest way to find a (total) float time
- Delaying the start of an activity may have a 'knock-on' effect to any other activities that are dependent on it
- check these activities can also have their start times delayed so that their end times do not surpass their late end times
- again, this ensures no delay to the project's critical time
- a precedence table or activity network are the easiest ways to determine activity dependencies
- the start time can be delayed so that its end time will not surpass its late end time
How do I apply resource levelling to a project where the critical time can be delayed?
- This is a similar process to above but as a delay is inevitable the critical activities could be delayed
- The aim would be to minimise the delay to the project's critical time
- Start by finding the time(s) with the highest number of workers
- Consider the non-critical activities first
- use the (total) floats as efficiently as possible so that late end time(s) are delayed by as little as possible
- this means any dependent activities early start time(s) are delayed as little as possible
- one-way to do this is to think about how activities can 'slide' back and forth on a Gantt chart
- use the (total) floats as efficiently as possible so that late end time(s) are delayed by as little as possible
- If a critical activity needs to be delayed
- consider any non-critical activities that are dependent on critical activities
- they may become delayed too
- Note that in problems where one or more of the critical activities are delayed
- the project minimum duration (critical time) will change
- and so (some of) the critical path and (some of) the critical activities will change
- consider any non-critical activities that are dependent on critical activities
What is the lower bound for the (minimum) number of workers?
- In some cases, each activity will only require one worker (or one team of workers)
- If so the lower bound for the number of workers needed such that a project is completed in its minimum project duration can be calculated
- It is found by finding the smallest integer that satisfies
format('truetype')%3Bfont-weight%3Anormal%3Bfont-style%3Anormal%3B%7D%3C%2Fstyle%3E%3C%2Fdefs%3E%3Ctext%20font-family%3D%22Times%20New%20Roman%22%20font-size%3D%2218%22%20text-anchor%3D%22middle%22%20x%3D%2223.5%22%20y%3D%2230%22%3ELower%3C%2Ftext%3E%3Ctext%20font-family%3D%22Times%20New%20Roman%22%20font-size%3D%2218%22%20text-anchor%3D%22middle%22%20x%3D%2273.5%22%20y%3D%2230%22%3Ebound%3C%2Ftext%3E%3Ctext%20font-family%3D%22math1070c425fd005e11aec1a90706d%22%20font-size%3D%2216%22%20text-anchor%3D%22middle%22%20x%3D%22108.5%22%20y%3D%2230%22%3E%26%23x2265%3B%3C%2Ftext%3E%3Cline%20stroke%3D%22%23000000%22%20stroke-linecap%3D%22square%22%20stroke-width%3D%221%22%20x1%3D%22122.5%22%20x2%3D%22315.5%22%20y1%3D%2223.5%22%20y2%3D%2223.5%22%2F%3E%3Ctext%20font-family%3D%22Times%20New%20Roman%22%20font-size%3D%2218%22%20text-anchor%3D%22middle%22%20x%3D%22146.5%22%20y%3D%2216%22%3ETotal%3C%2Ftext%3E%3Ctext%20font-family%3D%22Times%20New%20Roman%22%20font-size%3D%2218%22%20text-anchor%3D%22middle%22%20x%3D%22185.5%22%20y%3D%2216%22%3Etime%3C%2Ftext%3E%3Ctext%20font-family%3D%22Times%20New%20Roman%22%20font-size%3D%2218%22%20text-anchor%3D%22middle%22%20x%3D%22212.5%22%20y%3D%2216%22%3Eof%3C%2Ftext%3E%3Ctext%20font-family%3D%22Times%20New%20Roman%22%20font-size%3D%2218%22%20text-anchor%3D%22middle%22%20x%3D%22233.5%22%20y%3D%2216%22%3Eall%3C%2Ftext%3E%3Ctext%20font-family%3D%22Times%20New%20Roman%22%20font-size%3D%2218%22%20text-anchor%3D%22middle%22%20x%3D%22278.5%22%20y%3D%2216%22%3Eactivities%3C%2Ftext%3E%3Ctext%20font-family%3D%22Times%20New%20Roman%22%20font-size%3D%2218%22%20text-anchor%3D%22middle%22%20x%3D%22160.5%22%20y%3D%2241%22%3EMinimum%3C%2Ftext%3E%3Ctext%20font-family%3D%22Times%20New%20Roman%22%20font-size%3D%2218%22%20text-anchor%3D%22middle%22%20x%3D%22225.5%22%20y%3D%2241%22%3Eproject%3C%2Ftext%3E%3Ctext%20font-family%3D%22Times%20New%20Roman%22%20font-size%3D%2218%22%20text-anchor%3D%22middle%22%20x%3D%22284.5%22%20y%3D%2241%22%3Eduration%3C%2Ftext%3E%3C%2Fsvg%3E)
Exam Tip
- Exam questions may not use phrases such as resource levelling, critical time, etc
- Practice problems to get a variety of experience of different contexts and phrasing
Worked example
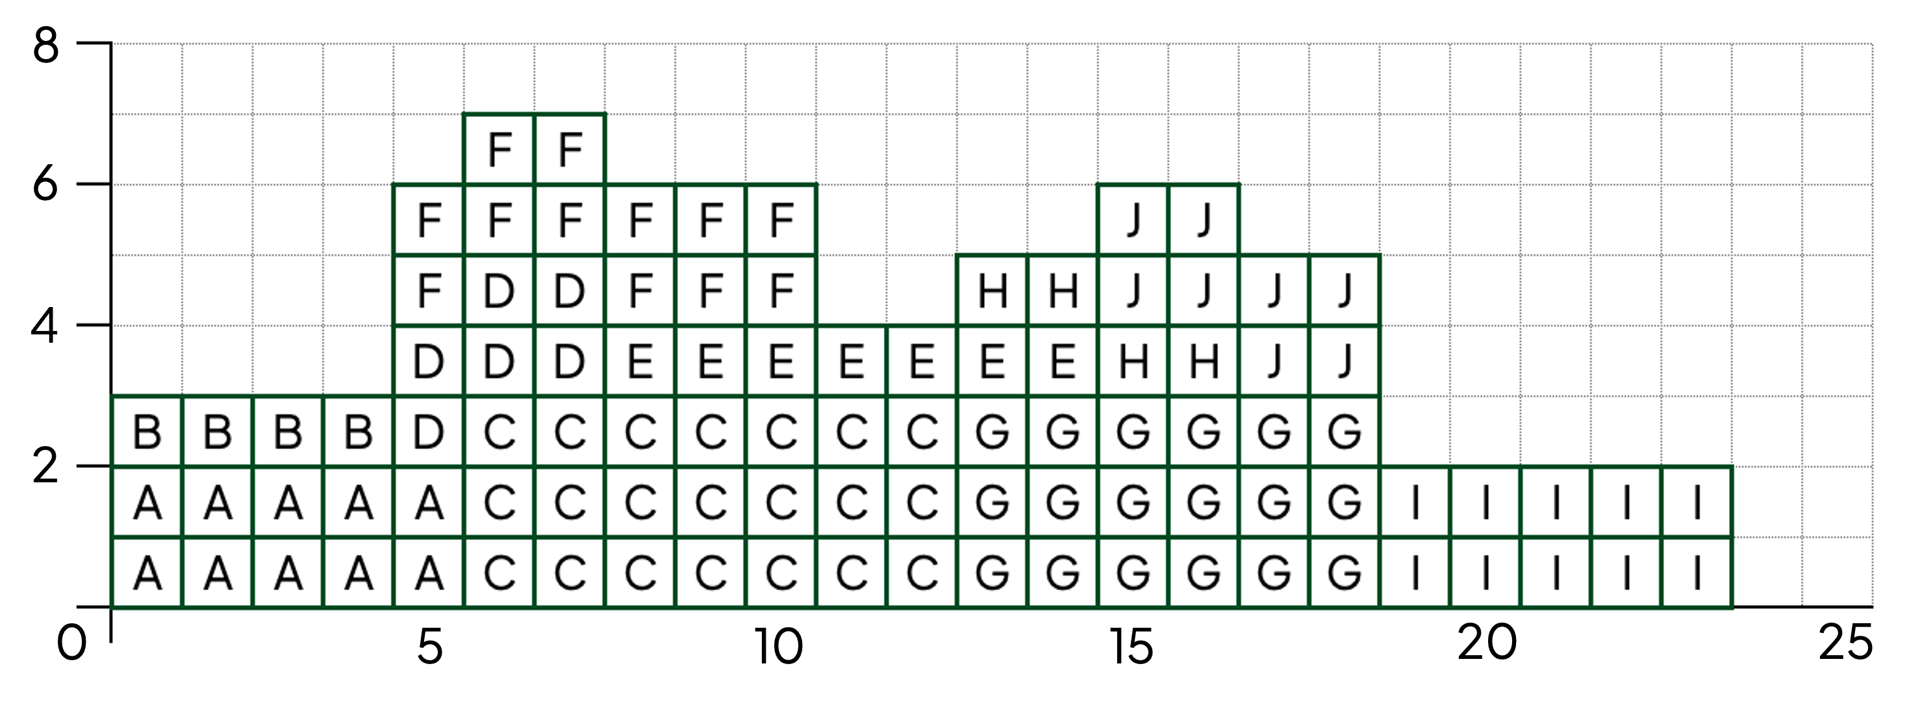
The precedence table, Gantt chart and resource histogram for a project are shown below.
Both the Gantt chart and the resource histogram show activities starting at their earliest event times.
Activity durations are given in days.
| Activity | Immediately preceding activities |
| A | - |
| B | - |
| C | A |
| D | B |
| E | A, D |
| F | B |
| G | C |
| H | C |
| I | G, H |
| J | E, F |

a)
Use the diagrams to write down
i)
the critical activities,
ii)
the number of workers for each activity.
i)
The critical activities are shown back-to-back in a single line on the Gantt chart
A, C, G, I
ii)
The number of workers can be determined by the height of each activity on the resource histogram
A:2, B:1, C:3, D:2, E:1, F:2, G:3, H:1, I:2, J:2
b)
Draw a new resource histogram to show that the project can be completed in 23 days without using more than six workers on any day.
The project is still to be completed in 23 days so the critical activities (A, C, G, I) cannot be delayed
The resource histogram shows that 7 workers are required on days 6 and 7 so consider the non-critical activities D and F on these days
Activity D has a total float of 5 days (late end time 12) and F has a total float of 9 days (late end time 19)
Delay F by three days
The resource histogram shows that delaying F by three days will mean that, without other changes, 7 workers would still be needed on day 13, but activity H has a (total) float of 2
Delay H by one day
Delaying Activity H by one day - note how activity H does not depend on F but was still affected by delaying F - this is because we are concerned with the number of workers
The adjusted resource histogram is

c)
Show, by means of a further resource histogram, that the project can be completed in 24 days with a maximum of five workers.
Using the solution to part b) (and the precedence table) we can see that activity J can be delayed and occur at the same time as activity I (with 4 workers)
Activity H only requires one worker so can also occur at the same time as I and J with 5 workers in total

To reduce the maximum number of workers from 6 to 5, activities C, E, F and G, E, F cannot happen simultaneously
Delaying activity F to start (immediately) after E will delay the project by one day
(6 days would be needed between E and J; J is dependent on F and there is currently only a 5 day gap)
(6 days would be needed between E and J; J is dependent on F and there is currently only a 5 day gap)
The adjusted resource histogram, showing how five workers can complete the project in 24 days is

