Production Possibility Curves (CIE IGCSE Economics)

Topic Questions

11 mark

Using all available resources an economy produces different combinations of two types of good, clothes and food, shown on the production possibility curve (PPC) diagram.

screen-shot-2023-07-31-at-10-13-52-am

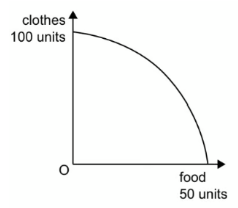
What does the PPC indicate?

  • It is more efficient to produce more of clothes than food.

  • It is only possible to increase the output of clothes by reducing the output of food.

  • The best situation is to produce equal units of clothes and food.

  • The cost of producing a unit of clothes is always higher than the cost of producing a unit of food.

Did this page help you?

21 mark

The diagram shows the production possibility curve (PPC) of an economy producing at point X.

646401-nov-2020-qp-13-fig-3

What would be the opportunity cost of moving from point X to produce only consumer goods?

  • 60 units of consumer goods

  • 70 units of capital goods

  • 100 units of capital goods

  • 180 units of consumer goods

Did this page help you?

31 mark

The diagram shows a production possibility curve (PPC).

june-2019-v1qp-p1-cie-eco-q2

Why is the curve usually drawn like this?

  • International free trade exists.

  • Opportunity cost changes.

  • Resources are unlimited in supply.

  • Some resources will be unemployed.

Did this page help you?

41 mark

A production possibility curve shows all of the following except?

  • The opportunity cost of producing two goods

  • The level of government control

  • The potential output of an economy using all available resources

  • The level of efficiency in the economy

Did this page help you?

51 mark

The diagram shows a production possibility curve (PPC).

june-2019-v1qp-p1-cie-eco-q2

What would cause the curve to shift inwards?

  • A natural disaster such as an earthquake

  • More resources are discovered within the country

  • The workers in the country gain new skills and become more productive

  • New technology increases the efficient use of resources

Did this page help you?

11 mark

What would cause an outward shift of a country’s production possibility curve (PPC)?

  • a fall in unemployment

  • an increase in the rate of income tax

  • an increase in the labour force

  • a reduction in expenditure on education

Did this page help you?

21 mark

The diagram shows a production possibility curve (PPC) for a country. The country moved from position X to position Y on the PPC.

qp-521311-nov-2020-question-paper-12-q3
What is the most likely reason for this change?

  • Firms have decided to increase investment in technology.

  • New economic resources have been discovered in the country.

  • The government has brought about an increase in living standards.

  • The government has encouraged long-term economic growth.

Did this page help you?

31 mark

The diagram shows two production possibility curves.
nov-2019v2qp-p1-cie-eco-q2
Which statement about the movement from point X to point Y is correct?

  • Demand for consumer goods has risen.

  • The opportunity cost for producing consumer goods has risen.

  • There has been an increase in productivity in consumer goods production.

  • There has been an inward shift in the production possibility curve.

Did this page help you?

41 mark

The diagram shows a production possibility curve (PPC) for an economy that produces both capital goods and consumer goods.
At which point will the economy show the highest potential for sustained long run economic growth?

qp-june-2019v2-paper-1-cie-economics-igcse-q2

Did this page help you?

11 mark

Countries X and Y have identical resources. The diagram shows their production possibility curves.

nov-2019-v1qp-p1-cie-eco-q2

What can be concluded from the diagram?

  • X can produce food and drink more cheaply than Y.

  • X experiences higher unemployment than Y.

  • Y can produce food and drink more efficiently than X.

  • Y has higher retail prices than X.

Did this page help you?

21 mark

The diagram shows the production possibility curve (PPC) of a country producing at point T.

qp-0455-m20qp-12-q2

The country has an ageing population and decides to allocate more resources to the production of health services.
Which movement shows this change in resource allocation?

  • T to S

  • T to U

  • T to V

  • T to W

Did this page help you?

31 mark

The diagram shows the production possibility curve (PPC) for an economy.

nov-2018-v1qp-p1-cie-eco-q3

What will happen to the opportunity cost of producing more units of consumer goods in terms of capital goods as the economy moves down its PPC from point X to point Z?

  • It will decrease continuously from point X to point Z.

  • It will decrease up to point Y and then increase towards point Z.

  • It will increase continuously from point X to point Z.

  • It will increase up to point Y and then decrease towards point Z.

Did this page help you?

41 mark

The diagram shows a country’s production possibility curve (PPC).

nov-2018-v2qp-p1-cie-eco-q3

Which statement is correct?

  • A movement from X to Y shows a decrease in efficiency in the economy.

  • A movement from X to Z shows a discovery of new resources in the economy.

  • A movement from Y to Z shows resources are being diverted from capital goods to consumer goods.

  • A movement from Z to Y shows an increase in efficiency in the economy.

Did this page help you?

51 mark

Country X provides computers to help teachers in the classroom.

How would this technology increase the economic potential of country X?

  • It improves the quality of human resources.

  • It reduces the amount of land required for education.

  • It removes the need for teachers.

  • It requires more teachers to do the same work.

Did this page help you?