Pearson's Product Moment Correlation Coefficient (PMCC) (Edexcel GCSE Statistics)
Revision Note

Author
RogerExpertise
Maths
Pearson's PMCC
What is Pearson’s product moment correlation coefficient (PMCC)?
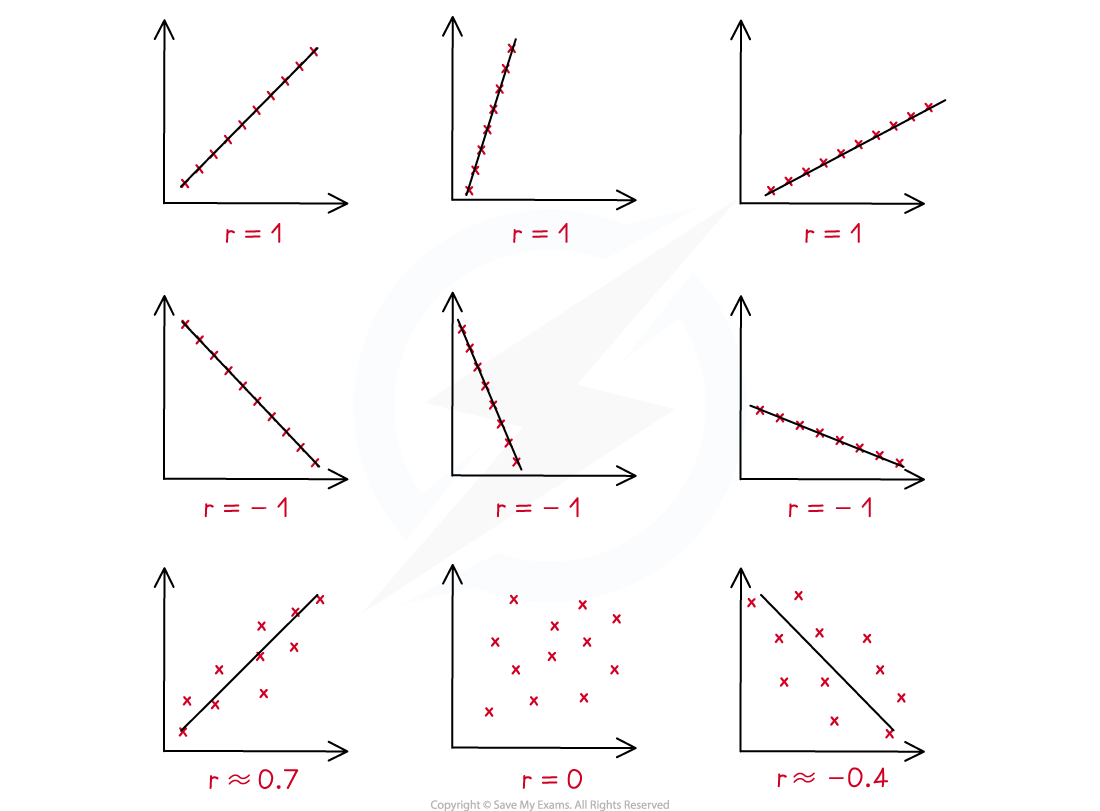
Pearson’s product moment correlation coefficient (PMCC) measures the strength of the linear correlation between two data sets
i.e., to what extent does one always go up when the other one goes up (or always go down when the other one goes up)
AND to what extent a scatter diagram of the data points lie along a straight line
This is what it means for the correlation to be linear
The line in question is the linear regression line for the data points
The notation for the Pearson’s product moment correlation coefficient of a sample is usually
Pearson's PMCC is always a number between -1 and 1
i.e.
This is the same as for Spearman's rank correlation coefficient
The value of
tells you about the type and strength of any correlation
A positive value (
) means there is positive correlation between the data sets
An
value close to 1 means strong linear positive correlation
If
, there is perfect linear positive correlation
i.e., the points lie exactly along a straight line that slopes 'up to the right' (positive gradient)
If
is zero (
), then there is no linear correlation
A negative value (
) means there is negative correlation between the data sets
An
value close to -1 means strong linear negative correlation
If
, there is perfect linear negative correlation
i.e., the points lie exactly along a straight line that slopes 'down to the right' (negative gradient)
In general, the closer to 1 or -1 that
is, the stronger the linear correlation between the data sets

Note that you will not be asked to calculate a Pearson's PMCC value on the exam
However you need to be able to interpret any values that are given
Spearman's Versus Pearson's Correlation Coefficients
What is the difference between Pearson's PMCC and Spearman's rank correlation coefficient?
Pearson’s PMCC (
) tests for a linear relationship between two data sets
i.e. how close the data points are to lying along a straight line
It is most suitable for data that shows linear correlation
Spearman’s rank correlation coefficient (
) tests for an 'always increasing' or 'always decreasing' relationship between two data sets
It will not tell whether a line or some other curve best fits the data
It is most suitable for data that shows non-linear correlation
How are Pearson’s and Spearman’s correlation coefficients connected?
If there is strong linear correlation then there is also strong correlation in general
If
is close (or equal) to 1 then
will also be close (or equal) to 1
If
is close (or equal) to -1 then
will also be close (or equal) to -1
However the opposite is not true
It is possible for
to be equal to 1 (or -1) but for
to be different
For example data that lies along an increasing curve
as the points are always increasing
as the points do not lie on a straight line
Pearson's and Spearman's correlation coefficients will both be positive if the data has positive correlation (and will both be negative if the data has negative correlation)
However, if the data points do not lie close to a straight line then the Spearman's coefficient
will be closer to 1 (or -1) than the Pearson's coefficient
Exam Tip
Be sure to know the differences between Spearman's rank correlation coefficient and Pearson's PMCC
Exam questions will often include a part based on this difference
Worked Example
Branko has collected data on a number of investments made by different people. In each case he recorded the time in years the investment was held for, and the value of £100 of the original investment at the end of that time.
He used statistical software to produce the following scatter diagram of his data.

Branko also used the statistical software to calculate two correlation coefficients: Spearman’s rank correlation coefficient and Pearson’s product moment correlation coefficient.
(a) Select one value from each row below to show the most likely pair of correlation coefficients for this data.
Spearman’s rank
correlation coefficient: −0.9 −0.7 0 0.7 0.9
Pearson’s product moment
correlation coefficient: −0.9 −0.7 0 0.7 0.9
For the most part, value goes up as length of time increases
This means positive correlation, so both coefficients should be positive
However the data points are not very close to lying on a straight line
So there is not very strong linear correlation
That means the Pearson's coefficient will not be as close to 1 as the Spearman's coefficient
Spearman's rank correlation coefficient: 0.9
Pearson's product moment correlation coefficient: 0.7
(b) Explain your choice of answers in part (a).
The scatter diagram shows positive correlation, so both coefficients should be positive. But the scatter diagram points are not close to being on a straight line, so Spearman's coefficient should be closer to 1 than Pearson's coefficient.

You've read 0 of your 0 free revision notes
Get unlimited access
to absolutely everything:
- Downloadable PDFs
- Unlimited Revision Notes
- Topic Questions
- Past Papers
- Model Answers
- Videos (Maths and Science)
Did this page help you?