Development (OCR GCSE Geography)

Topic Questions

1a1 mark

Dynamic Development

Study the data table below which shows measures of development for four African countries.

Country GNI per capita ($) Literacy Rate % Life Expectancy (Years) Infant Mortality
Rate (per 1,000)
Cameroon 3,070 75.0 58.5 52.2
Chad 2,110 40.2 50.2 87.0
Gabon 18,880 83.2 52.1 45.1
Niger  950 19.1 55.5 82.8

Which country has the lowest life expectancy?

1b1 mark

Study the data table below which shows measures of development for four African countries.

Country GNI per capita ($) Literacy Rate % Life Expectancy (Years) Infant Mortality
Rate (per 1,000)
Cameroon 3,070 75.0 58.5 52.2
Chad 2,110 40.2 50.2 87.0
Gabon 18,880 83.2 52.1 45.1
Niger  950 19.1 55.5 82.8

Calculate the mean for GNI per capita.

1c3 marks

The country of Gabon is classified as an Emerging and Developing Country (EDC).

Use one piece of data from the table above to explain why.

Did this page help you?

2a1 mark

Dynamic Development

Which one of the following is a physical factor influencing global uneven development?

  • Climate

  • Culture

  • Healthcare

  • Technology

2b3 marks

Explain how economic measures of development illustrate consequences of uneven development.

Did this page help you?

3a1 mark

Dynamic Development

Which of the following is the correct definition of development?

  • When a country becomes less economically stable

  • When a country’s population grows

  • When countries have a small range of jobs and services

  • When there is an improvement in living standards in a country

3b3 marks

Study Fig. 2, a graph showing the GNI per capita in Mozambique. GNI per capita is the sum of all money earned in a country, divided by its population.

fig-2-insert-paper2-nov-2020-ocr-gcse-geography

Figure 2

Describe the pattern shown for Mozambique

3c1 mark

Study Fig. 2 , a graph showing the GNI per capita in Mozambique. GNI per capita is the sum of all money earned in a country, divided by its population

fig-2-insert-paper2-nov-2020-ocr-gcse-geography

Figure 2

Suggest one way in which the change in GNI per capita may have impacted the people of Mozambique.

3d2 marks

Study Fig. 2,  a graph showing the GNI per capita in Mozambique. GNI per capita is the sum of all money earned in a country, divided by its population.

fig-2-insert-paper2-nov-2020-ocr-gcse-geography

Figure 2

Explain one reason why it may be hard for countries like Mozambique to break out of poverty

Did this page help you?

41 mark

Which of the following statements best describes an advanced country?

  • a country which has a high amount of patients per doctor

  • a country which has a high birth rate

  • a country which is rapidly becoming richer

  • a country which is wealthy and has a wide range of jobs and services

Did this page help you?

5a3 marks

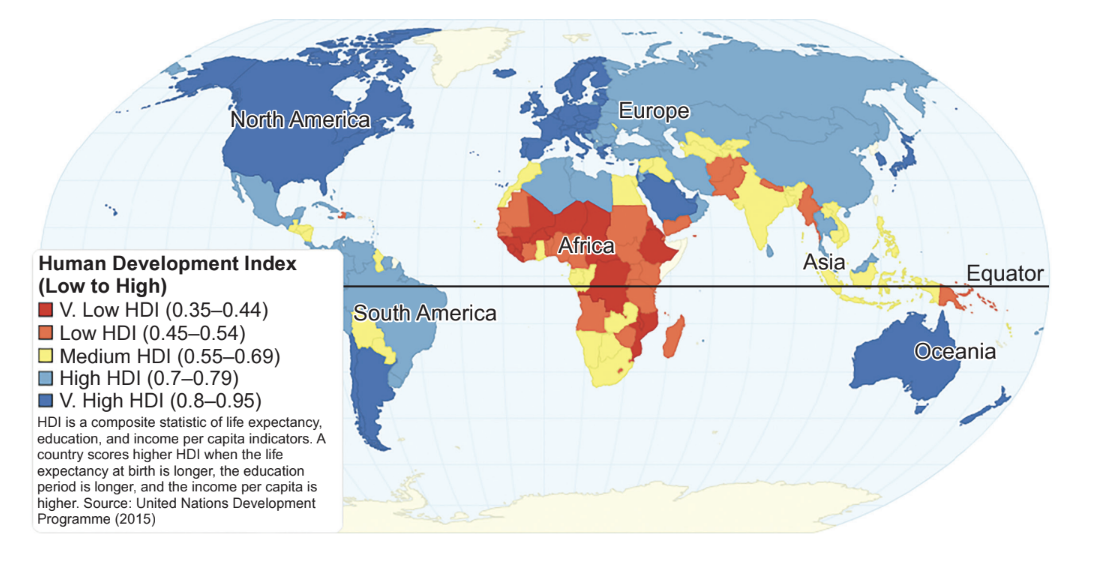
Study Fig. 2, which shows a world map with Human Development Index (HDI) scores.

fig-2-insert-nov-2021-paper2-ocr-gcse-geography

Figure 2

Describe the pattern of HDI scores shown in Fig. 2.

5b1 mark

Study Fig. 3, which shows a graph of HDI scores of selected countries.

fig-3-insert-nov-2021-paper2-ocr-gcse-geography

Figure 3

By how much has the HDI for India increased between 2000 and 2017?

Answer ..........................................................

Did this page help you?

18 marks

CASE STUDY – Low-Income Developing Country (LIDC) development

For an LIDC you have studied, assess how successful it has been in meeting two of the Millennium Development Goals.

Name of LIDC:

Did this page help you?

16 marks

CASE STUDY – Trade in an LIDC country

Name of LIDC country: ......................................................

For an LIDC country which you have studied, explain how international trade has influenced its development

Did this page help you?

28 marks

CASE STUDY – LIDC development

Name of LIDC country:

Explain how the wider political, environmental and social context affected the development of your named country.

Did this page help you?