River Fieldwork: Methods (Edexcel GCSE Geography A)
Revision Note

Author
Bridgette BarrettExpertise
Geography Lead
River Fieldwork Methods
Data Collection Methods
The data collection methods will depend on the aims/hypothesis of the fieldwork
The starting point with most river fieldwork is to measure the width and depth
Data collection should include both quantitative and qualitative methods
The collection of quantitative data can be completed in several ways in a river study
Quantitative data collection
Width
The measurement of width is taken where the water surface comes into contact with the river banks.

Measurement of River Width
To take an accurate measurement:
Measure from the point where the dry bank meets the water on one side to the point where the dry bank meets the water on the opposite side
Ensure that the tape is held taut and does not touch the water this could affect the reliability of the data
Depth
The measurement of depth should be completed at regular intervals across the width
This ensures a full picture of the changes in depth across the whole channel width is recorded
It also allows a mean depth to be calculated to use in the calculation of river discharge

Depth Measurements
To take an accurate depth measurement:
Work out the distance apart each depth measurement needs to be
Place a meter rule into the water at the correct point
Ensure the meter rule is placed sideways with the flat side facing the banks: this reduces any impact on the water height ensuring more accurate measurements
Record the distance from the bed to the surface of the water
Repeat this across the width of the river
Velocity
The velocity is the speed at which the river flows
This can vary across the channel width as well as along the course of the river so velocity should be recorded in three positions: towards the left bank, centre and towards the right bank

Positions in River Channel for Velocity Measurements
Using a flow meter velocity can be easily measured by:
Taking readings at three equal distances across the river width
Placing the flow meter into the water at least 3cm below the surface
Three readings should be taken at each of the three places across the channel to allow the calculation of a mean
To take an accurate measurement using a float:
Measure a set distance upstream - for example, 10 meters
Drop a float at the start of the 10 meters
Time how long it takes for the float to travel the distance using a stopwatch
Repeat at each position three times to allow the calculation of a mean
Discharge
The discharge of the river is calculated rather than measured
The first step is to calculate the cross-sectional area:
Cross-sectional area (m2) = width (m) x mean depth (m)
The second step is to calculate the velocity:
If a flow meter the mean velocity should be calculated by adding the velocity measurements and dividing by the number of measurements
If a float has been used and a distance of 10m then the meantime should be divided by 10 to calculate the time taken to travel 1m
Discharge (m3/s) = cross-sectional area (m2) x velocity (m/s)
Gradient
As it moves downstream rivers decrease in height
This is the gradient of the river
The gradient is measured over a 10 meter stretch of river with a ranging pole placed at 0m and another clinometer at 10 meters
A clinometer is then used to measure the difference in height between the two poles

Measuring gradient using a clinometer
Qualitative data collection
Photographs and Field Sketches
Photographs and field sketches are qualitative data
Just as with any data collection and presentation they have strengths and weaknesses
In a river enquiry photographs and field sketches can be used to show landforms and particular features such as bed load
Photographs are also ideal for illustrating the data collection methods used
Worked Example
Study Figure 1
Describe one fieldwork method the students could have used to collect data to investigate this river landscape
(2)

Your answer can refer to any of the data collection methods outlined in this revision note
One mark will be awarded for the identification of the river variable and how it is measured
The second mark will be awarded for developing the point to explain the measurement further
Answer:
One possible answer is:
One possible data collection method the students could have used is measuring the depth of the river placing a metre ruler (1) at equal intervals along the width of the river (1)
Exam Tip
Annotations and labels are not the same. A label is a simple descriptive point. For example, 'meander'. Whereas an annotation is a label with a more detailed description or an explanatory point. For example, 'slip off slope where the material has been deposited due to slower flow'
River Enquiry Data Presentation
Data presentation can take many forms
Primary Data
Much of the primary data collected in a river enquiry will be presented in the form of a graphs
Each type of graph is suitable for particular data sets
The graphs also may have strengths and limitations
Line graphs
One of the simplest ways to display continuous data
Both axes are numerical and continuous
Used to show changes over time or space
Strengths | Limitations |
|---|---|
Shows trends and patterns clearly | Does not show causes or effects |
Quicker and easier to construct than a bar graph | Can be misleading if the scales on the axis are altered |
Easy to interpret | If there are multiple lines on a graph it can be confusing |
Requires little written explanation |
|
A river cross-section is a particular form of line graph because it is not continuous data but the plots can be joined to show the shape of the river channel

Bar graphs
One of the simplest methods to display discrete data
Bar graphs are useful for:
Comparing classes or groups of data
Changes over time
Strengths | Limitations |
|---|---|
Summarises a large set of data | Requires additional information |
Easy to interpret and construct | Does not show causes, effects or patterns |
Shows trends clearly | Can only be used with discrete data |

Scatter graph
Points should not be connected
The best fit line can be added to show the relations
Used to show the relationship between two variables
In a river study, they are used to show the relationship between different river characteristics such as the relationship between the width and depth of the river channel
Strengths | Limitations |
|---|---|
Clearly shows data correlation | Data points cannot be labeled |
Shows the spread of data | Too many data points can make it difficult to read |
Makes it easy to identify anomalies and outliers | Can only show the relationship between two sets of data |

Proportional symbols map
The symbols on the map are drawn in proportion to the variable represented
Usually, a circle or square is used but it could be an image
Can be used to show a range of data, for example, population, wind farms and electricity they generate, traffic or pedestrian flows
Strengths | Limitations |
|---|---|
Illustrates the differences between many places | Not easy to calculate the actual value |
Easy to read | Time-consuming to construct |
Data is specific to particular locations | Positioning on a map may be difficult, particularly with larger symbols |
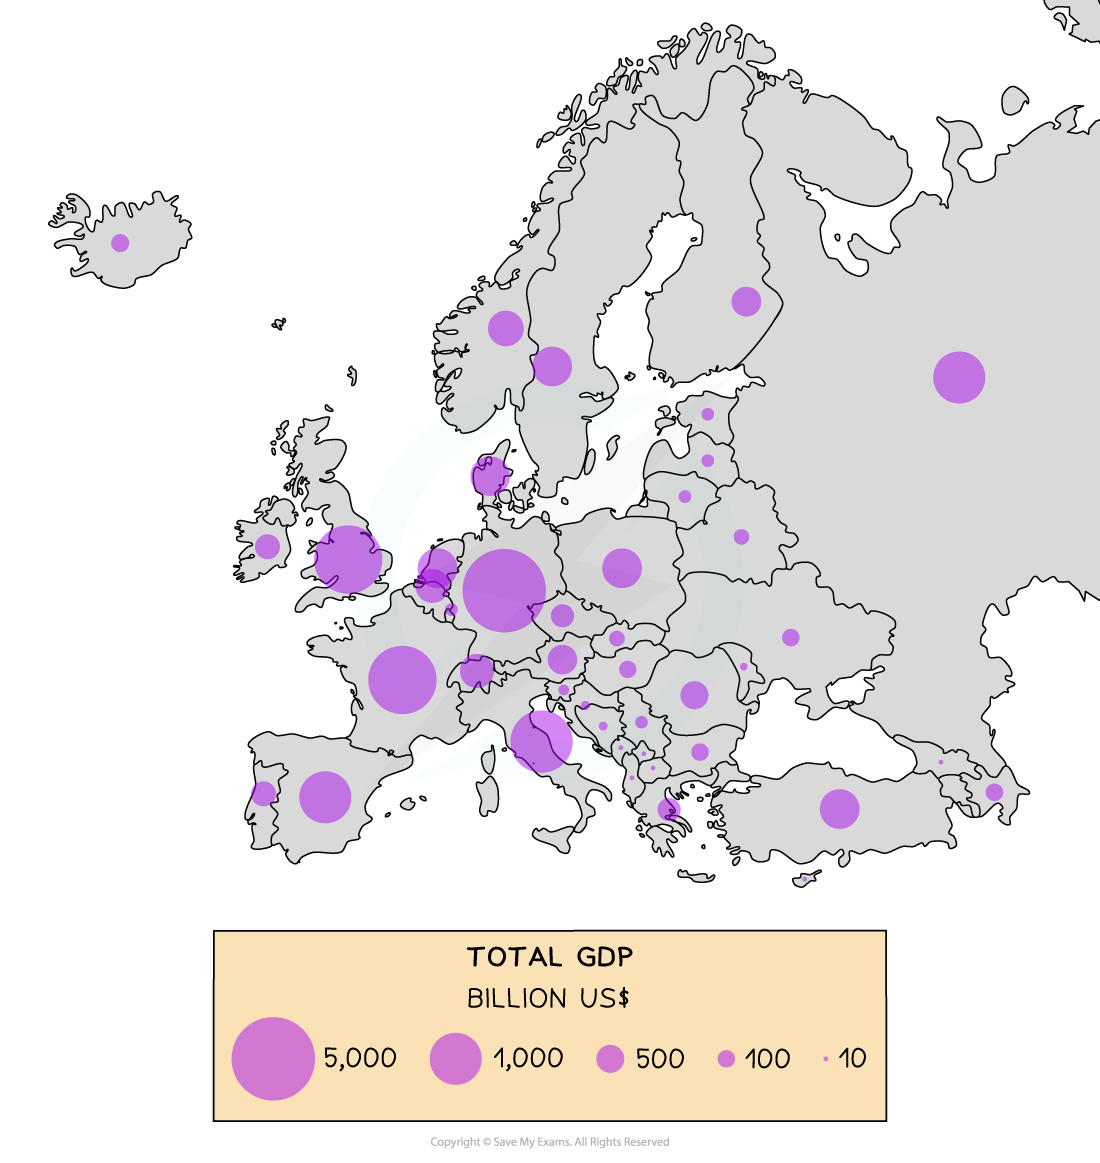
Proportional Circles Map Showing GDP (Billion US$) across Europe
Pie chart
Used to show proportions, the area of the circle segment represents the proportion
A pie chart can also be drawn as a proportional circle
Pie charts can be located on maps to show variations at different sample sites
Strengths | Limitations |
|---|---|
Clearly shows the proportion of the whole | Do not show changes over time |
Easy to compare different components | Difficult to understand without clear labelling |
Easy to label | Hard to compare two sets of data |
Information can be highlighted by separating segments | Can only use for a small number of categories otherwise lots of segments become confusing |

Pie Chart Showing Energy Sources in an Area
Worked Example
Explain one advantage of the type of graph you used to present fieldwork data
(2)
In your answer, you will be expected to state the type of graph you used, this can be any type of graph
You will not be awarded a mark for stating the type of graph but for explaining one of its advantages
You will only be awarded marks for one advantage, if you state a second advantage no marks will be awarded for the information you include relating to this
Answer:
One possible answer is:
In my river investigation, I drew cross-section river profiles of the River Dove to show changes in the width and depth across three sites (1). This provided clear evidence to analyse the difference downstream to see if the two variables increased as expected(1) this allowed patterns to be seen more clearly compared to just using a data table (1).
Exam Tip
In the exam, you will not be asked to draw an entire graph. However, it is common to be asked to complete an unfinished graph using the data provided. You may also be asked to identify anomalous results or to draw the best fit line on a scattergraph.
Take your time to ensure that you have marked the data on the graph accurately
Use the same style as the data which has already been put on the graph
Bars on a bar graph should be the same width
If the dots on a graph are connected by a line you should do the same
Secondary Data
Any fieldwork should include secondary data as well as primary data
In a river enquiry suitable secondary data may include:
River discharge data from the Environment Agency
Weather data from the Meteorological Office (Met Office)
Old photographs of the river sample site
Newspaper articles/websites about the river
Ordnance Survey maps to identify the sample sites
Geology maps
Aerial photographs
Analysis
Once data has been collected and presented it needs to be analysed
The data which is collected from the river such as width, depth, velocity is quantitative data and will need to be analysed using statistical methods
One of the main statistical methods used in a river enquiry will be the mean where mean depth or velocity needs to be calculated
Geographical theories and case studies can also be used in the analysis to explain whether the data collected was as would be expected based on knowledge from those theories/case studies
Analysing Photographs and Field Sketches
Use of photographs and field sketches is a qualitative analysis
Photographs can be used in a river enquiry to analyse a number of features:
Landforms and their formation
Data collection techniques

Annotation of a photograph
Conclusion
Once the data collected has been analysed, conclusions can be reached
This should state whether the hypothesis has been proved or disproved
Identify and explain anomalies such as:
Decreasing average depth or width with distance downstream at one site
Decreased velocity at a particular site
Anomalies may just occur or may be the result of incorrect recording or human error reading equipment
Evaluation
The final stage of the river enquiry is the evaluation where you note how successful, or not, the river investigation was and what you would do differently next time
Next time I would take measurements over a longer period of time to ensure the reliability of data...
My equipment failed and I would make sure to bring a spare next time...
I think my investigation went well and I would like to repeat this after a storm event to see how much erosion has taken place...
Exam Tip
It is essential that you are able to evaluate the methods you have used and the conclusions you have reached in your fieldwork. The examiner will be looking for you to write about the accuracy and reliability of the data you collected.
For example, if you used a float rather than a flow meter to measure velocity, this may have affected the accuracy of the results because using a float is not as accurate. This in turn may then affect the reliability of your results (can they be repeated and get the same result) and therefore may also affect your conclusions.

You've read 0 of your 0 free revision notes
Get unlimited access
to absolutely everything:
- Downloadable PDFs
- Unlimited Revision Notes
- Topic Questions
- Past Papers
- Model Answers
- Videos (Maths and Science)
Did this page help you?