10. How the Macroeconomy Works (AQA A Level Economics)

Topic Questions

19 marks

 Extract C: Free market, supply-side labour market reforms

Free market supply-side reforms often focus on either encouraging individuals to take up work by making it more attractive, or by making it more difficult for people to remain on unemployment-related benefits. A feature of recent government supply-side policy has been to create and maintain flexible working practices. The Confederation of British Industry (CBI) argues that “the UK’s flexible labour market is an invaluable strength of our economy which should be protected”. The UK’s employment rate is the highest since recent records began in 1971, and 97% of firms say the UK’s flexible labour market is vital to improving firms’ competitiveness.

Having a flexible workforce, which can respond quickly to changes in demand, may benefit both businesses and workers. There is a growing need for workers to have more flexibility, whether to allow them to balance work with such things as childcare, study commitments or as an alternative income when work in their preferred occupation is unavailable. Some labour market analysts also point to flexible labour markets as one of the key reasons that, after the recession of 2008–09, unemployment did not reach the levels it did in the recessions of the 1980s and 1990s.

Some point to the fact the UK has the least-regulated labour market in Europe. Hiring and firing staff is easier than in countries such as France, where the difficulty of getting rid of unproductive workers makes firms more cautious about employing someone in the first place.
Improving workers’ productivity is the key to increasing real GDP and real wage rises. Having a flexible workforce allows the UK to meet the challenges of a dynamic global economy. It not only helps keep unemployment low, but also helps achieve other macroeconomic objectives.

Source: News reports, 2018

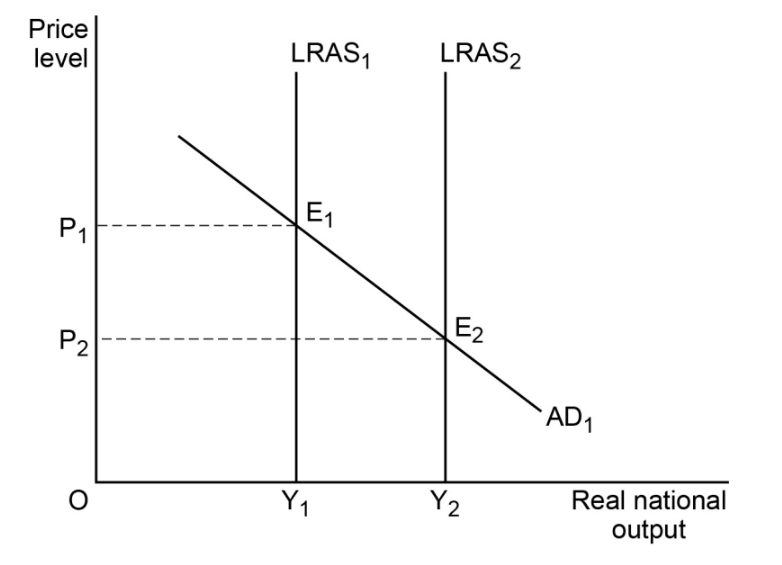
Extract C (line 19) states: ‘Improving workers’ productivity is the key to increasing real GDP’. 

With the help of a diagram, explain how improving productivity should lead to rising real GDP.

Did this page help you?

21 mark

In an economy, the marginal propensity to consume is 0.6. All other things being equal, which one of the following statements is correct?

  • A £5 billion reduction in the economy’s national income will result in a £3 billion fall in consumption

  • If injections into the circular flow of income equal £20 billion, national income will equal £32 billion

  • If injections into the circular flow of income rise by £10 billion, national income will rise by £6 billion

  • When the economy’s national income equals £100 billion, consumption will equal £60 billion

Did this page help you?

31 mark

Figure 7 shows two aggregate demand (AD1 and AD2) curves and two long-run aggregate supply (LRAS1 and LRAS2) curves for an economy.

q26-paper-3-june-2020-aqa-a-level-economics

All other things being equal, which one of the following combinations, A, B, C or D, is most likely to explain the movement of the economy from E1 to E2?
An increase in the

  • budget surplus and size of the multiplier.

  • exchange rate and supply of money.

  • rate of inflation and positive output gap.

  • volume of exports and potential output.

Did this page help you?

49 marks

Extract E: Deficit reduction


In 2017, the Chancellor of the Exchequer claimed that the government was on course to create a budget surplus by 2025. However, the Office for Budget Responsibility (OBR) has suggested that the budget deficit will not be wiped out until 2031. This is 16 years later than originally forecast.


The Government borrowed £52bn in 2016–17, a fall of £20bn compared to the year before, as the long struggle to eliminate the deficit moved closer towards its goal. However, the OBR has forecast a ‘weaker’ economy than it did just nine months ago; it expects economic growth to slow and government borrowing to rise as a result. The OBR also delivered the biggest downgrade to productivity growth in its history, with output per hour expected to be 4.6% lower in 2022 than originally forecast.


The financial crisis of 2007–08 led to a budget deficit of almost 11% of GDP in 2009–10; the deficit has now fallen to 2.6% of GDP, the lowest level of borrowing since 2007–08. If growth could be increased, the budget deficit would fall much faster.


Why is deficit reduction so important in the first place? Firstly, there are the negative effects of larger interest repayments caused by a higher national debt. There is also the argument that public spending crowds out the private sector. Some economists point to the effects on future generations and the possibility that the government’s credit rating may fall if borrowing is high.

Source: News reports, 2017

Extract E (lines 11–12) states ‘If growth could be increased, the budget deficit would fall much faster.’ 

With the help of a diagram, explain why a higher rate of economic growth is likely to reduce the budget deficit.

Did this page help you?

51 mark

The diagram below shows the aggregate demand (AD) curve, the long-run aggregate supply (LRAS) curve, and two short-run aggregate supply (SRAS1 and SRAS2) curves for an economy. The economy’s initial equilibrium is at E1.

q4-paper-3-june-2019-aqa-a-level-economics

The most likely explanation for the move of the economy from its initial equilibrium at E1 to a new short-run equilibrium at E2 is a decrease in the

  • level of tariffs on imports.

  • productivity of capital.

  • rate of wage inflation.

  • value of government subsidies to farmers.

Did this page help you?

61 mark

Which one of the following policies is most likely to improve the supply side of the economy? A policy which

  • increases the budget surplus

  • reduces the natural rate of unemployment

  • shifts resources from capital to labour intensive industries

  • shifts the burden of tax from indirect to direct taxation.

Did this page help you?

71 mark

The diagram below shows two aggregate demand (AD) curves and the short-run aggregate supply (SRAS) curve for an economy.

q12-june-2018-aqa-a-level-economics

All other things being equal, the change in real national output from Y1 to Y2 is most likely to have been caused by an increase in the

  • government’s budget deficit.

  • level of interest rates.

  • size of the labour force.

  • volume of exports.

Did this page help you?

81 mark

An economy is in a state of macroeconomic equilibrium. The levels of investment, savings, exports and imports are shown below.

Injections into and withdrawals from the circular flow of income

Investment                                         £200 bn

Savings                                              £200 bn

Exports                                              £300 bn

Imports                                              £400 bn

It can be inferred from the data in the table above that

  • government expenditure equals taxation.

  • the budget surplus equals the balance of payments deficit.

  • the budget surplus equals the balance of payments deficit.

  • the government has a budget surplus.

Did this page help you?

91 mark

The diagram below shows two long-run aggregate supply (LRAS) and two short-run aggregate supply (SRAS) curves for an economy.

q18-june-2018-aqa-a-level-economics

All other things being equal, which one of the following is most likely to explain the movement to the right of both the short-run and long-run aggregate supply curves?

  • A large increase in the availability of renewable energy within the economy

  • An increase in employment and a depreciation of the exchange rate

  • An increase in the natural rate of unemployment and the level of money wage rates

  • A supply-side shock to the economy which increases the rate of inflation

Did this page help you?

109 marks

Extract B: Is India still a developing country?

Every region of the world has seen improvements in its HDI and India, in particular, has seen major changes. Job creation is a key aspect of development. However, 95% of all workers in India are in informal employment where there is no monitoring or taxation. Nearly 120 million more workers will enter the Indian labour force over the next 10 years seeking manufacturing jobs but, so far, these jobs have not appeared. Manufacturing still counts for less than 20% of all jobs and more than half of all workers are in low productivity agriculture. The large amount of informal employment also reduces tax receipts, which limits the amount the Indian government can spend to improve the economy.

India is still a very poor country with low per capita income, widespread destitution, hunger and malnutrition. Moreover, it has poor health facilities, housing and infrastructure as well as slowly expanding education and a strong reliance on foreign aid. Despite the emergence of a rising middle class, inequality is growing and the majority of the population lack basic social and economic rights. The Indian government must find a way to do more to provide for its citizens. However, when the government has intervened in the economy, it has often resulted in failure. Some say the Indian government should adopt the Chinese model of export-led industrialisation.

Until the early 1990s, India was a closed economy: average tariffs exceeded 200%, quotas on imports were extensive and there were restrictions on foreign investment. India still protects its economy with anti-dumping measures and export subsidies that are designed to promote economic growth. In the past, nearly all advanced economies have benefited from protectionist policies, why should India be any different?

Source: News reports, 2016

Extract B (lines 17–19) states ‘India still protects its economy with anti-dumping measures and export subsidies that are designed to promote economic growth.’ 

With the help of a diagram, explain how export subsidies may help promote economic growth in India.

Did this page help you?

11
Sme Calculator
1 mark

Assuming that the value of the marginal propensity to consume is 0.6, which of the following changes in national income would result from an increase in exports of £19bn?

  • £31.7bn

  • £47.5bn

  • £76bn

  • £114bn

Did this page help you?

12
Sme Calculator
1 mark

The diagram below depicts an aggregate demand (AD) curve and two long-run aggregate supply (LRAS) curves for an economy. The economy’s initial equilibrium is at E1

q18-june-2017-aqa-a-level-economics

All other things being equal, the movement of the economy from its initial equilibrium at E1 to E2 is most likely to be caused by an increase in

  • government borrowing

  • labour productivity

  • the rate of deflation.

  • money wage rates

Did this page help you?

131 mark

The diagram below shows the aggregate demand (AD) and two short-run aggregate supply (SRAS) curves for an economy.q28-june-2017-aqa-a-level-economics

All other things being equal, which one of the following is most likely to cause the short-run aggregate supply curve to shift from SRAS1 to SRAS2?

  • A fall in the size of the labour force

  • An increase in imports

  • An increase in the value of the multiplier

  • Lower world commodity prices

Did this page help you?

149 marks

Extract B: What is GDP?


Imagine £50 notes stacked on top of each other, stretching almost 4500 kilometres into the sky. This fantastically large amount of money (more than £2 trillion) is the current estimated value of the UK’s Gross Domestic Product (GDP).

GDP is the standard measure of the size and health of a country’s economy but it is important to distinguish between nominal and real GDP. It’s the way we measure and compare how well or badly countries are doing. In other words, it is the total value of the output of goods and services produced in an economy over a period of time. The higher the value of GDP, the bigger the economy. If injections into an economy’s circular flow of income increase, then this may generate multiple increases in GDP, depending upon the size of the marginal propensity to consume.

Why is the measurement of GDP important? Well, it’s a way of keeping track of how the economy is doing, and whether it is growing. We can also use it to measure one economy against other economies using purchasing power parity exchange rates. If real GDP goes up, the economy is doing well; this is associated with higher incomes, more jobs and higher spending. If real GDP goes down, the economy is not doing so well; this is associated with falling incomes, lower consumption and a lower standard of living.

Extract B (lines 8–9) states ‘If injections into an economy’s circular flow of income increase, then this may generate multiple increases in GDP.’ 

With the help of a diagram, explain how an increase in injections may generate multiple increases in an economy’s GDP.

Did this page help you?

15
Sme Calculator
2 marks

Extract D

Figure 3: UK household gross debt to income, 2006 to 2020

extract-d-paper-2-june-2018-aqa-a-level-economics

Figure 4: Household saving ratio, 2006 to 2016 


Year

Saving ratio (%)

2006

7.6

2008

7.5

2010

11.2

2012

9.3

2014

8.4

2016

7.1

Using the data in Extract D (Figure 4), calculate the average amount saved per household in 2016 if average household income was £26 300. Give your answer to the nearest pound.

Did this page help you?

16
Sme Calculator
4 marks

Extract D

Figure 3: UK household gross debt to income, 2006 to 2020

extract-d-paper-2-june-2018-aqa-a-level-economics

Figure 4: Household saving ratio, 2006 to 2016 


Year

Saving ratio (%)

2006

7.6

2008

7.5

2010

11.2

2012

9.3

2014

8.4

2016

7.1

Explain how the data in Extract D (Figures 3 and 4) show that consumer confidence may have risen since 2014.

Did this page help you?

17
Sme Calculator
1 mark

Figure 1 shows three aggregate demand (AD) curves, a short-run aggregate supply (SRAS) curve and a long-run aggregate supply (LRAS) curve.

q4-paper-3-june-2020-aqa-a-level-economics

In Figure 1, when

  • aggregate demand shifts from AD1 to AD2, cyclical unemployment is likely to be eliminated.

  • aggregate demand shifts from AD1 to AD3, the rate of economic growth is equal to (Y3 – Y1).

  • the economy is producing at Y1, there is a positive output gap.

  • the economy is producing at Y1, there is a positive output gap.

Did this page help you?