1 2 marks
Extract A

Using the data in Extract A (Figure 1), calculate the mean unemployment rate for the UK from 2007–08 to 2017–18. Give your answer to one decimal place.
Did this page help you?
Extract A
Using the data in Extract A (Figure 1), calculate the mean unemployment rate for the UK from 2007–08 to 2017–18. Give your answer to one decimal place.
Did this page help you?
Extract A
Explain how the data in Extract A (Figure 2) show that the UK has had poor real wage growth since 2008.
Did this page help you?
Table 4 shows the weights used in the Consumer Prices Index (CPI) for a selection of items in 2008 and 2018.
| Category | 2008 weight | 2018 weight |
| Food and non-alcoholic beverages | 109 | 101 |
| Alcoholic beverages and tobacco | 42 | 42 |
| Clothing and footwear | 63 | 70 |
| Transport | 152 | 156 |
| All goods | 547 | 519 |
| All services | 453 | 481 |
The data in Table 4 indicate that between 2008 and 2018 the
average price of goods fell, whereas the average price of services increased.
percentage increase in the price of ‘Clothing and footwear’ was greater than the percentage increase in the price of ‘Transport’.
proportion of total expenditure, by a typical household, on ‘Alcoholic beverages and tobacco’ did not change.
total expenditure of a typical household on ‘Food and non-alcoholic beverages’ fell.
Did this page help you?
Extract B

Figure 2: Income inequality

Figure 3: Homelessness

To what extent, if at all, do the data suggest that living standards in the UK improved
between 2007 and 2017? You must use the data in Extract B to support your
assessment.
Did this page help you?
Extract C: Growth of the world economy is set to slow in 2019
The International Monetary Fund has forecast that world growth will fall from 3.7% in 2018 to 3.5% in 2019, affecting the markets for UK exports. Increasing protectionism risks reducing investment and global trade flows. If all tariffs currently under consideration were implemented by all countries, they would affect about 5% of global trade. Growth in the US has remained strong but economic activity in the eurozone and China has been weaker than expected. With continuing uncertainty regarding the UK’s future relationship with the EU, a slowdown in the world economy is not good news for living standards in the UK. Exports are important for UK firms, for employment and people’s incomes. However, since 2015, the pound has depreciated against most major currencies and this is expected to boost net trade and make a positive contribution to UK economic growth.
Explain how a sustained slowdown in the world economy is likely to affect living standards in the UK.
Did this page help you?
Extract A
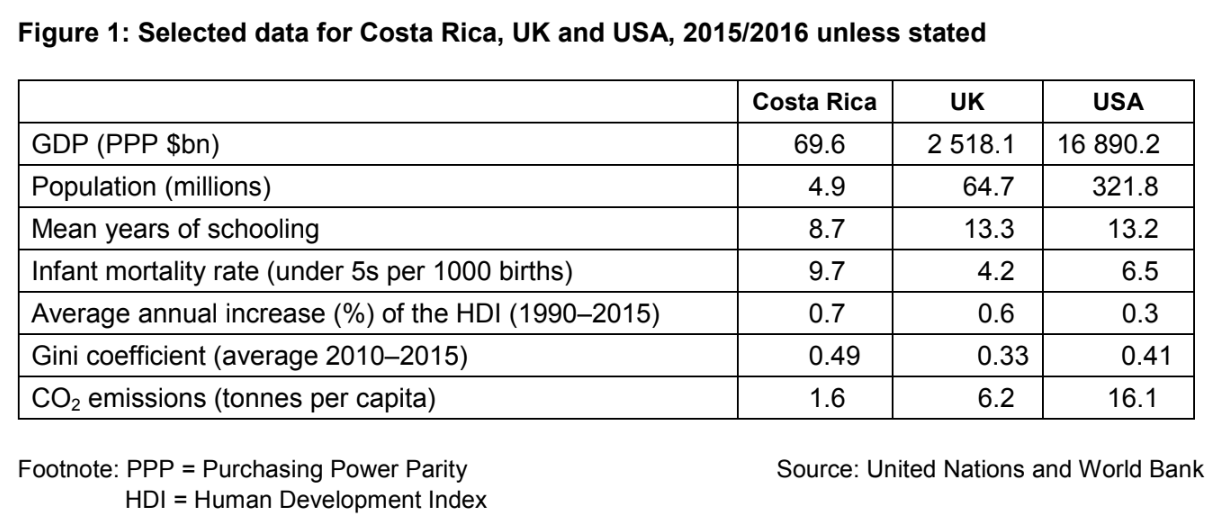
Using the data in Extract A, calculate the GDP per capita for Costa Rica in 2015/2016 to the nearest dollar.
Did this page help you?
Extract A
Explain how the data in Extract A indicate living standards may be higher in the UK than in the USA.
Did this page help you?
An economy had a 3% increase in its real GDP over a one year period. In the same period its population grew by 5% and its rate of inflation was 2.5%. From these data it can be inferred that
its Human Development Index decreased by 2%.
nominal GDP per capita increased.
real wages fell due to inflation.
the number of unemployed people increased.
Did this page help you?
An economy’s GDP increased from £400 billion in 2016 to £428 billion in 2018. Using
2016 as the base year, what is the value of the index for GDP in 2018?
103.5
106.5
107.0
128.0
Did this page help you?
Extract A

Using the data in Extract A (Figure 2), calculate, to two decimal places, the mean growth rate for India from 2010 to 2014.
Did this page help you?
Extract A
Explain why the data in Extract A (Figure 1) show that living standards in India have improved.
Did this page help you?
The following table shows the real GDP of an economy from 2012 to 2016.
| Year |
2012 | 2013 | 2014 | 2015 | 2016 |
| Real GDP (£bn) |
213 | 215 | 245 | 256 | 271 |
If the figures were converted to index form with 2013 as the base year, what would
be the value of the index (to the nearest whole number) in 2016?
124
125
126
127
Did this page help you?
The information below shows the changes in key economic indicators for a country over a period of one year.
|
Money GDP |
Rate of inflation |
Population increase |
Gini coefficient |
| +6% | +4% | +1% | –8% |
Which one of the following can be concluded from the data?
External costs generated from economic activity have reduced the quality of life
Real GDP per capita has fallen
The distribution of income has become more unequal
The standard of living of typical residents in the country has probably improved
Did this page help you?