3. Price Determination in Competitive Markets (AQA A Level Economics)

Topic Questions

1
Sme Calculator
1 mark

Figure 4 shows a firm’s demand (D) curve and its marginal revenue (MR) curve for good X. The firm initially sells OQ1 units of X per day at a price of OP1.

Figure 4

q15-paper-3-june-2020-aqa-a-level-economics

If the firm increases its price by 10%

  • price elasticity of demand will decrease.

  • price elasticity of demand will not change.

  • total revenue will decrease.

  • total revenue will increase.

Did this page help you?
2
Sme Calculator
1 mark

Table 3 shows the demand for and supply of oranges at a range of prices between 10 pence and 30 pence.

Table 3


Price (pence)

Quantity

supplied (000s)

Quantity

demanded (000s)

10

100

125

15

120

120

20

122

108

25

125

100

30

128

88


As a result of an increase in consumers’ incomes, the demand for oranges increases by 25% at each of the prices shown in Table 3.

After the rise in incomes:

  • at a price of 10 pence, excess demand increases by 50%.

  • at a price of 30 pence, excess supply falls by 75%

  • the equilibrium market price increases by two-thirds

  • the price elasticity of demand increases by 25% at each price.

Did this page help you?

3
Sme Calculator
1 mark

All other things being equal, the demand for labour is more likely to be wage elastic if

  • it is difficult to substitute capital for labour.

  • the cost of labour is a low percentage of total costs.

  • the final product has a high price elasticity of demand.

  • the supply curve for labour is wage elastic.

Did this page help you?

4
Sme Calculator
1 mark

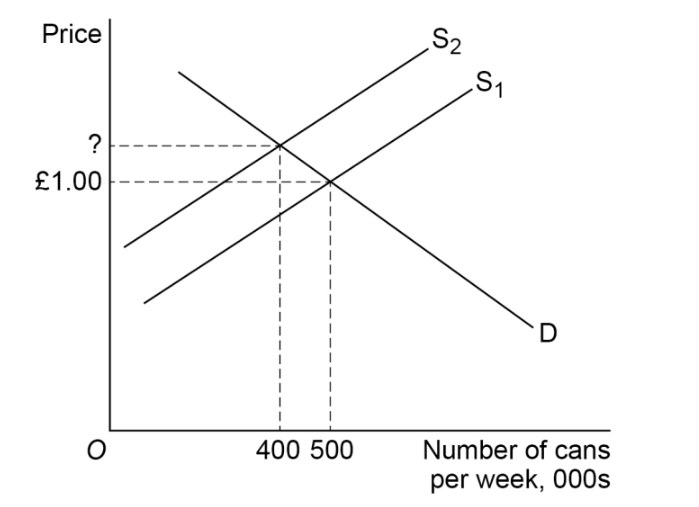
The diagram below shows the market demand (D) curve and two supply (S1 and S2) curves for a brand of soft drink. The drink is a demerit good because of its high sugar content. The government imposes an indirect tax on each can sold that cuts consumption by 100 000 cans per week.

q6-paper-3-june-2019-aqa-a-level-economics

If the price elasticity of demand for the drink is –2.0, the price must have increased by

  • 5p

  • 10p

  • 15p

  • 20p

Did this page help you?

5
Sme Calculator
1 mark

Beef and leather are in joint supply. Changes in farming methods have resulted in a significant fall in the price of chicken, a substitute for beef. All other things being equal, which one of the following diagrams, A, B, C, or D, best illustrates the effects of the fall in the price of chicken on the market for leather?

q22-paper-3-june-2019-aqa-a-level-economics

Did this page help you?

6
Sme Calculator
1 mark

The diagram below shows two market demand curves (D1 and D2) and the market supply curve (S), for Good X.

q29-paper-3-june-2019-aqa-a-level-economics

The price elasticity of supply of Good X when the demand curve shifts from D1 to D2 is

  • +0.25

  • +2.0

  • +4.0

  • +7.5

Did this page help you?

7
Sme Calculator
15 marks

Explain the likely causes of the main changes in house prices that have taken place between 2007 and 2017.

Did this page help you?

8
Sme Calculator
1 mark

At the initial market equilibrium, the income elasticity of demand for fresh chickens is +1.5, and the price elasticity of supply is +1.0. Then there is a 5% increase in consumers’ income.

Which one of the following combinations, A, B, C or D, is most likely to show the changes in the market equilibrium price and quantity?


Price

Quantity

A

Higher

Unchanged

B

Higher

Higher

C

Unchanged

Unchanged

D

Lower

Higher

Did this page help you?

9
Sme Calculator
1 mark

The diagram below shows the demand curves (D1 and D2) and the supply curve (S) in the market for good X. The initial market equilibrium is at E1.
 

screen-shot-2023-06-05-at-8-52-35-am

The increase in market demand from D1 to D2 results in a new market equilibrium at E2. The market mechanism that leads to the establishment of the new equilibrium is based on

  • excess demand for good X at the initial price of P1.

  • excess demand for good X at the new price P2.

  • excess supply of good X at the initial price of P1.

  • excess supply for good X at the new price P2.

Did this page help you?

10
Sme Calculator
1 mark

The price elasticity of demand for games consoles is -1.2. It can be concluded that a 10% reduction in their price would lead to a percentage change in demand of

  • -8.3%

  • -12.0%

  • +8.3%

  • +12.0%

Did this page help you?

11
Sme Calculator
1 mark

The price of good Y, a substitute for good X, rises from 75p to £1. As a result, the quantity of demand for good X rises from 3 million units to 5 million units per month.

What is the value of the cross elasticity of demand for good X with respect to good Y?

  • +0.5

  • –0.5

  • +2.0

  • –2.0

Did this page help you?

12
Sme Calculator
2 marks

screen-shot-2022-09-08-at-2-53-25-pm

Using the data in Extract A (Figure 1), calculate the percentage change in the price of construction sand between January 2014 and January 2018. Give your answer correct to one decimal place

Did this page help you?

13
Sme Calculator
4 marks

screen-shot-2022-09-08-at-3-01-38-pm

Explain how the data in Extract A (Figures 1 and 2) show that expansion in the global sand market is leading to prices of construction sand rising in real terms

Did this page help you?

14
Sme Calculator
2 marks

screen-shot-2022-09-08-at-3-46-04-pm

Using the data in Extract D (Figure 3), calculate the amount of government funding per £ of passenger income in the UK rail industry for the year 2015–16. Give your answer correct to the nearest penny

Did this page help you?

15
Sme Calculator
4 marks

screen-shot-2022-09-08-at-3-51-25-pm


Explain how the data in Extract D (Figure 4) show that in the UK, between 2004 and 2017, changes in the demand for rail travel contributed to changes in the price of rail travel

Did this page help you?