Data Analysis (Cambridge (CIE) AS Environmental Management)
Revision Note

Author
Alistair MarjotExpertise
Biology & Environmental Systems and Societies
Analysing Data
Lincoln index
The Lincoln index can be used to estimate the abundance or population size of a species in a given area
First, the capture-mark-recapture technique is carried out
The first large sample is taken - as many individuals as possible are caught, counted and marked in a way that won’t significantly affect their survival e.g. if studying a species of beetle, a small amount of brightly coloured, non-toxic paint can be applied to their carapace (shell)
The marked individuals are returned to their habitat and allowed to randomly mix with the rest of the population
When a sufficient amount of time has passed another large sample is captured
The number of marked and unmarked individuals within the sample are counted
The proportion of marked to unmarked individuals is used to calculate an estimate of the population size (the Lincoln index, N)
The formula for calculating the Lincoln index is:
N = (n₁ × n₂) ÷ m₂
Where:
N = estimate of population size
n₁ = number of individuals caught in the first sample (i.e. number of marked individuals released)
n₂ = number of individuals caught in the second sample (marked and unmarked)
m₂ = number of marked individuals in the second sample
Worked Example
Scientists wanted to investigate the abundance of leafhoppers in a small grassy meadow. They used sweep nets to catch a large sample of leafhoppers from the meadow. Each insect was marked on its underside with non-toxic waterproof paint and then released back into the meadow. The following day another large sample was caught using sweep nets. Use the figures below to estimate the size of the leafhopper population in this meadow.
Number caught and marked in first sample (n₁) = 236
Number caught in second sample (n₂) = 244
Number of marked individuals in the second sample (m₂) = 71
Answer
Step One: Write out the equation and substitute in the known values
N = (n₁ × n₂) ÷ m₂
N = (236 × 244) ÷ 71
Step Two: Calculate the population size estimate (N)
N = 57 584 ÷ 71
N = 811
N (estimated population size) = 811
Simpson’s index
Communities can be described and compared through the use of diversity indices, which are mathematical tools used to quantify the diversity of species within a community
These indices provide a measure of the variety of species present, as well as their relative abundances, and can be used to compare different communities or to track changes in diversity over time
By quantifying the diversity of species within a community, researchers can gain insight into the ecological processes that drive community structure
When comparing similar communities, a low diversity index may indicate that one of the communities has undergone some kind of disturbance (usually caused by some kind of damaging and detrimental human activity)
Simpson’s index requires data that shows types of species, genera or families
This data can be obtained using quadrat and transect sampling techniques
The formula for calculating Simpson’s index is:
D = 1 - ∑(n ÷ N)²
Where:
D = diversity
∑ = sum of (total)
n = number of individuals of each type present
N = total number of individuals of all types present in the sample
To calculate Simpson’s index:
Step 1: First calculate n ÷ N for each species
Step 2: Square each of these values
Step 3: Add them together and subtract the total from 1
Simpson’s index will give diversity values (D) ranging from 0 to 1
0 represent zero diversity
1 represents very high diversity
The closer the result is to 1, the higher the diversity
Worked Example
Samples of different insect species in a back garden were collected using sweep nets and identification keys. Use the data to calculate Simpson’s index.
Answer
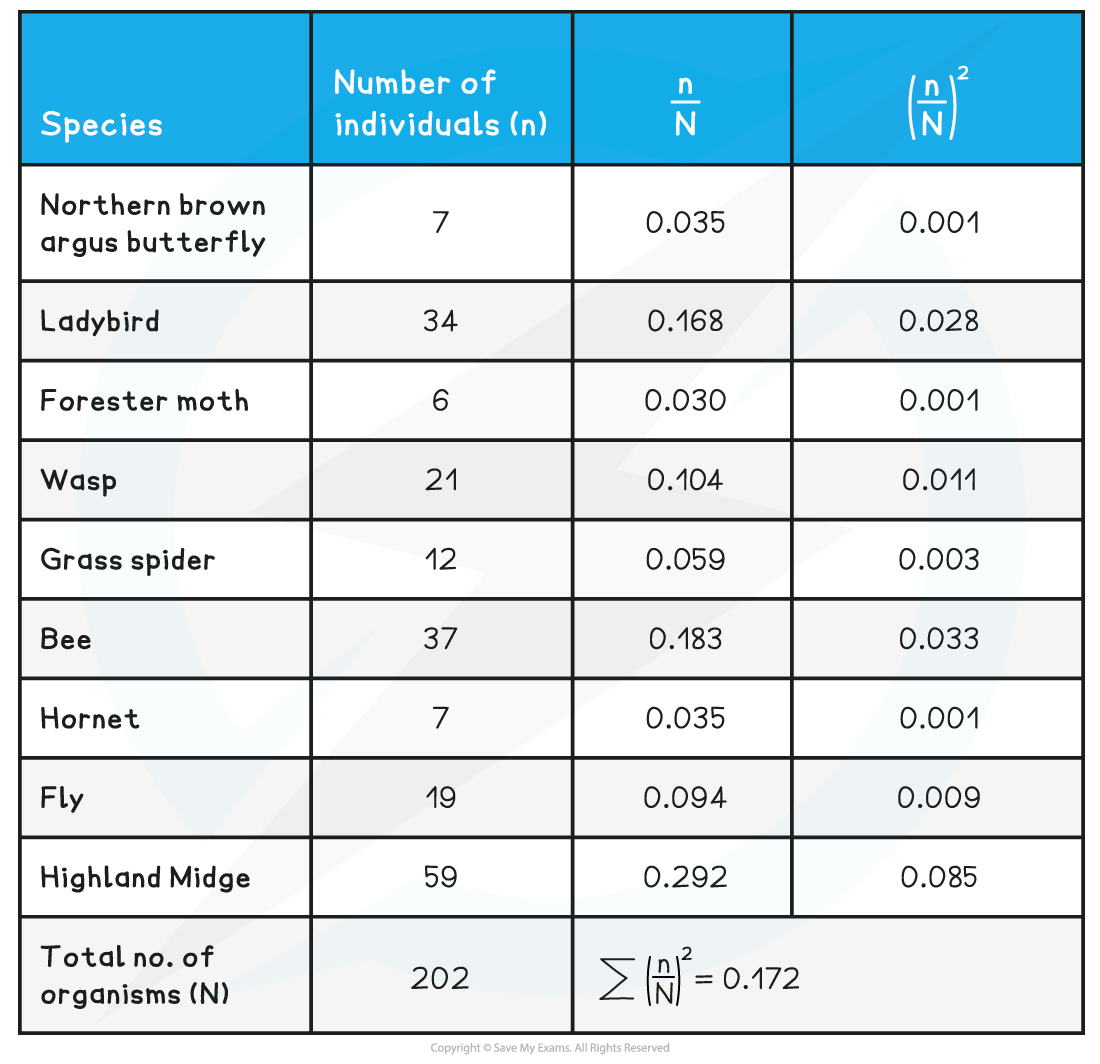
D = 1 - 0.172
D = 0.828
As the value of D is much closer to 1 than 0, it can be said that this is a relatively high value for biodiversity.
Estimating Frequency & Percentage Cover Using Quadrat Data
Frequency and percentage frequency indicate the probability of a particular species being found in any one quadrat within a sample area
Frequency = number of quadrats in which species present ÷ total number of quadrats
% frequency = (number of quadrats in which species present ÷ total number of quadrats) × 100
For example, if bluebells were found in 18 out of 50 quadrats (within an area of woodland) the percentage frequency would be:
(18 ÷ 50) × 100 = 36%
This means that there is a 36% probability that a random quadrat within this sample area of woodland will contain bluebells
However, tt can sometimes be difficult to count individual plants or organisms
If this is the case, percentage cover of the species within the quadrat can be estimated instead
The quadrat is divided into 100 smaller squares
The number of squares the species is found in is equivalent to its percentage cover in that quadrat
For example, if grass is found in 89 out of 100 squares in the quadrat then it has a percentage cover of 89%
This process could be repeated for a series of quadrats within a given sample area
This information can then be used to calculate average percentage cover across all the sampled quadrats


Estimating Abundance Using Quadrat Data
It is possible to estimate abundance using quadrat data and the ACFOR scale
ACFOR = Abundant, Common, Frequent, Occasional, Rare
For example, if a meadow is sampled using a quadrat, each plant species present within each quadrat placed is allocated an abundance letter (A, C, F, O or R)
Although this method is more subjective than calculating percentage cover, it is quicker, providing environmental researchers with faster results and allowing them to sample larger areas within the same amount of time
Exam Tip
You will be provided with the formula for Lincoln’s index in the exam. You need to be able to carry out the calculation to estimate population size from mark-capture-release data, as you could be asked to do this in the exam.
You will also be provided with the formula for Simpson’s index in the exam so you do not need to memorise this, you just need to understand how to use it!

You've read 0 of your 0 free revision notes
Get unlimited access
to absolutely everything:
- Downloadable PDFs
- Unlimited Revision Notes
- Topic Questions
- Past Papers
- Model Answers
- Videos (Maths and Science)
Did this page help you?