Identifying & Interpreting Trends in Data (Edexcel GCSE Statistics)
Revision Note

Author
RogerExpertise
Maths
Trend Lines
How do I draw trend lines on a time series graph?
Time series graphs can go up and down over time
This can make it hard to see what the general trend of the data is
e.g. are things 'on average' tending to increase, decrease, or stay the same over time
A trend line is a line drawn on a time series graph to help identify the general trend
It is possible to draw a trend line by eye directly from a time series graph
In this case the line should go approximately halfway between the lowest and highest points for each cycle (most often the cycle will be a year)
Usually however the trend line will be drawn by eye using moving average points plotted on the time series graph
In this case the trend line is a line of best fit for those moving average points
This is more accurate than simply drawing the line from the raw data points on the time series graph
This should be a single straight line going approximately through the moving average points
It does not mean connecting the moving average points point to point!
Exam Tip
Remember to use a ruler when drawing a trend line
Worked Example
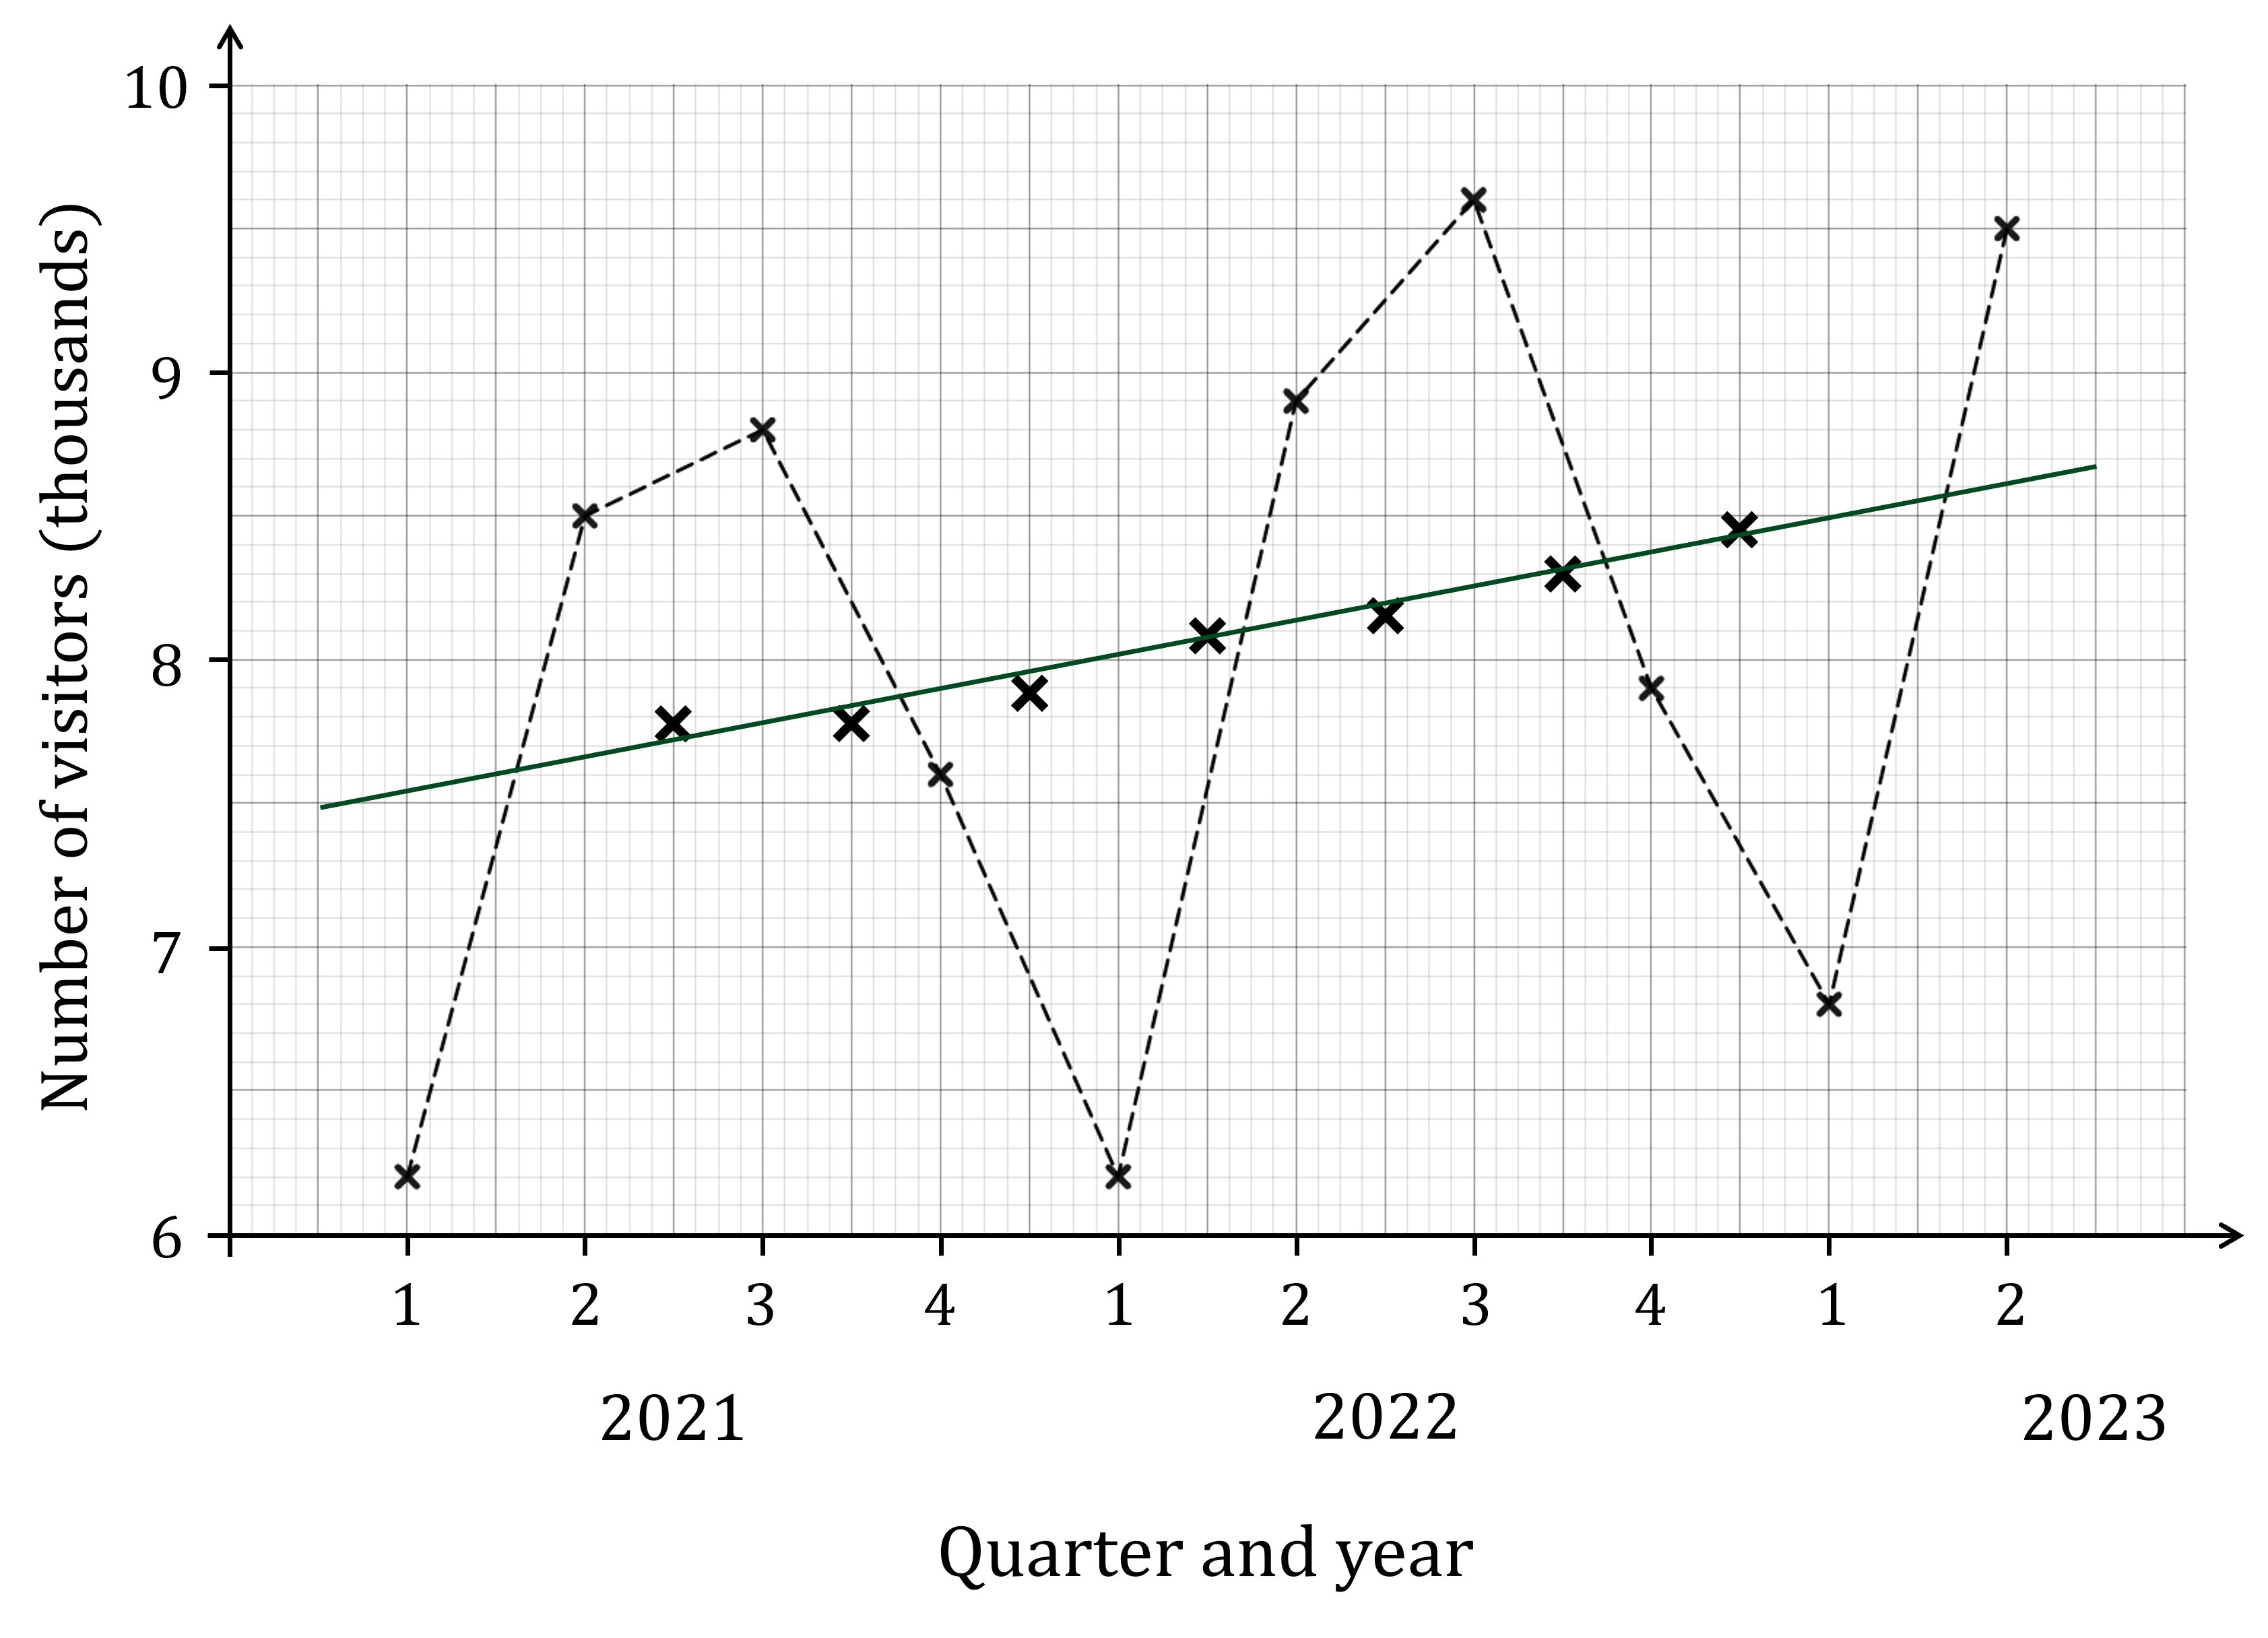
The time series graph shows the number of visitors to Wayne’s World of Widgets for 2021, 2022 and the first two quarters of 2023.

The moving average points for the four point moving averages have also been plotted on the graph.
Draw a trend line on the graph for this data.
The trend line needs to be a straight line that is the line all the moving average points approximately lie along
Remember, it is not drawn by connecting the moving average points point to point!
Trends in Data
What sorts of trends can appear on a time series graph?
There are two types of trend that you should be able to identify and interpret on a time series graph
The general trend is the 'average behaviour' of the data over time
The general trend can be seen from the trend line for the data
If the trend line goes up over time (i.e. has a positive gradient) then we say there is a rising trend
If the trend line goes down over time (i.e. has a negative gradient) then we say there is a falling trend
If the trend line stays the same over time (i.e. is horizontal) then we say there is a level trend

Seasonal or cyclical trends are patterns in the data that repeat over time
For example an ice cream shop may see higher sales every summer and lower sales every winter
Or a town centre restaurant may see higher customer numbers on weekend evenings and lower customer numbers on weekday evenings
These sorts of trends appear as repeating patterns on a time series graph
Exam Tip
When commenting on trends on an exam question be sure to comment in the context of the question
For example don't just say 'There is a rising trend'
But be sure to add something like 'This shows that sales are increasing over time'
Worked Example
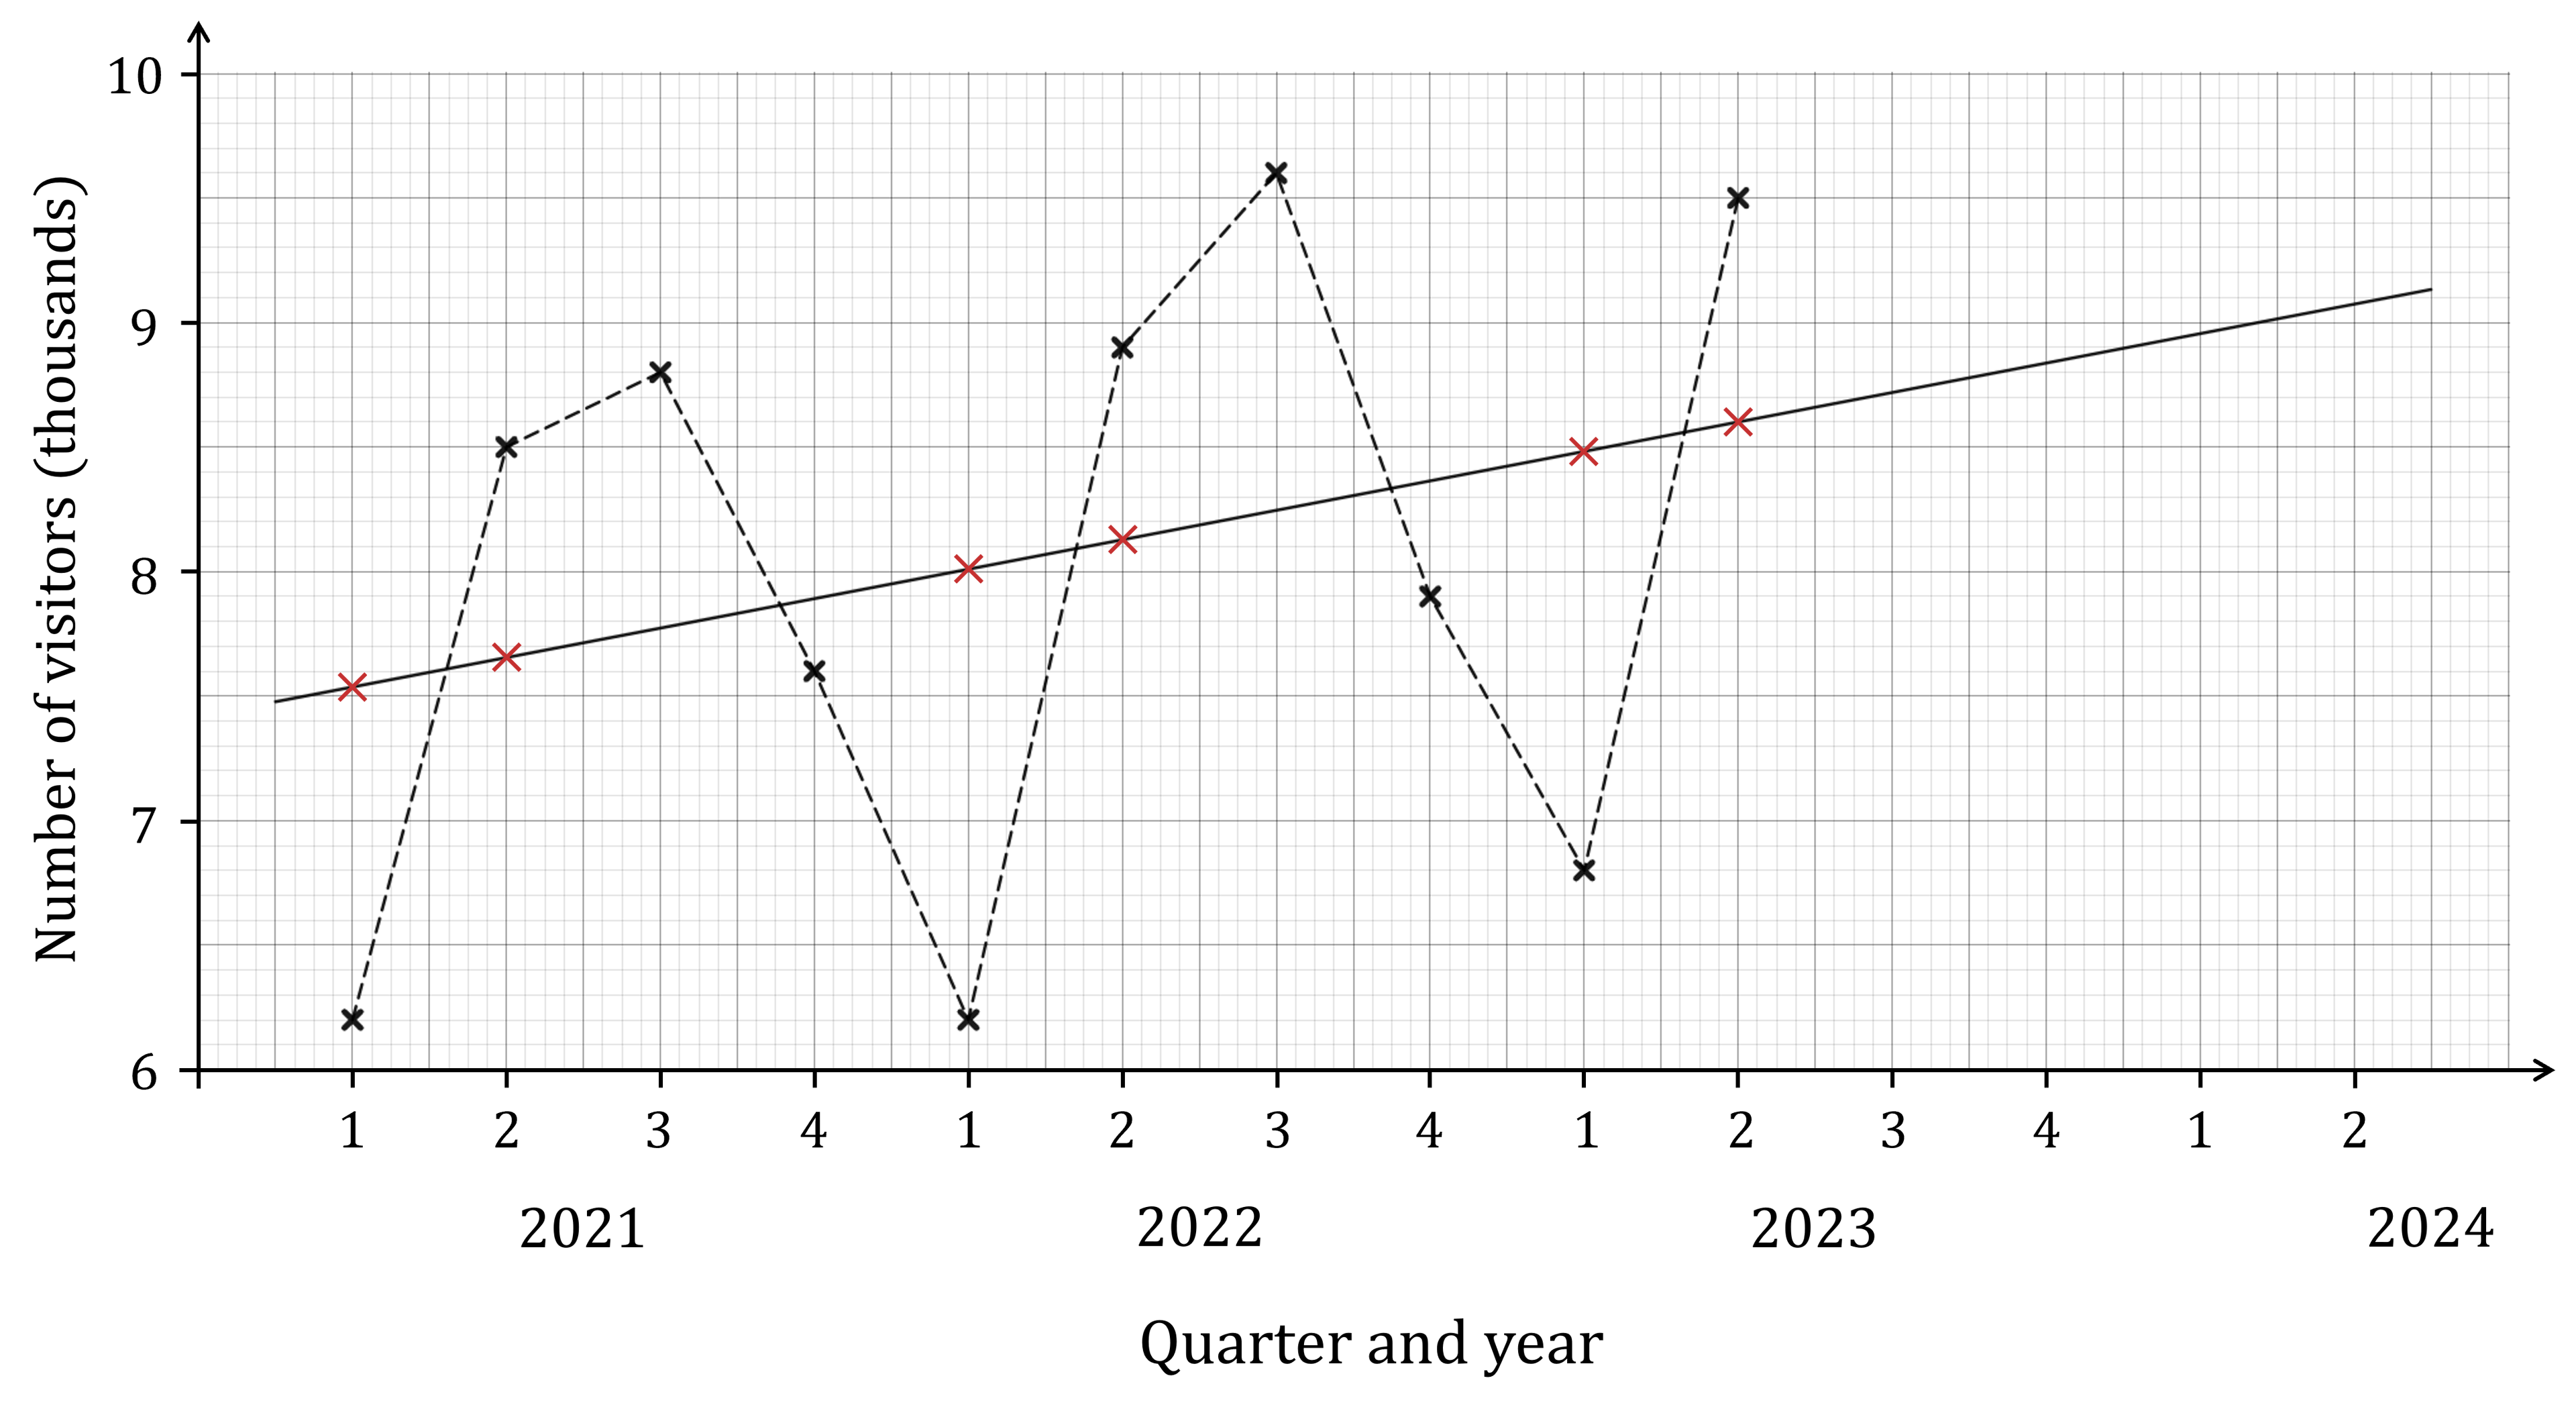
The time series graph shows the number of visitors to Wayne’s World of Widgets for 2021, 2022 and the first two quarters of 2023.

The moving average points for the four point moving averages have also been plotted on the graph, along with the trend line based on those points.
(a) Describe the general trend shown in the data.
The trend line is going up (has a positive gradient), so there is a rising trend
This means visitor numbers are increasing over time
The trend line is going up from left to right, which means there is a rising trend. The number of visitors to Wayne's World of Widgets is tending to increase over time.
(b) Describe the seasonal variations shown in the data, and suggest a reason for why these variations occur.
Note that the visitor numbers each year are higher than the trend line in quarters 2 (April to June) and 3 (July to September), and lower than the trend line in quarters 1 (January to March) and 4 (October to December)
This suggests that more people are visiting in the spring and summer months (while people are on holiday and the weather is nice), and less are visiting in the autumn and winter months (when people are travelling less and the weather isn't as nice)
The numbers of visitors are above the trend line for quarters 2 and 3 each year, and lower than the trend line for quarters 1 and 4 each year. More people are visiting Wayne's World of Widgets in the spring and summer months when the weather is nice and people tend to be on holiday, and less people are visiting in the autumn and winter.
Mean Seasonal Variation
What is mean seasonal variation?
The mean seasonal variation describes the average way that a seasonal value is different from the value on a trend line
It is also called the average seasonal effect
Make sure you are familiar with both terms!
First you need to calculate the seasonal variation for points on the graph
format('truetype')%3Bfont-weight%3Anormal%3Bfont-style%3Anormal%3B%7D%3C%2Fstyle%3E%3C%2Fdefs%3E%3Ctext%20font-family%3D%22Times%20New%20Roman%22%20font-size%3D%2218%22%20text-anchor%3D%22middle%22%20x%3D%2230.5%22%20y%3D%2216%22%3Eseasonal%3C%2Ftext%3E%3Ctext%20font-family%3D%22Times%20New%20Roman%22%20font-size%3D%2218%22%20text-anchor%3D%22middle%22%20x%3D%2297.5%22%20y%3D%2216%22%3Evariation%3C%2Ftext%3E%3Ctext%20font-family%3D%22Times%20New%20Roman%22%20font-size%3D%2218%22%20text-anchor%3D%22middle%22%20x%3D%22139.5%22%20y%3D%2216%22%3Eat%3C%2Ftext%3E%3Ctext%20font-family%3D%22Times%20New%20Roman%22%20font-size%3D%2218%22%20text-anchor%3D%22middle%22%20x%3D%22154.5%22%20y%3D%2216%22%3Ea%3C%2Ftext%3E%3Ctext%20font-family%3D%22Times%20New%20Roman%22%20font-size%3D%2218%22%20text-anchor%3D%22middle%22%20x%3D%22180.5%22%20y%3D%2216%22%3Epoint%3C%2Ftext%3E%3Ctext%20font-family%3D%22math143f4d31b04031e49f5eb18baba%22%20font-size%3D%2216%22%20text-anchor%3D%22middle%22%20x%3D%22211.5%22%20y%3D%2216%22%3E%3D%3C%2Ftext%3E%3Ctext%20font-family%3D%22Times%20New%20Roman%22%20font-size%3D%2218%22%20text-anchor%3D%22middle%22%20x%3D%22245.5%22%20y%3D%2216%22%3Eactual%3C%2Ftext%3E%3Ctext%20font-family%3D%22Times%20New%20Roman%22%20font-size%3D%2218%22%20text-anchor%3D%22middle%22%20x%3D%22290.5%22%20y%3D%2216%22%3Evalue%3C%2Ftext%3E%3Ctext%20font-family%3D%22math143f4d31b04031e49f5eb18baba%22%20font-size%3D%2216%22%20text-anchor%3D%22middle%22%20x%3D%22322.5%22%20y%3D%2216%22%3E%26%23x2212%3B%3C%2Ftext%3E%3Ctext%20font-family%3D%22Times%20New%20Roman%22%20font-size%3D%2218%22%20text-anchor%3D%22middle%22%20x%3D%22353.5%22%20y%3D%2216%22%3Etrend%3C%2Ftext%3E%3Ctext%20font-family%3D%22Times%20New%20Roman%22%20font-size%3D%2218%22%20text-anchor%3D%22middle%22%20x%3D%22389.5%22%20y%3D%2216%22%3Eline%3C%2Ftext%3E%3Ctext%20font-family%3D%22Times%20New%20Roman%22%20font-size%3D%2218%22%20text-anchor%3D%22middle%22%20x%3D%22426.5%22%20y%3D%2216%22%3Evalue%3C%2Ftext%3E%3C%2Fsvg%3E)
You will do this for all the ‘same seasons’ in the data set
For example, for all the ‘Quarter 1’ points for the different years on a time series graph
These values can be positive or negative
The mean seasonal variation for a season is the mean of the seasonal variations for that season
Add them together and divide by how many there are
Don’t forget the minus signs if the seasonal variations are negative
How can I use the mean seasonal variation to make predictions?
To make predictions, the trend line needs to be extended to the right
i.e. beyond the last known values in the data set
Then
Be aware that in going beyond the known data you are extrapolating, which is not always reliable
The prediction becomes less reliable the further into the future it is made for
It is most reliable when predicting only one cycle beyond the last known value
Trends and seasonal variations can also change unexpectedly
Exam Tip
An exam question may refer to either ‘mean seasonal variation’ or ‘average seasonal effect’
They both mean the same thing
For seasonal variations make sure to subtract the right way round
If the actual value is below the trend line the seasonal variation will be negative
Worked Example
The time series graph shows some information about the number of visitors to Wayne’s World of Widgets from 2021 to 2023. The trend line based on the moving point averages has also been drawn on the graph.

(a) Calculate the average seasonal effects for Quarters 1 and 2.
We need to read the Quarter 1 and Quarter 2 values off the trend line for 2021, 2022 and 2023
First find the seasonal variations for Quarter 1
Remember it's actual value minus trend line value
Quarter 1
![]()
![]()
![]()
The average seasonal effect for Quarter 1 is the mean of those three values
![]()
The average seasonal effect for Quarter 1 is -1.61 thousand visitors
A range of answers would be accepted to allow for variations in reading off graphs
Writing -1610 visitors would also be accepted
Now do the same thing for Quarter 2
Quarter 2
![]()
![]()
![]()
![]()
The average seasonal effect for Quarter 2 is 0.84 thousand visitors
A range of answers would be accepted to allow for variations in reading off graphs
Writing 840 visitors would also be accepted
(b) Hence predict the numbers of visitors for Quarters 1 and 2 of 2024.
We need to read the Quarter 1 and Quarter 2 values off the trend line for 2024
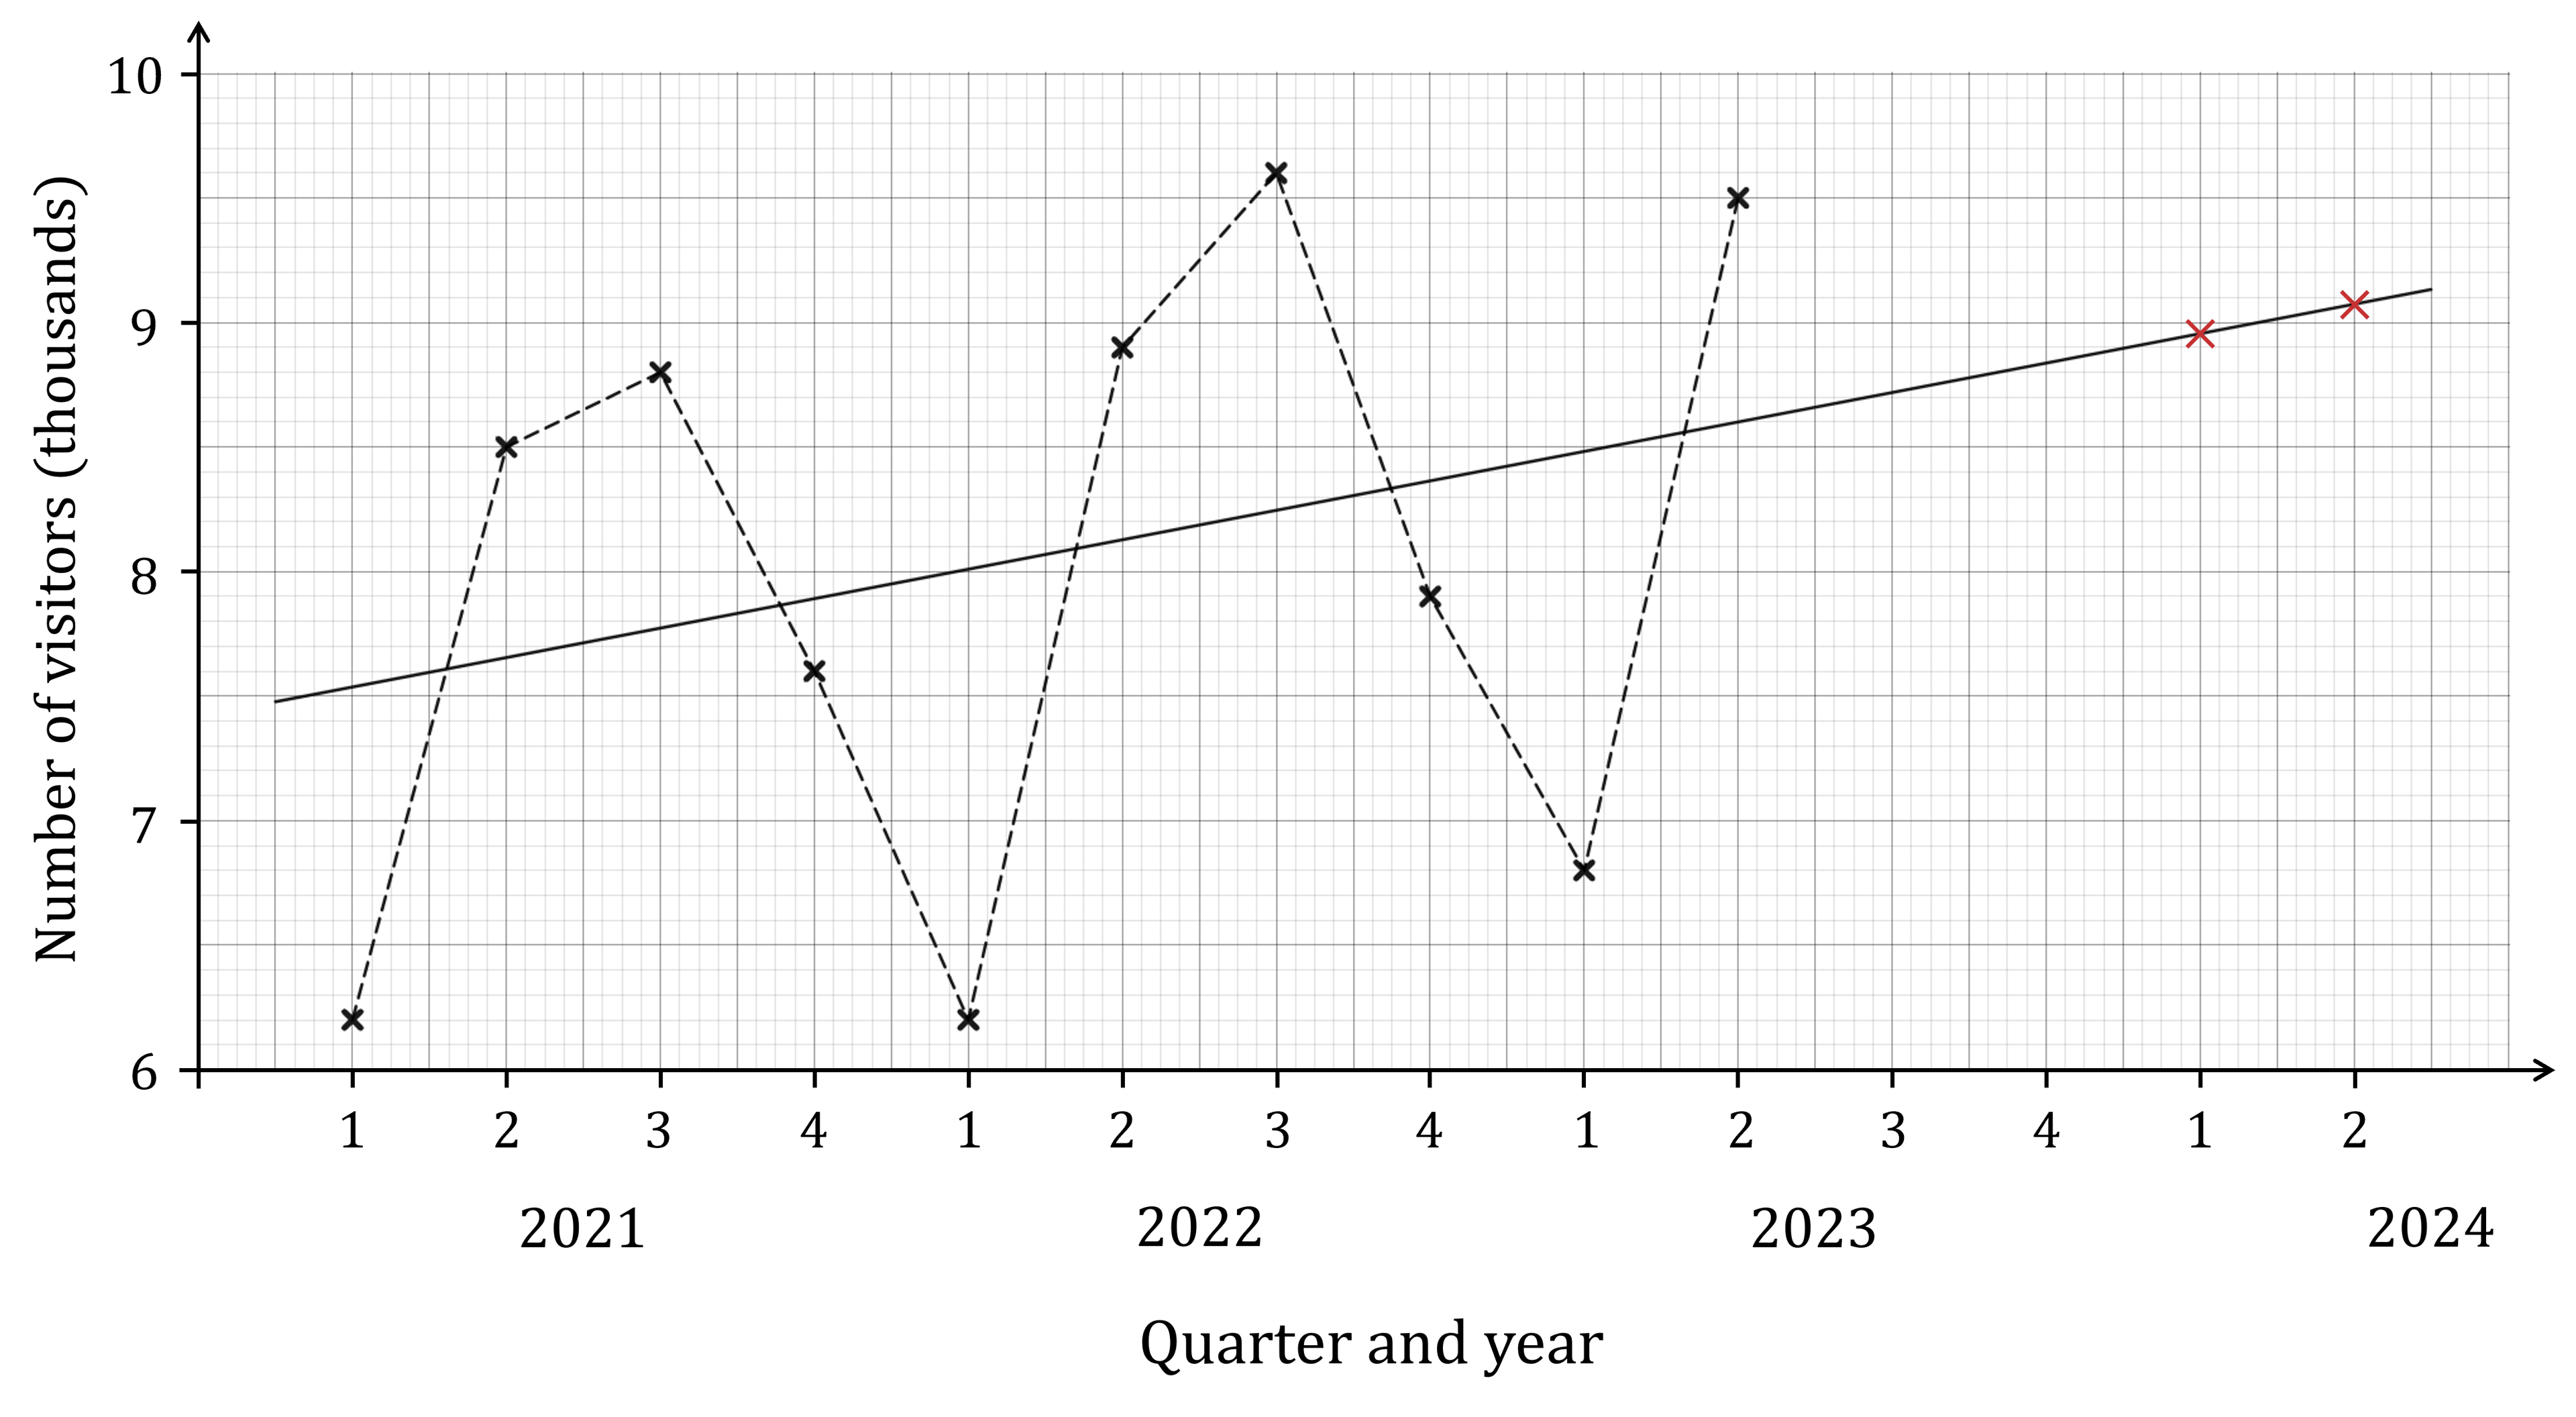
The predicted value for a quarter is the value from the trend line plus the average seasonal effect
If the average seasonal effect is negative, this will give a prediction lower than the trend line value
Quarter 1: ![]()
Quarter 2: ![]()
Remember that those numbers are thousands of visitors!
![]()
![]()
The predicted number of visitors for Quarter 1 in 2024 is 7340 visitors
The predicted number of visitors for Quarter 2 in 2024 is 9910 visitors
A range of answers would be accepted to allow for variations in reading off graphs

You've read 0 of your 0 free revision notes
Get unlimited access
to absolutely everything:
- Downloadable PDFs
- Unlimited Revision Notes
- Topic Questions
- Past Papers
- Model Answers
- Videos (Maths and Science)
Did this page help you?