Quality Assurance (Edexcel GCSE Statistics)
Revision Note

Author
RogerExpertise
Maths
Distribution of Sample Means
It is possible to take several different samples from a population, and calculate the mean for each sample
The set of sample means is more closely distributed than the individual data values from the population
e.g. the range of the set of sample means is smaller than the range for the entire population
This is because the mean for each sample is in between the biggest and smallest values in the sample
and therefore in between the biggest and smallest values in the population
Worked Example
For each year group in a secondary school, the following table gives the smallest height, mean height, and greatest height for students in that year group.
year | smallest height (cm) | mean height (cm) | greatest height (cm) |
|---|---|---|---|
7 | 132 | 146 | 161 |
8 | 136 | 152 | 167 |
9 | 142 | 159 | 175 |
10 | 148 | 164 | 182 |
11 | 151 | 167 | 187 |
(a) Calculate the range for all the students in the school.
The smallest height in the school is 132 cm from Year 7
The greatest height is 187 cm from Year 11
Subtract those to find the range for the school
![]()
55 cm
(b) Calculate the range of the mean heights for the different year groups.
The smallest mean is 146 cm for Year 7
The greatest mean is 167 cm from Year 11
Subtract those to find the range for the mean heights
![]()
21 cm
(c) Compare the ranges calculated in parts (a) and (b) and suggest a reason for any differences.
The range for the school (55 cm) is greater than the range for the mean heights (21 cm). The mean for each year group is an average for the year group, so it is in between the smallest and greatest values. Therefore the range of the means is less than the range for the entire school.
Control Charts
What is quality assurance?
Quality assurance is a process used to make sure that manufactured products meet required standards
e.g. that products sold by weight or volume contain approximately the correct amount of product
It is usually impossible for each manufactured item to be exactly correct
But they shouldn't vary too much from the target values
To assure quality, samples are taken at regular intervals
and the means, medians and/or ranges of the samples are compared against target values
What is a control chart?
A control chart is a type of time series chart
It allows the calculated results for samples to be recorded
And it indicates whether any actions need to be taken
The horizontal axis will show the sample number (1, 2, 3, 4, 5, ...)
The vertical axis will show the sample mean (or sample median or range)
A horizontal line is drawn corresponding to the target value
This is the value (weight, length, etc.) that a 'perfect' item would have
Horizontal upper and lower action lines are drawn corresponding to the upper and lower action limits
If a plotted value is above the upper action line (or below the lower action line)
then the manufacturing process should be stopped
and any machinery, etc., should be reset to bring it back within the target limits
Horizontal upper and lower warning lines are drawn corresponding to the upper and lower warning limits
If a plotted value is between the two warning lines
then everything is assumed to be okay
If a plotted value is between a warning line and its corresponding action line
then everything might be okay
but another sample should be taken right away to make sure there is not a problem
For a properly functioning manufacturing process,
almost all sample values will fall within the action limits
So any values outside those limits indicate a likely problem
most sample values (about 95%) will fall within the warning limits
Any values outside those limits could just be random variation
but it is worth checking another sample to make sure
On a control chart for sample range usually only the upper warning and action limits will be shown
This is because the target range is usually zero
i.e. every item being the exact target weight or volume, with no variation
So it is only a problem if the range becomes too large
A control chart for sample range can spot problems that a chart using sample mean or median would not
e.g. a very large and a very small data value can 'cancel each other out' when calculating the mean
But you don't want manufactured items being too different from the target value
How do I find the action and warning limits to use on a control chart?
You need to be able to calculate the warning and action limits for a control chart using the sample mean
If the sample median or sample range is used then the question will tell you the limits to use
The target value will be the mean (
 ) of the population
The warning and action limits depend on the standard deviation (
 ) of the population
The warning limits are set two standard deviations above and below the mean
The action limits are set three standard deviations above and below the mean
Sample means are normally distributed
This means that approximately 95% of sample means will fall within the
format('truetype')%3Bfont-weight%3Anormal%3Bfont-style%3Anormal%3B%7D%3C%2Fstyle%3E%3C%2Fdefs%3E%3Ctext%20font-family%3D%22Times%20New%20Roman%22%20font-size%3D%2218%22%20font-style%3D%22italic%22%20text-anchor%3D%22middle%22%20x%3D%225.5%22%20y%3D%2216%22%3E%26%23x3BC%3B%3C%2Ftext%3E%3Ctext%20font-family%3D%22math196da2f590cd7246bbde0051047%22%20font-size%3D%2216%22%20text-anchor%3D%22middle%22%20x%3D%2219.5%22%20y%3D%2216%22%3E%26%23xB1%3B%3C%2Ftext%3E%3Ctext%20font-family%3D%22Times%20New%20Roman%22%20font-size%3D%2218%22%20text-anchor%3D%22middle%22%20x%3D%2231.5%22%20y%3D%2216%22%3E2%3C%2Ftext%3E%3Ctext%20font-family%3D%22Times%20New%20Roman%22%20font-size%3D%2218%22%20font-style%3D%22italic%22%20text-anchor%3D%22middle%22%20x%3D%2241.5%22%20y%3D%2216%22%3E%26%23x3C3%3B%3C%2Ftext%3E%3C%2Fsvg%3E) warning limits
warning limitsSo even for a properly functioning process about 1 in 20 sample means will fall outside the warning limits
And close to 100% of sample means will fall within the
format('truetype')%3Bfont-weight%3Anormal%3Bfont-style%3Anormal%3B%7D%3C%2Fstyle%3E%3C%2Fdefs%3E%3Ctext%20font-family%3D%22Times%20New%20Roman%22%20font-size%3D%2218%22%20font-style%3D%22italic%22%20text-anchor%3D%22middle%22%20x%3D%225.5%22%20y%3D%2216%22%3E%26%23x3BC%3B%3C%2Ftext%3E%3Ctext%20font-family%3D%22math196da2f590cd7246bbde0051047%22%20font-size%3D%2216%22%20text-anchor%3D%22middle%22%20x%3D%2219.5%22%20y%3D%2216%22%3E%26%23xB1%3B%3C%2Ftext%3E%3Ctext%20font-family%3D%22Times%20New%20Roman%22%20font-size%3D%2218%22%20text-anchor%3D%22middle%22%20x%3D%2231.5%22%20y%3D%2216%22%3E3%3C%2Ftext%3E%3Ctext%20font-family%3D%22Times%20New%20Roman%22%20font-size%3D%2218%22%20font-style%3D%22italic%22%20text-anchor%3D%22middle%22%20x%3D%2241.5%22%20y%3D%2216%22%3E%26%23x3C3%3B%3C%2Ftext%3E%3C%2Fsvg%3E) action limits
action limitsFor a properly functioning process hardly any sample means should fall outside the action limits
Exam Tip
Remember the difference between warning lines and action lines on a control chart
Results falling outside the warning lines might indicate a problem
Take another sample right away to check
Results falling outside the action lines almost definitely indicate a problem
Halt the process and reset the machines, etc., involved
Worked Example
On a production line machinery is set up to produce chocolate bars with a weight of 61.4 grams.
For quality control, random samples of size 5 are taken and the mean weight of each sample is calculated.
The production line is set so that the sample means should be normally distributed with a mean of 61.4 g and a standard deviation of 0.8 g.
(a) Using this information, draw warning lines on the control chart for the sample means. Action lines have already been drawn on the chart.
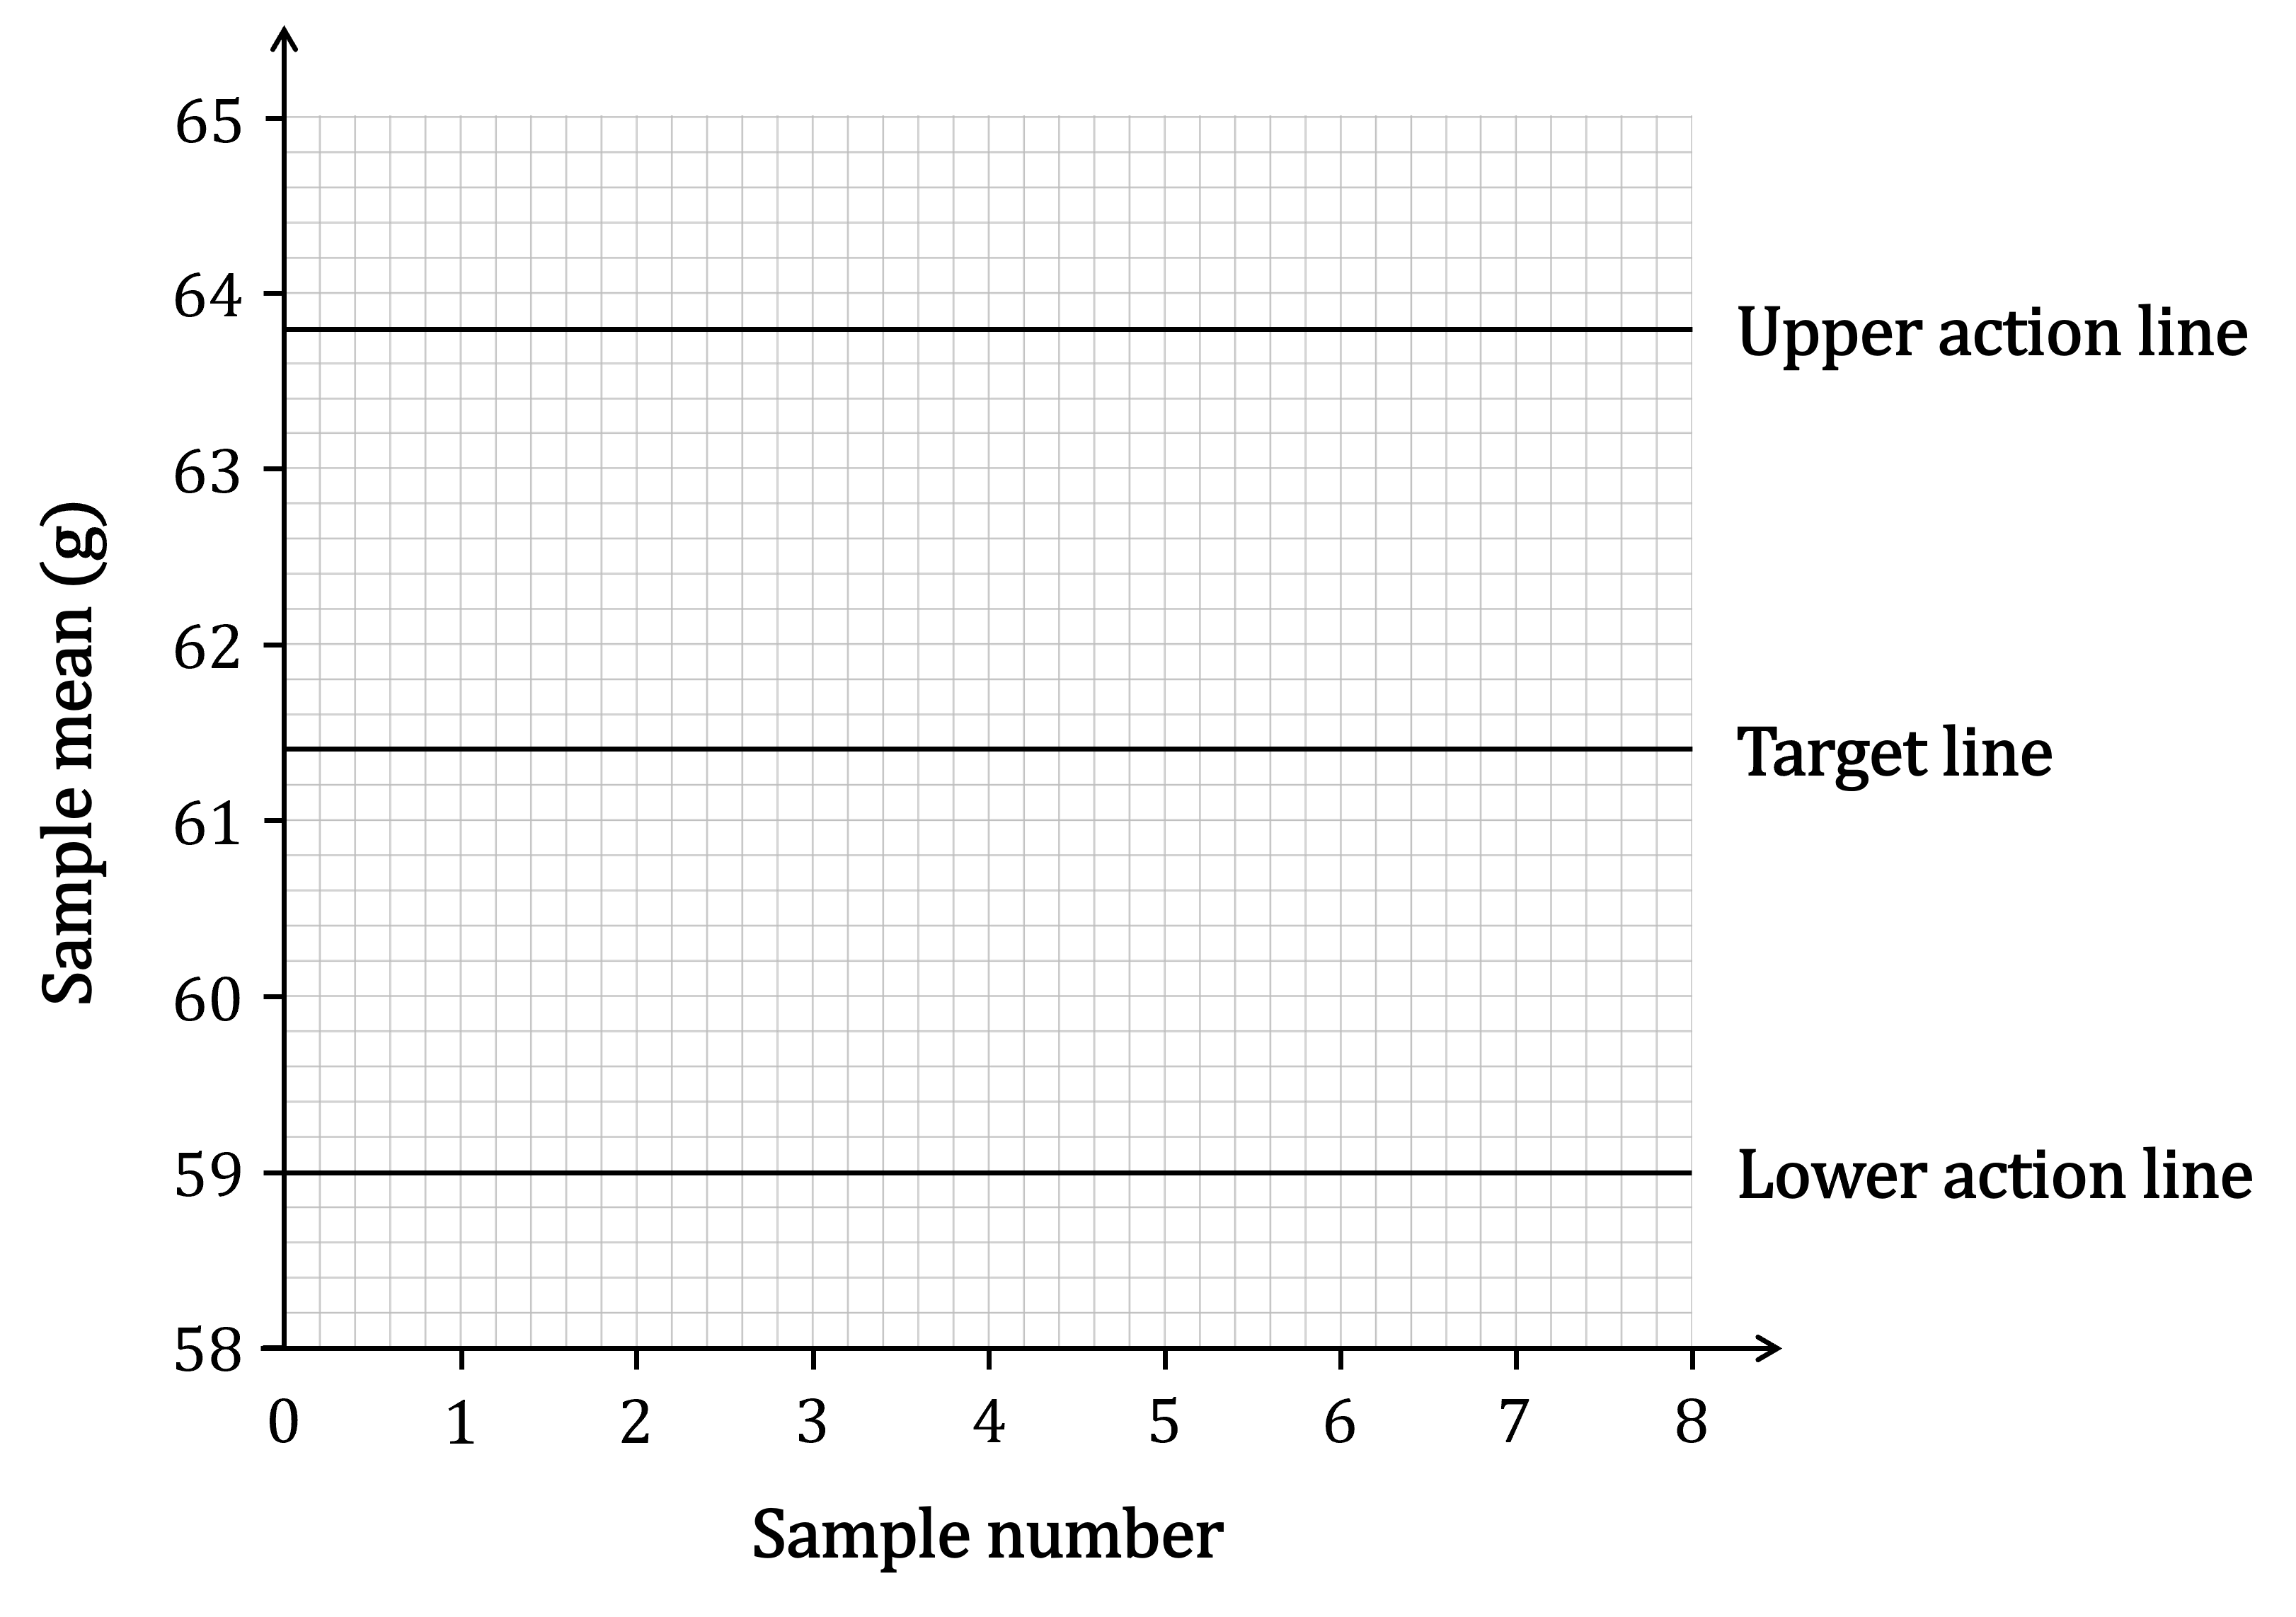
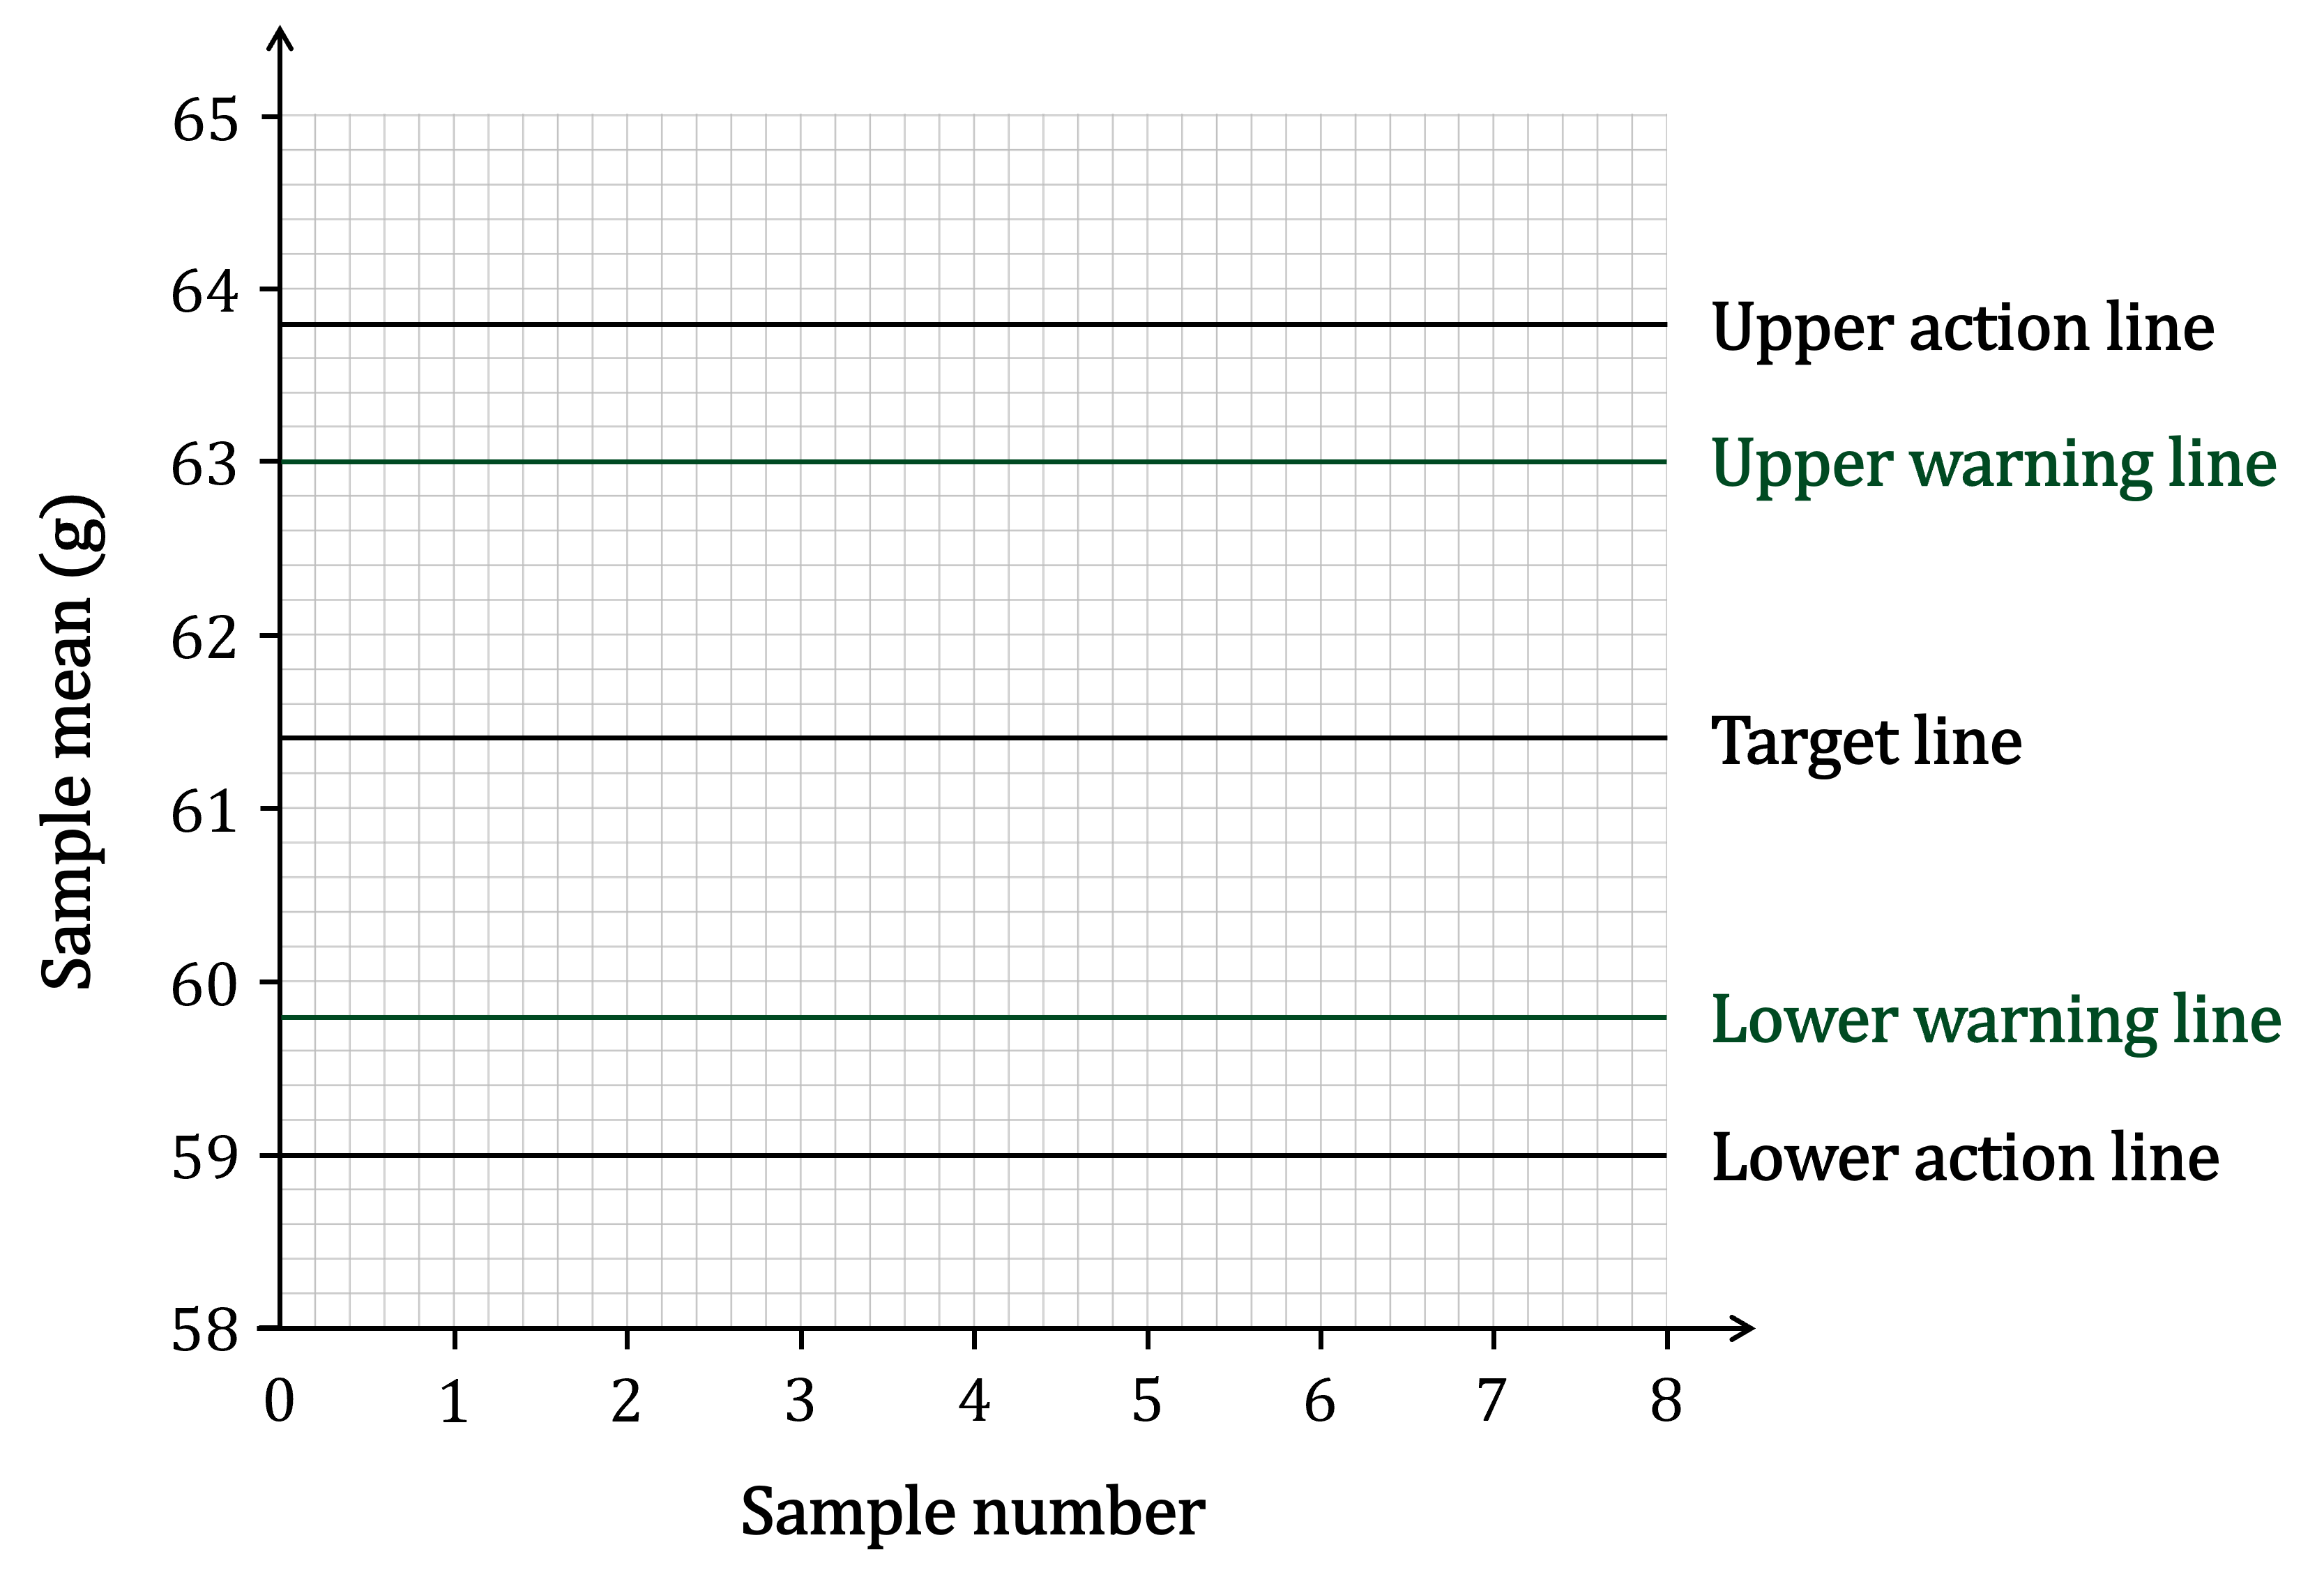
The warning lines are 2 standard deviations above and below the mean
Calculate these using ![]()
format('truetype')%3Bfont-weight%3Anormal%3Bfont-style%3Anormal%3B%7D%3C%2Fstyle%3E%3C%2Fdefs%3E%3Ctext%20font-family%3D%22Times%20New%20Roman%22%20font-size%3D%2218%22%20text-anchor%3D%22middle%22%20x%3D%229.5%22%20y%3D%2216%22%3E61%3C%2Ftext%3E%3Ctext%20font-family%3D%22math13121dea6a5a1588213f4022155%22%20font-size%3D%2216%22%20text-anchor%3D%22middle%22%20x%3D%2220.5%22%20y%3D%2216%22%3E.%3C%2Ftext%3E%3Ctext%20font-family%3D%22Times%20New%20Roman%22%20font-size%3D%2218%22%20text-anchor%3D%22middle%22%20x%3D%2227.5%22%20y%3D%2216%22%3E4%3C%2Ftext%3E%3Ctext%20font-family%3D%22math13121dea6a5a1588213f4022155%22%20font-size%3D%2216%22%20text-anchor%3D%22middle%22%20x%3D%2240.5%22%20y%3D%2216%22%3E%2B%3C%2Ftext%3E%3Ctext%20font-family%3D%22Times%20New%20Roman%22%20font-size%3D%2218%22%20text-anchor%3D%22middle%22%20x%3D%2253.5%22%20y%3D%2216%22%3E2%3C%2Ftext%3E%3Ctext%20font-family%3D%22math13121dea6a5a1588213f4022155%22%20font-size%3D%2216%22%20text-anchor%3D%22middle%22%20x%3D%2266.5%22%20y%3D%2216%22%3E%26%23xD7%3B%3C%2Ftext%3E%3Ctext%20font-family%3D%22Times%20New%20Roman%22%20font-size%3D%2218%22%20text-anchor%3D%22middle%22%20x%3D%2279.5%22%20y%3D%2216%22%3E0%3C%2Ftext%3E%3Ctext%20font-family%3D%22math13121dea6a5a1588213f4022155%22%20font-size%3D%2216%22%20text-anchor%3D%22middle%22%20x%3D%2286.5%22%20y%3D%2216%22%3E.%3C%2Ftext%3E%3Ctext%20font-family%3D%22Times%20New%20Roman%22%20font-size%3D%2218%22%20text-anchor%3D%22middle%22%20x%3D%2293.5%22%20y%3D%2216%22%3E8%3C%2Ftext%3E%3Ctext%20font-family%3D%22math13121dea6a5a1588213f4022155%22%20font-size%3D%2216%22%20text-anchor%3D%22middle%22%20x%3D%22106.5%22%20y%3D%2216%22%3E%3D%3C%2Ftext%3E%3Ctext%20font-family%3D%22Times%20New%20Roman%22%20font-size%3D%2218%22%20text-anchor%3D%22middle%22%20x%3D%22124.5%22%20y%3D%2216%22%3E63%3C%2Ftext%3E%3Ctext%20font-family%3D%22math13121dea6a5a1588213f4022155%22%20font-size%3D%2216%22%20text-anchor%3D%22middle%22%20x%3D%22135.5%22%20y%3D%2216%22%3E.%3C%2Ftext%3E%3Ctext%20font-family%3D%22Times%20New%20Roman%22%20font-size%3D%2218%22%20text-anchor%3D%22middle%22%20x%3D%22142.5%22%20y%3D%2216%22%3E0%3C%2Ftext%3E%3Ctext%20font-family%3D%22Times%20New%20Roman%22%20font-size%3D%2218%22%20text-anchor%3D%22middle%22%20x%3D%229.5%22%20y%3D%2263%22%3E61%3C%2Ftext%3E%3Ctext%20font-family%3D%22math13121dea6a5a1588213f4022155%22%20font-size%3D%2216%22%20text-anchor%3D%22middle%22%20x%3D%2220.5%22%20y%3D%2263%22%3E.%3C%2Ftext%3E%3Ctext%20font-family%3D%22Times%20New%20Roman%22%20font-size%3D%2218%22%20text-anchor%3D%22middle%22%20x%3D%2227.5%22%20y%3D%2263%22%3E4%3C%2Ftext%3E%3Ctext%20font-family%3D%22math13121dea6a5a1588213f4022155%22%20font-size%3D%2216%22%20text-anchor%3D%22middle%22%20x%3D%2240.5%22%20y%3D%2263%22%3E%26%23x2212%3B%3C%2Ftext%3E%3Ctext%20font-family%3D%22Times%20New%20Roman%22%20font-size%3D%2218%22%20text-anchor%3D%22middle%22%20x%3D%2253.5%22%20y%3D%2263%22%3E2%3C%2Ftext%3E%3Ctext%20font-family%3D%22math13121dea6a5a1588213f4022155%22%20font-size%3D%2216%22%20text-anchor%3D%22middle%22%20x%3D%2266.5%22%20y%3D%2263%22%3E%26%23xD7%3B%3C%2Ftext%3E%3Ctext%20font-family%3D%22Times%20New%20Roman%22%20font-size%3D%2218%22%20text-anchor%3D%22middle%22%20x%3D%2279.5%22%20y%3D%2263%22%3E0%3C%2Ftext%3E%3Ctext%20font-family%3D%22math13121dea6a5a1588213f4022155%22%20font-size%3D%2216%22%20text-anchor%3D%22middle%22%20x%3D%2286.5%22%20y%3D%2263%22%3E.%3C%2Ftext%3E%3Ctext%20font-family%3D%22Times%20New%20Roman%22%20font-size%3D%2218%22%20text-anchor%3D%22middle%22%20x%3D%2293.5%22%20y%3D%2263%22%3E8%3C%2Ftext%3E%3Ctext%20font-family%3D%22math13121dea6a5a1588213f4022155%22%20font-size%3D%2216%22%20text-anchor%3D%22middle%22%20x%3D%22106.5%22%20y%3D%2263%22%3E%3D%3C%2Ftext%3E%3Ctext%20font-family%3D%22Times%20New%20Roman%22%20font-size%3D%2218%22%20text-anchor%3D%22middle%22%20x%3D%22124.5%22%20y%3D%2263%22%3E59%3C%2Ftext%3E%3Ctext%20font-family%3D%22math13121dea6a5a1588213f4022155%22%20font-size%3D%2216%22%20text-anchor%3D%22middle%22%20x%3D%22135.5%22%20y%3D%2263%22%3E.%3C%2Ftext%3E%3Ctext%20font-family%3D%22Times%20New%20Roman%22%20font-size%3D%2218%22%20text-anchor%3D%22middle%22%20x%3D%22142.5%22%20y%3D%2263%22%3E8%3C%2Ftext%3E%3C%2Fsvg%3E)
Draw the lines on the chart corresponding to these values
Label your new lines clearly
A control chart for the sample ranges is also used and is shown below.
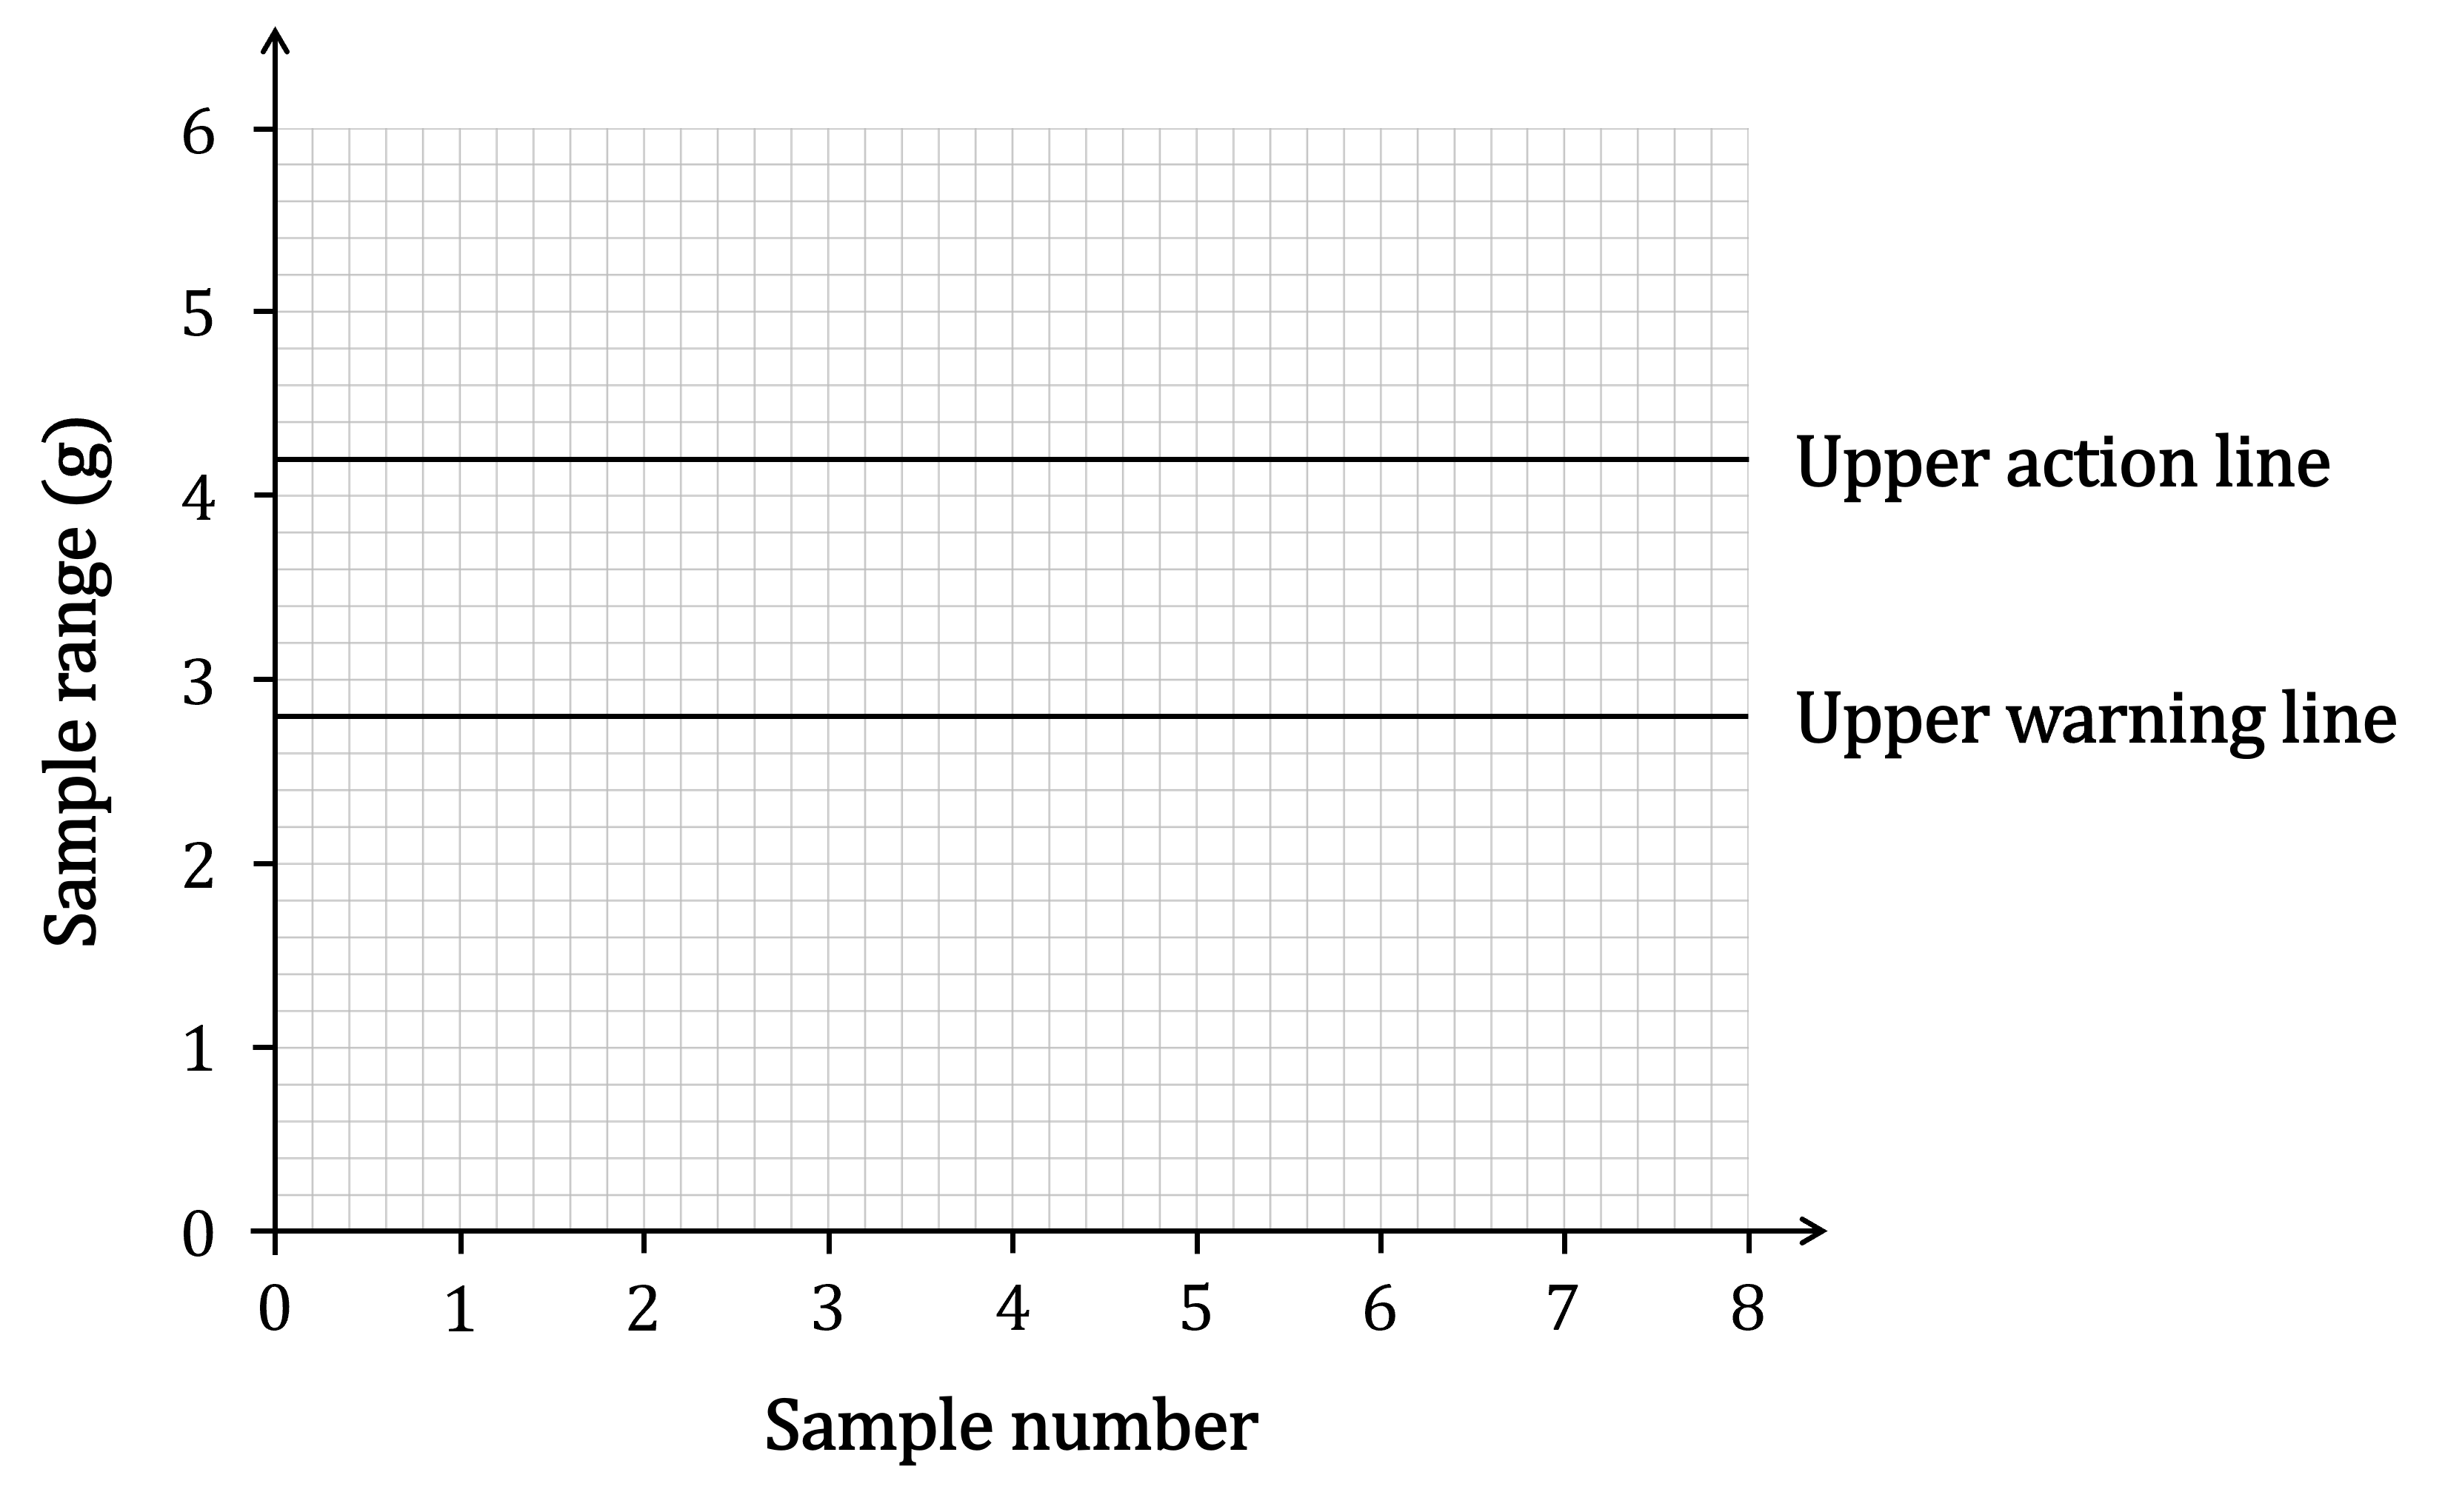
The first two samples taken have the following summary statistics.
Sample number | 1 | 2 |
|---|---|---|
Sample mean (g) | 62.4 | 59.6 |
Sample range (g) | 1.8 | 2.4 |
(b) Plot the summary statistics for these two samples on the control charts, and state with a reason what action(s), if any, should be taken as a result of these samples.
First plot the points for the two samples on the control charts
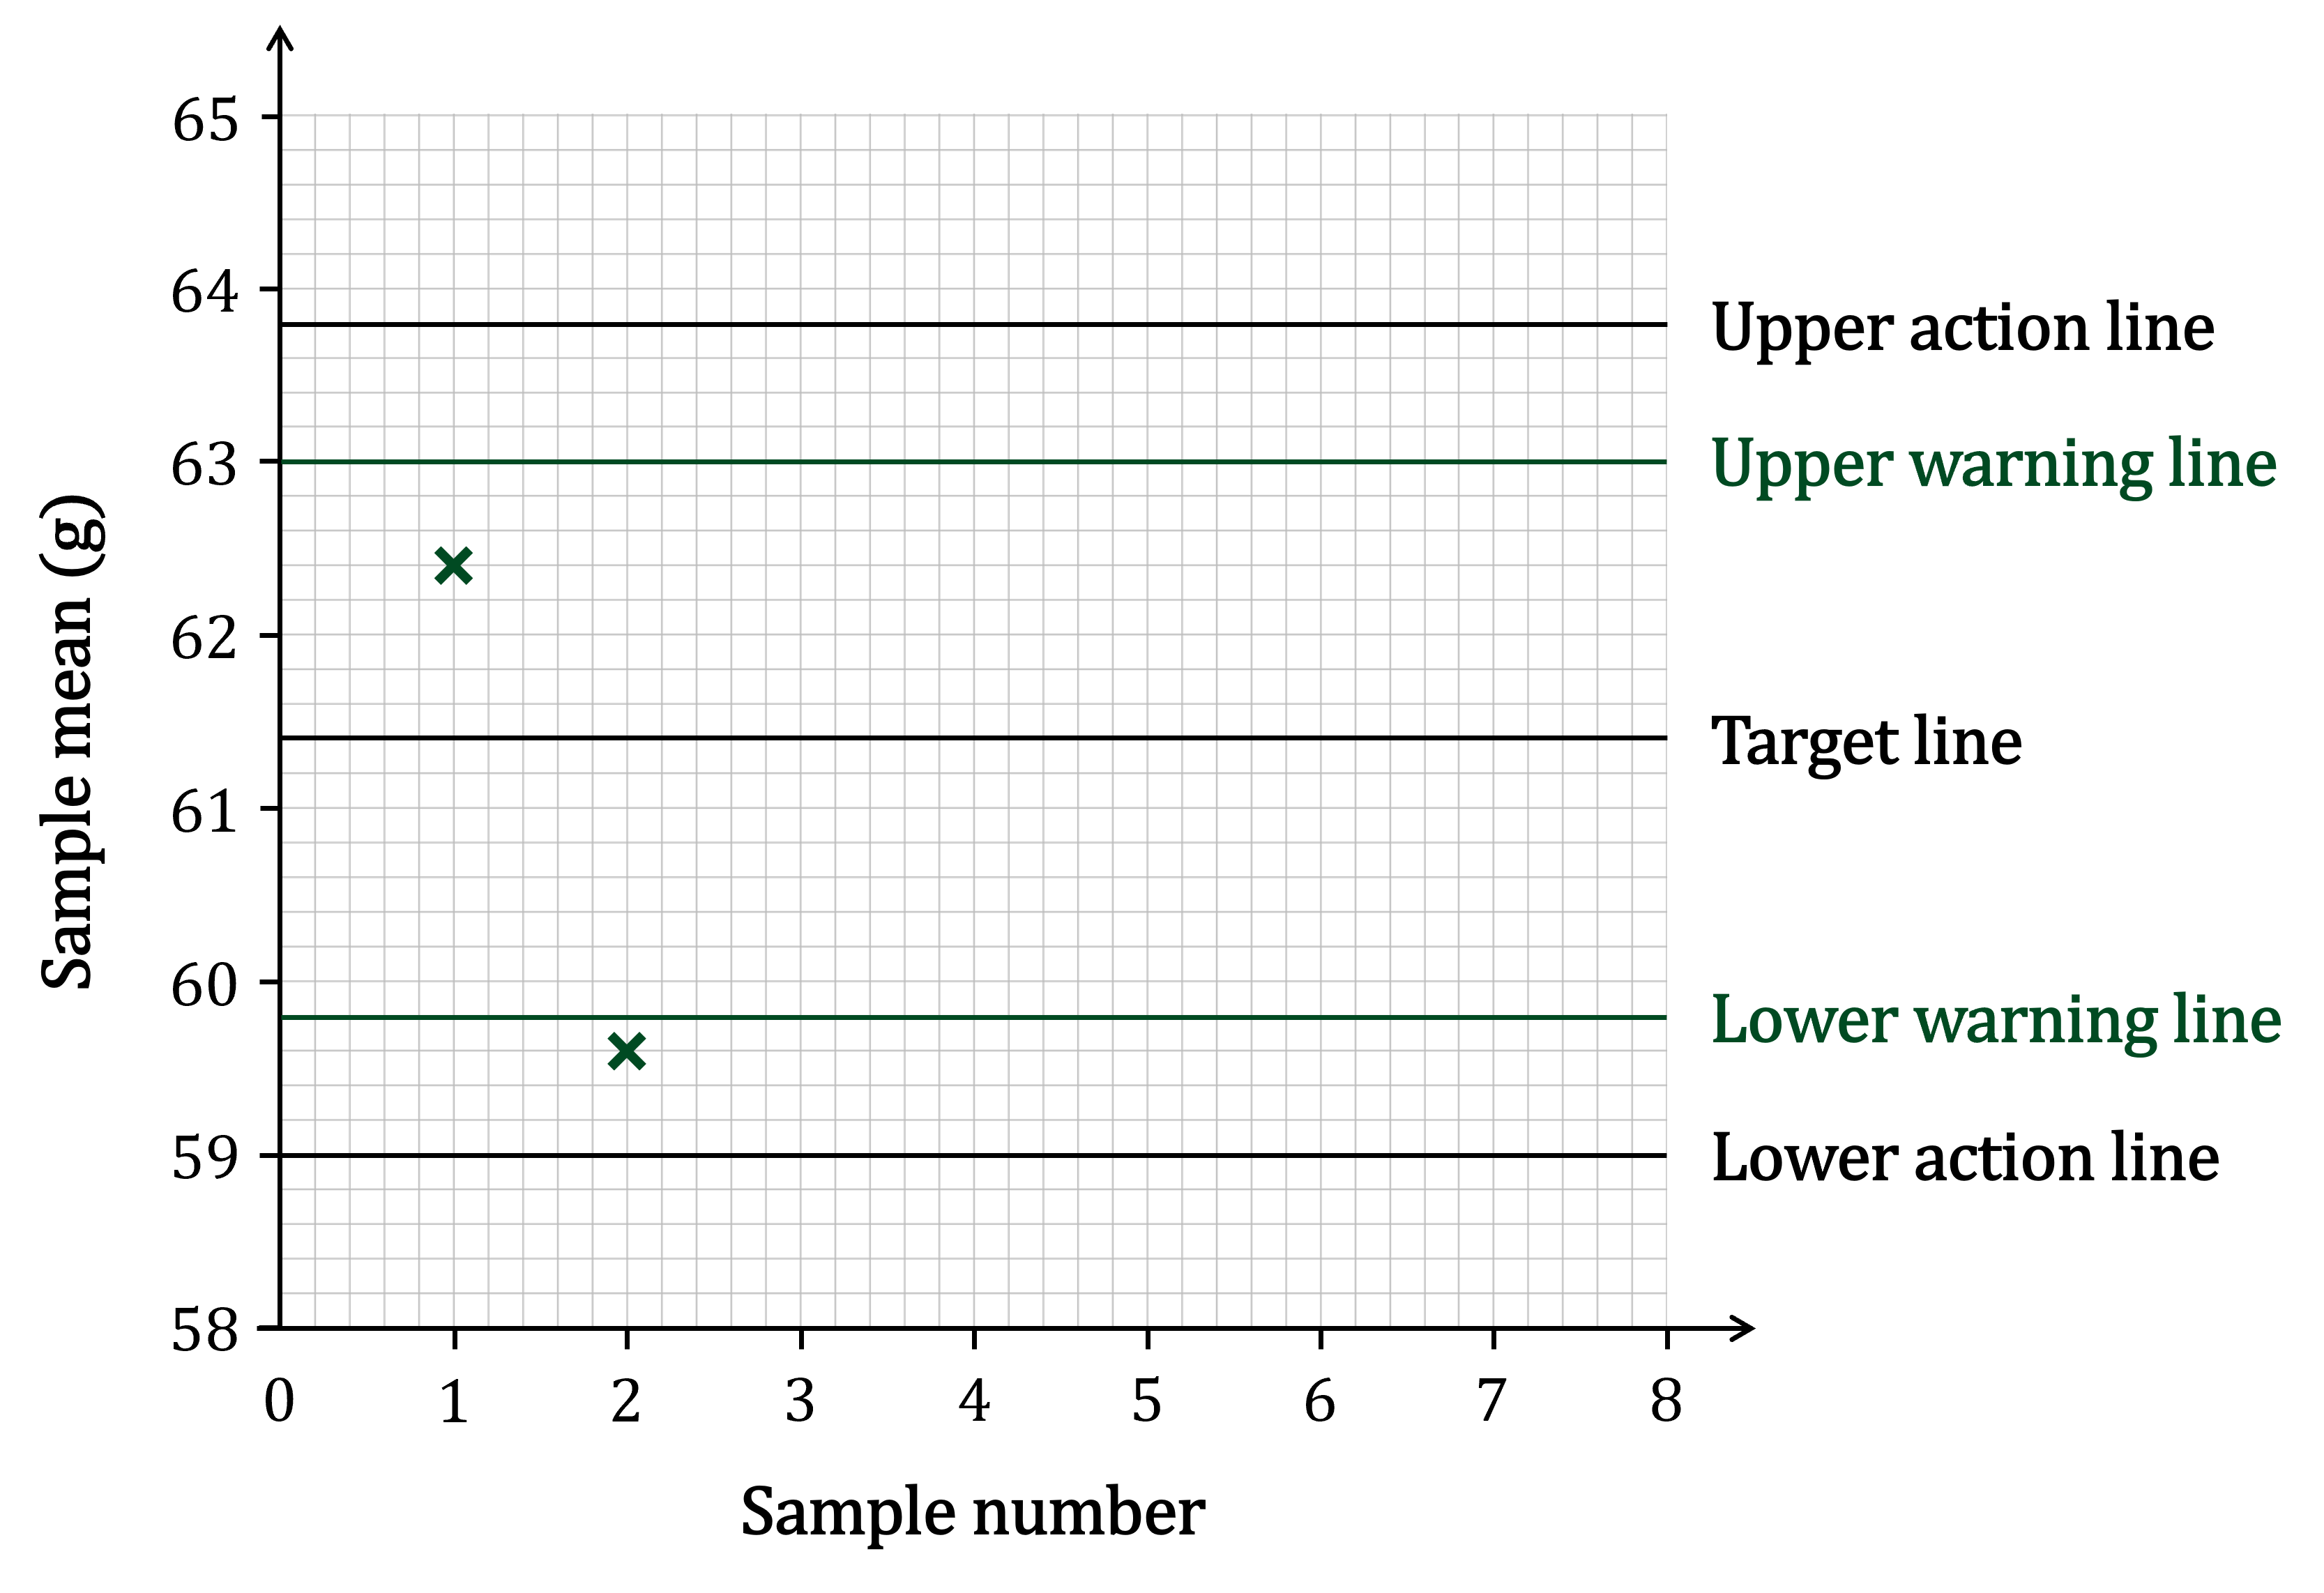
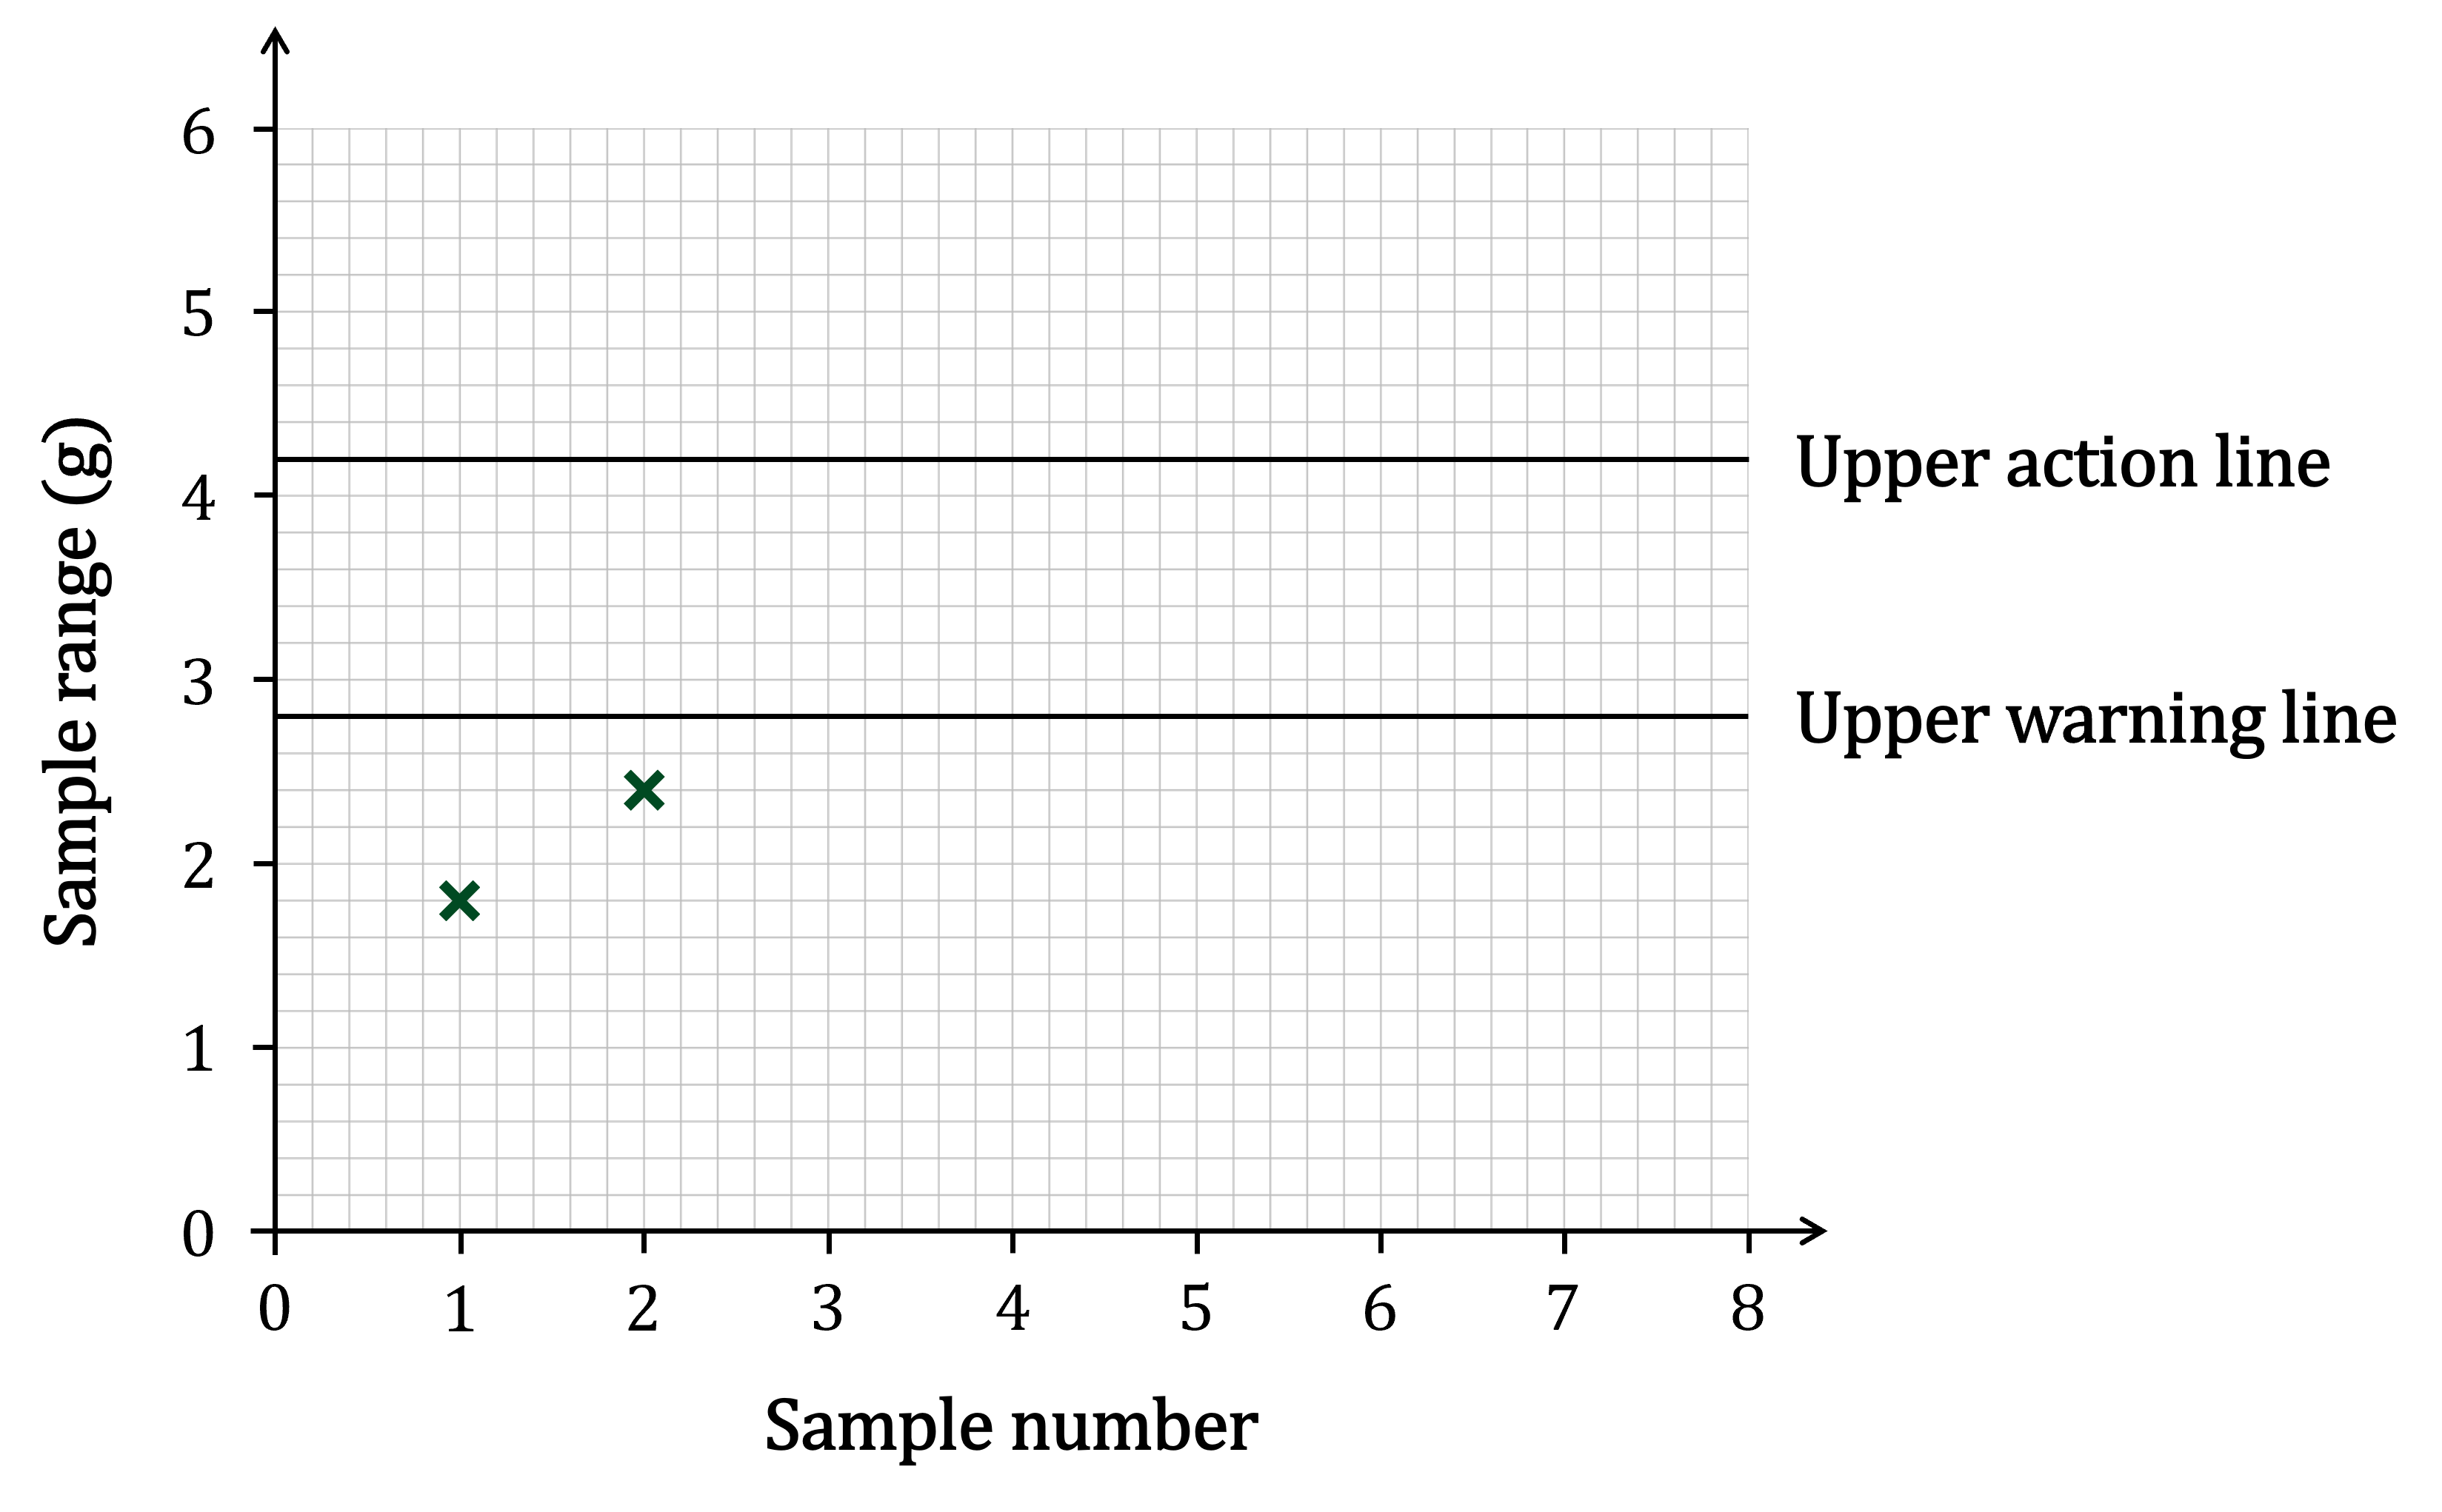
The points for Sample 1 are both within the warning limits
However the mean for Sample 2 is between the lower warning and action lines
This means another sample should be taken immediately to check for problems
There is no action needed for Sample 1 because both mean and range for the sample are within the warning limits. However for Sample 2 the sample mean is between the lower warning and action lines. Therefore another sample should be taken right away to see if there are any problems.
The chocolate bars for Sample 3 had the following masses:
58.8 g 61.3 g 61.7 g 64.0 g 62.2 g
(c) Use these results to complete both control charts for Sample 3, and state with a reason what action(s), if any, should be taken as a result of this sample.
First figure out the mean and range for Sample 3.
For the mean, add the values and divide by the number of values (5)
![]()
For the range, subtract the smallest value (58.8) from the largest value (64.0)
![]()
Plot these values on the two charts

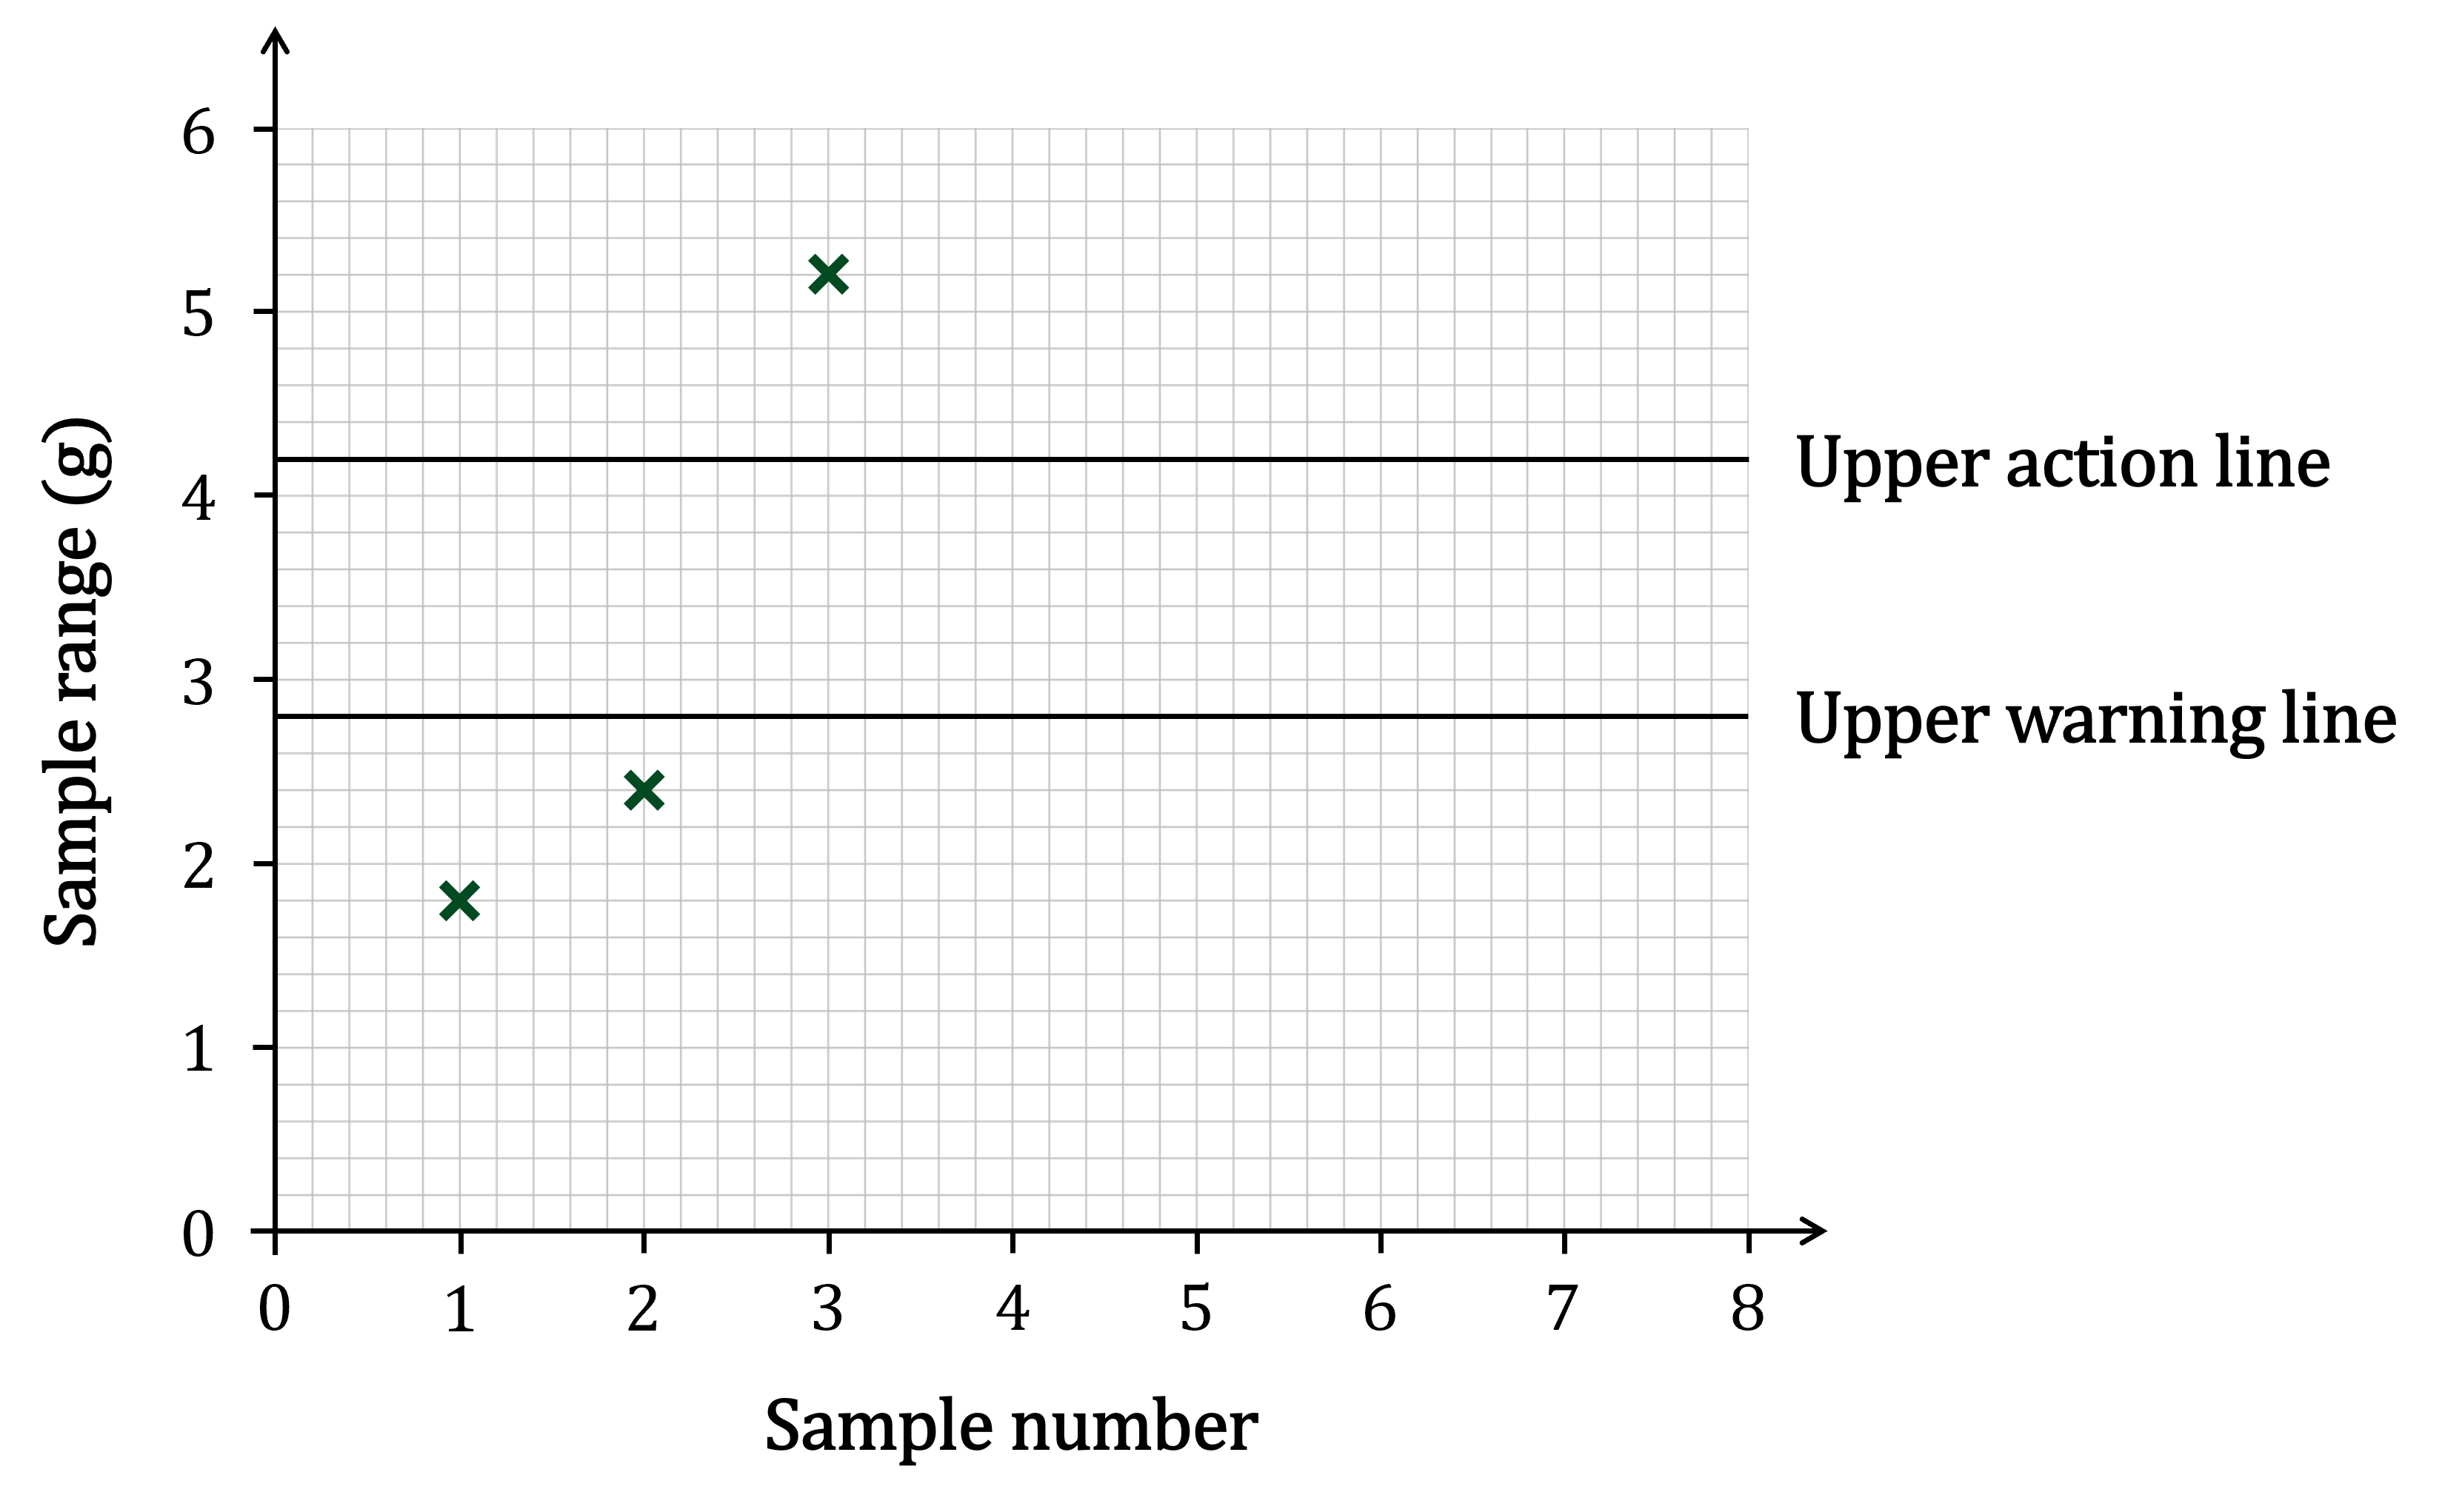
The sample mean for Sample 3 is quite close to the target
But the sample range is above the upper action line
This means the manufacturing process should be stopped and the machinery should be reset
The sample range for Sample 3 (5.2 g) is above the upper action line. Therefore the manufacturing process should be stopped, and the machinery for making the chocolate bars should be reset to bring things back within the limits.

You've read 0 of your 0 free revision notes
Get unlimited access
to absolutely everything:
- Downloadable PDFs
- Unlimited Revision Notes
- Topic Questions
- Past Papers
- Model Answers
- Videos (Maths and Science)
Did this page help you?